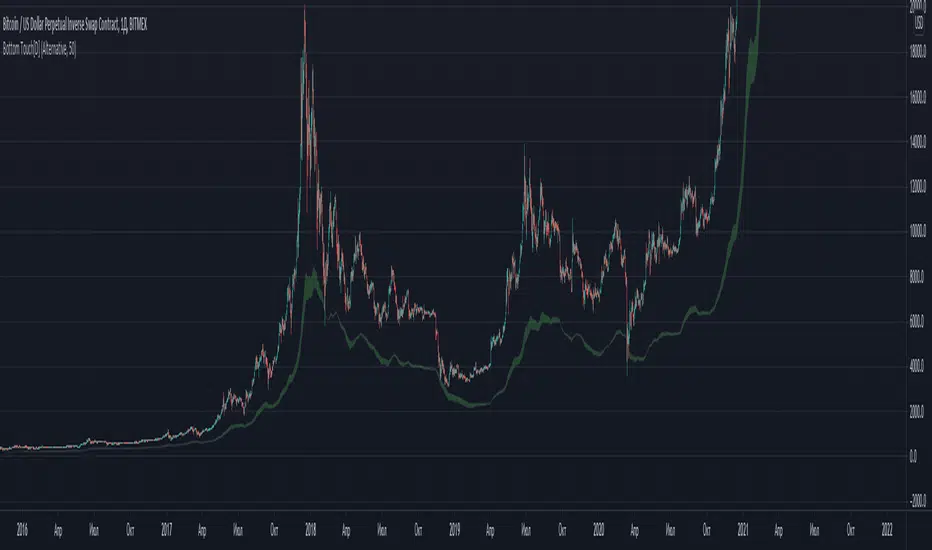
Bottom Touch[Dizart]--------------- ---------------
The indicator determines the bottom in the market, from which a rebound or a global reversal may start with a high probability. Works on any symbol or market.
tuning - If the asset is low volatility, then the price often does not reach the bottom. Adjust the `Bottom Touch` to the closest bottom on the graph.
--------------- ---------------
Индикатор определяет дно на рынке, от которого с большой вероятность может начаться отскок или глобальный разворот. Работает на любом символе или рынке.
tuning - Если актив низковолатильный, то цена часто не доходит до дна. Отрегулируйте `Bottom Touch` до ближайшего дна на графике.
Reversal
QFLOW SUITE QFLOW SUITE is a signal-based comprehensive trading suite for trading across all timeframes. It is designed to be a tool for discretionary traders and there are numerous ways to utilize this trading suite.
INCLUDES :
Buy / Sell Signals
Candle Coloring
Automatic Level Plotting
Trend Following System
Stop Loss Management System
Trend Reversal Mechanisms
Volatility Breakout Algorithm
Mean Reversion Algorithm
Buy / Sell Signals
There are multiple conditions detected by QFLOW Algorithm which are constantly worked on and improved
Candle Coloring
Color coding allows information compression and helps traders analyze the charts in a simple and intuitive manner. The base coloring is meant for trend following and consists of 3 colors :
Green - Trend up
Grey - Rangebound Consolidation
Red - Trend down
The second type of candle coloring is for the special conditions like buy / sell signals or divergences.
Volatility Breakout Algorithm
This part of the algorithm identifies a volatility breakout before it happens by showing a colored shaded squeeze which happens during consolidation. When a potential breakout is detected, an arrow is printed below or above that candle depending on the direction. Most times a second arrow is needed to signal a confirmed breakout. This arrow will be plotted with a 'B' or 'S' in the same color as the arrow.
False Breakout Detection
The algorithm is taught to detect these kind of false breakouts and prints a signal as an arrow with an 'F' below or above the candle.
Mean Reversion Algorithm
A hybrid algorithm that takes both momentum and mean reversion into account for high accuracy.
Automatic Level Plotting
Stop Loss Management System
QFLOW SUITE contains an adaptive trailing ATR system that can be used for stop loss management. It is plotted as a line below the price when the trend is up and above the price when the trend is down. It is highly effective because it is designed to adapt both to the true range ( a measure of the degree of price volatility ) as well as to the average direction change.
Extreme Background Highlighting
The algorithm is taught to analyze multiple technical components. When this option is turned on it will highlight the background when these extreme conditions are met. These highlights will often occur at the tops or bottoms and during times of high volatility. A trader can use this option as extra confluence when making certain trading decisions like taking profits or closing out trades.

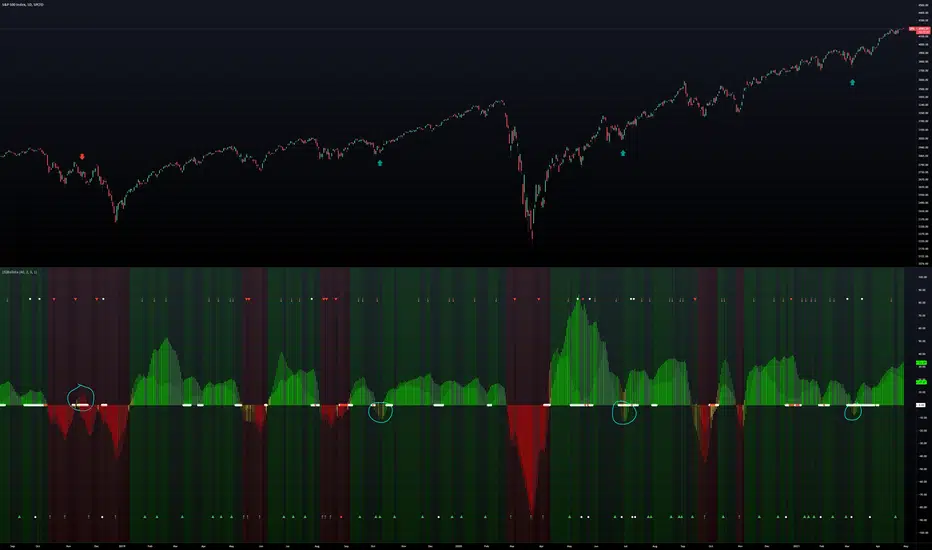
(JS) BallistaAlright so this is a script I made by combining two existing ones and making a really cool discovery that has proven very useful.
You'll notice that there are two separate oscillators that are laid on top of each other. The background oscillator is my "Tip-and-Dip" oscillator which you can see here (will refer to this as TnD from here), and the foreground oscillator from the Squeeze , which can be viewed here .
Initially I just wanted to see how they interacted with one another and compare them, but this led to some pretty interesting observations.
First let me go through the options real quick to get that out of the way, though it is mostly self-explanatory.
Lookback Period defines the amount of bars used for the TnD oscillator.
Smoothing Value smooths out the TnD output.
Standard Deviations is used to calculate the TnD formula.
Color Scheme is preset BG colors.
Using Dark Mode changes colors based on dark mode or not.
Squeeze Momentum On turns the Squeeze in the foreground off and on.
Arrows Off turns the arrows on the indicator off and on.
Now to explain the indicator a bit more. I have the default lookback period as 40 due to the Squeeze being 20, which makes the TnD oscillator the "slow" output with the Squeeze being the "fast" output.
Some initial observations were that when both the Squeeze and the TnD are moving in the direction, when the Squeeze is higher (uptrend) or lower (downtrend) it seems to indicate strength in the move. As the move loses steam you'll notice the Squeeze diverge from the TnD.
However, the most useful thing I discovered about the interaction between these two indicators is where the name for it came from. So if you aren't familiar with what a Ballista is, per Wikipedia, "The ballista... sometimes called bolt thrower, was an ancient missile weapon that launched either bolts or stones at a distant target." There are instances where the Squeeze seems to get ahead of itself and gets too far away from the TnD (which is the long term trend between the two). The key thing to look for is an "inverted squeeze" - this is when the squeeze oscillator ends up flipping against the TnD. When this occurs there is an extremely high probability that you'll see price shoot back the opposite way of the Squeeze.
I've been using this setup myself for about a year now and have been very satisfied with the results thusfar. I circled some examples on the SPX daily chart here to show you what I mean with the inverted Squeeze shooting back.
Chameleon indictor ║Tops and bottoms- This indicator uses a modified type of ADX, that offers a cleaner layout and improved signals. The indicator can be used by traders to identify possible tops, bottoms and changes in trends
- If the purple line moves downward after having been inside of the red line signals that a security possibly can have reached the bottom
- If the purple line moves upward after having been inside of the green line signals that a security possibly can reached the top
- The middle acts as a confirmation of the signal
// I have drawn lines on the chart to give examples of what the signals look like

HOLP/LOHPThe HOLP strategy was developed by trader-author John F. Carter in his book 'Mastering the trade: proven techniques for profiting from intraday and swing trading set ups' (ISBN 0-07-145958-8). The strategy, which gives buy signals, is a reversal strategy. Reversal strategies try to determine the point in time when a trend reverses direction. In his book John F. Carter is actually skeptical of taking a position against the trend, quoting classics like "never catch a falling knife" (buy a steep sell off) and "never step in front of a train" (short sell a strong market). Given his skepticism he decides to base his strategy on the one single factor which he deems relevant: the market price.

A Better Fractal (Williams)DESCRIPTION:
This is a more advanced version of the classic Williams Fractal algo, using a looped barindex iterator to examine highs/lows.
You may choose ideal or regular fractals, along with the amount of bars (periods) used to calculate; the minimum being 3. Oddnums only.
Ideal fractals = fractals with each bar needing to be lower/higher than the preceding bar, with the midbar at the apex.
Regular fractals = the typical Williams fractal, wherein each bar only has to be lower/higher than the midbar (apex) only.
How to trade? Combine with other indicators and use breakout or reversal strategies, typically. Set buy/sell stops at the high/low of a fractal, for instance
... to trade the breakout when it occurs. Or, track momentum when a fractal prints and trade accordingly. Or perhaps trade with the alligator or 3 EMA.
Experiment with different types of fractals to achieve the desired result, with higher period fractals obviously offering more solid indication though with higher lag.
Note: A fractal does not print until n/2 (rounded down) bars after, where n = the period you chose.

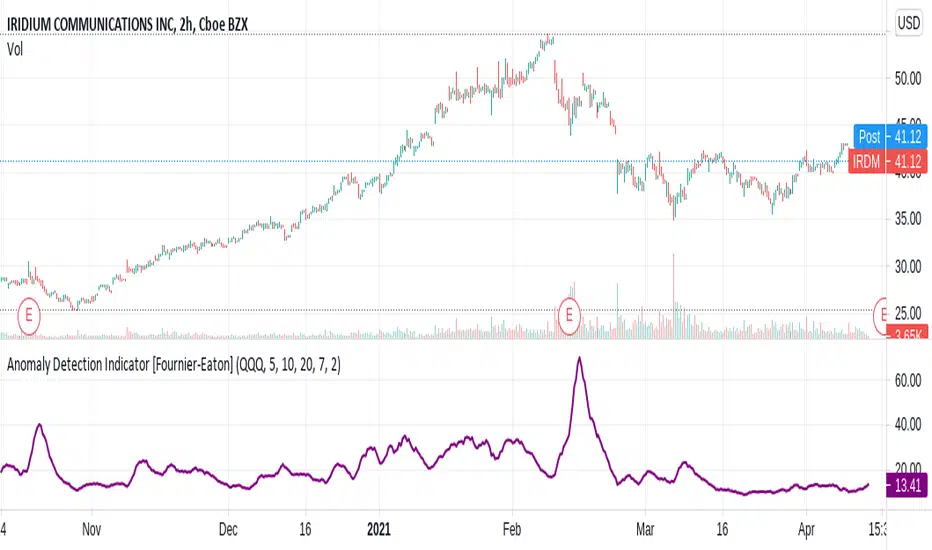
Anomaly Detection Indicator[Fournier-Eaton]Detect unusual activity with this script.
This algorithm should detect significant events RELATIVE to the benchmark of your choice. The default is benchmark is QQQ.
upcoming earnings should be visible
dividend announcements
news events relative to the stock
possible reversals
etc.
The granularity of the algorithm changes with selected time-frame.
This is an early version. Please suggest changes.
V0.1
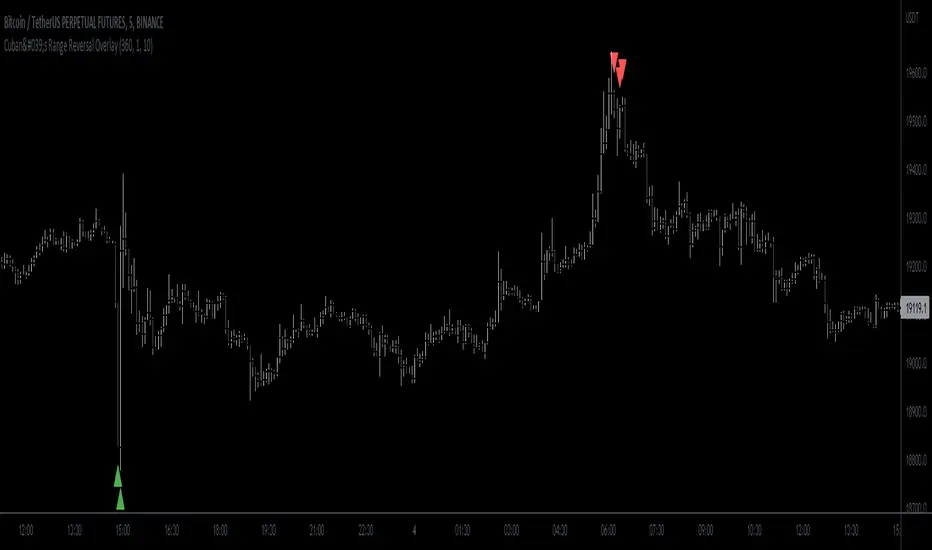
Cuban's Range Reversal OverlayBeen a minute since a public script!
This one looks at the range and recommends potential reversal depending on degree of overextension.
Originally intended for low timeframe short time horizon reversals but works well on higher timeframes as well.
Oscillator included in the image so you can see under the skirt and check what's happening.
FieryTrend IndicatorI created this indicator because it can be quite difficult sometimes to find the direction of the market, which supports and resistances are important, where to place targets, etc. This indicator is excellent for traders which trade on reversals and breakouts from resistances and supports.
The indicator tries to make it clear which areas are of importance and which are not. To find the market structure, all you have to do is to connect the dots by drawing a line between them.
By connecting the dots, it becomes clearer where important resistances and support areas are located. By making this information easier to digest you can place your entries, targets and stops easier and faster, becoming a better trader in the process. With connecting the dots, it might be the case that they won’t line up perfectly, which is fine. It’s all about the bigger picture.
The best time frames for this indicator are M15, H1 and H4. You can fiddle around with the Length input to get different results; I’ve found that the base input works the best for the aforementioned time frames.
For more examples, see below:

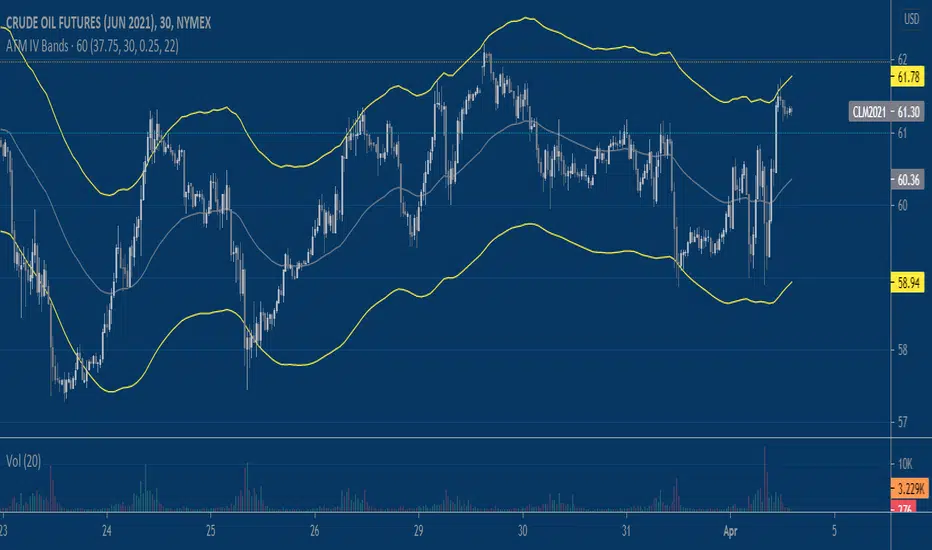
Implied Volatility BandsThis script produces price bands around an EMA based on a manually inputted Implied Volatility. The idea builds on my previous "Implied Move" script which helps visualize the distribution of prices that the market is 'pricing in' via options/implied volatility. It's up to the user to determine the implied volatility level they use, I like using the free version of QuikStrike that you can access via the CME Group website and then update the script's input daily. Another way to use the script is to input the implied volatility based on a forecast that you produce independently. Say implied volatility on June 2021 Crude Oil is 30% and you think it's rich by 2%, you can input 28% into the script to tweak the bands for a declining vol regime.
Inverse BandsThis was the result of quite some time spent examining how much information could be gleamed by studying the interactions between Keltner Channels, STARC Bands and Bollinger Bands. I was surprised by the results.
First of all, there are four fills that are black. Set the transparency of those to 0 and you'll see this indicator the way that it's meant to be seen. Those fills belong to unused sections of the Bollinger Bands.
There are two clouds which represent STARC Bands and the Keltner Channel. There is some delay when they flip from bullish (green) to bearish (red), but they are indicative of the trend. The space between them is black and the narrower that space is, the greater volatility is. Because of this, we don't need the exterior Bollinger Bands.
The Bollinger Bands remain visible as the yellow interior clouds on the top cloud and the blue interior clouds on the bottom cloud. Often, the thicker the yellow or blue cloud is, the less severe a throwback from a given trend reversal will be. Often the thinner that yellow or blue cloud is, the more severe the trend reversal will be. If price is rising into a thin interior yellow cloud, the following dip will be substantial. If price action dips towards a thicker interior blue cloud, often the pump following that dump will be less enthusiastic.
We preserve the Keltner Channel and STARC bands as our cloud because the way that they interact with the three basis lines yields a lot of information.
The yellow Bollinger basis line tells us about trend strength. The closer the BB basis line is to the top of the top cloud or the bottom of the bottom cloud, the stronger the trend is. When it enters the cloud very close to the bottom of the bottom cloud, you know you're looking at a strong pump, and vice versa when it's close to the top of the top cloud.
The purple Keltner Channel basis line and orange STARC Band basis line can forecast short term trend changes one candlestick in advance by contacting any line in either cloud. The moment either basis line touches or crosses any boundary of the clouds, you know that the next candle will change directions. In an uptrend, a touch or cross means the next candle will have a lower high point. In a downtrend, a cross or touch means the next candle will have a higher high point. This is most useful in scalping.
It'd be pretty easy to slap some crossover alerts on to this and useful considering that they come a candle in advance. Feel free to further explore and develop this.

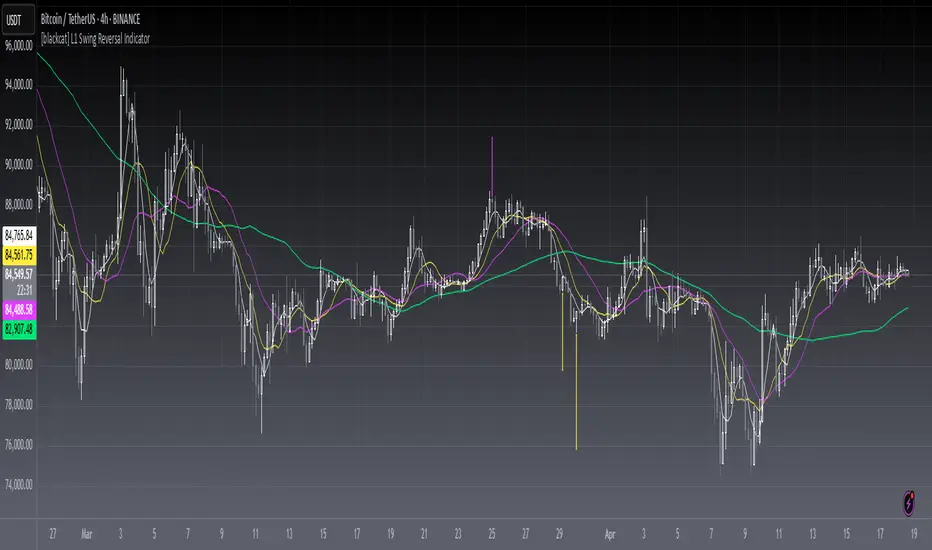
[blackcat] L1 Swing Reversal IndicatorLevel: 1
Background
Many asked me about swing reversal indicators. There are many but less of them can guarantee high win rate. Because market is complex, the reversals can be nested together, which means sub level reversals will be contained in higher level waves. This can be well explained by Elloit wave theory.
Function
Here it is a simple moving average based swing reversal indicator as an example for many others to improve it. Although it simple, it could be very powerful to dedicated trading pairs in specific time frame. One can adjust N1~N4 as SMA peiords from short to long to customized this indicator or even by trying different moving average types to enhance its accuracy.
Key Signal
N1~N4 --> SMA look back periods
OB --> Overbought Threshold
OS --> Oversold Threshold
Pros and Cons
Simpe but powerful. More feedbacks are appreciated.
Remarks
Easy to be customized or integrated to your trading system.
Readme
In real life, I am a prolific inventor. I have successfully applied for more than 60 international and regional patents in the past 12 years. But in the past two years or so, I have tried to transfer my creativity to the development of trading strategies. Tradingview is the ideal platform for me. I am selecting and contributing some of the hundreds of scripts to publish in Tradingview community. Welcome everyone to interact with me to discuss these interesting pine scripts.
The scripts posted are categorized into 5 levels according to my efforts or manhours put into these works.
Level 1 : interesting script snippets or distinctive improvement from classic indicators or strategy. Level 1 scripts can usually appear in more complex indicators as a function module or element.
Level 2 : composite indicator/strategy. By selecting or combining several independent or dependent functions or sub indicators in proper way, the composite script exhibits a resonance phenomenon which can filter out noise or fake trading signal to enhance trading confidence level.
Level 3 : comprehensive indicator/strategy. They are simple trading systems based on my strategies. They are commonly containing several or all of entry signal, close signal, stop loss, take profit, re-entry, risk management, and position sizing techniques. Even some interesting fundamental and mass psychological aspects are incorporated.
Level 4 : script snippets or functions that do not disclose source code. Interesting element that can reveal market laws and work as raw material for indicators and strategies. If you find Level 1~2 scripts are helpful, Level 4 is a private version that took me far more efforts to develop.
Level 5 : indicator/strategy that do not disclose source code. private version of Level 3 script with my accumulated script processing skills or a large number of custom functions. I had a private function library built in past two years. Level 5 scripts use many of them to achieve private trading strategy.
Whole NumbersThis is a simple indicator for the whole numbers.
It breaks down every pair for 10 pips.
Its also simple and nice to use

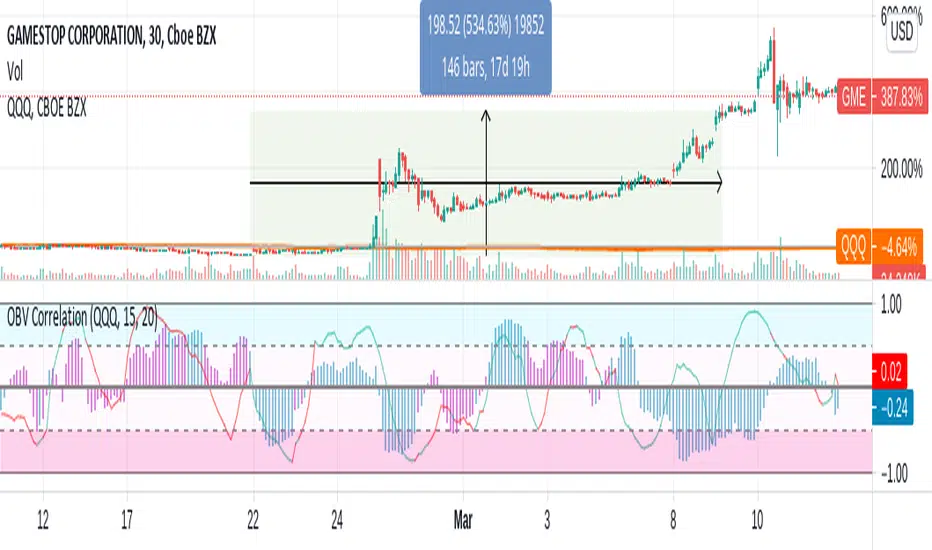
OBV Correlation [Fournier-Eaton]This is the On Balance Volume Correlation (And Price Correlation) Indicator. Directions of each has been encoded with color.
This Indicator is one of a series of scripts which I hope will aid in volume analysis.
The primary component is the histogram plot which represents the correlation between the direction of obv of your current equity and your chosen reference equity.
I have included the direction of OBV for your currently plotted equity encoded as color. (Thus you know that if the plot is negative and blue, that the correlation is negative but the OBV for your current equity is increasing.)
Furthermore, I included a supplementary price correlation line for the given equities. This line has had price direction encoded as color for quick reference.
Thus as a quick example: if you see a blue negative histogram and an accompanying red positive line you know that: 1. obv is increasing and anti-correlated with your reference equity and the price is decreasing and positively correlated with your reference equity. A lot of information encoded in one plot.
If you find this at all useful, I'd love to hear from you.
Bradford Fournier-Eaton, PhD
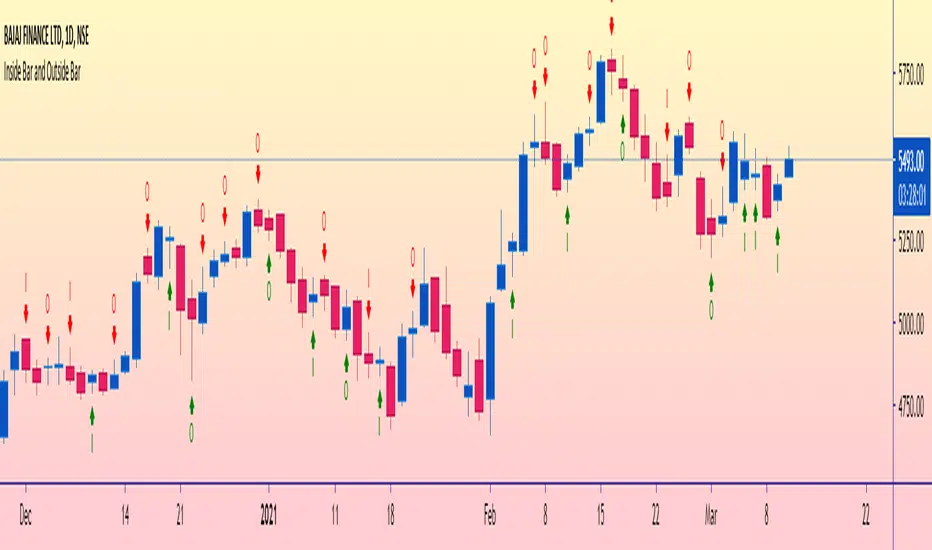
Inside Bar and special Outside Bar insider bar is old and classic theory. but special outside bar is type of trap by operator in stock market
use this only daily or weekly time frame
special out side bar is type of reversal

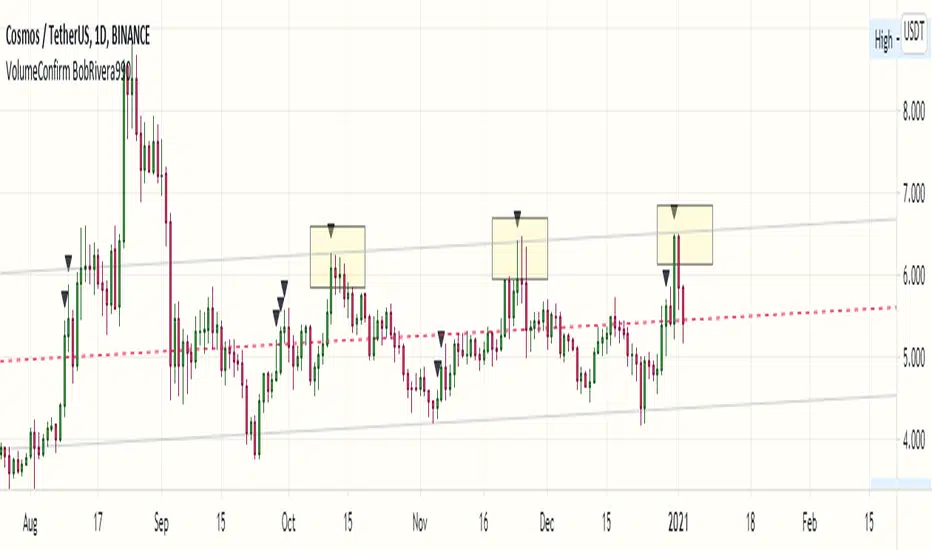
Volume Confirmation Signal by BobRivera990The purpose of this script is to determine the response of trading volume to price action
This is not an indicator but a set of four signals
1 - Bullish Strength Signal (Upward Green Triangle) :
If the resistance is broken at the same time is valid
this signal indicates the continuation of the bullish trend
the trading volume is relatively high.
If the bar is closed above the resistance level, It will probably turn into support.
2 - Bullish Reversal Signal (Upward Black Triangle) :
if the bar is closed above the support level is valid
this signal indicates trend reversal after a bearish candle
the trading volume is very high.
3 - Bearish Strength Signal (Downward Red Triangle) :
If the Support is broken at the same time is valid
this signal indicates the continuation of the bearish trend
the trading volume is relatively high.
If the bar is closed below the support level, It will probably turn into resistance.
4 - Bearish Reversal Signal (Downward Black Triangle) : if the bar is closed below the resistance level is valid
this signal indicates trend reversal after a bullish candle
the trading volume is very high.
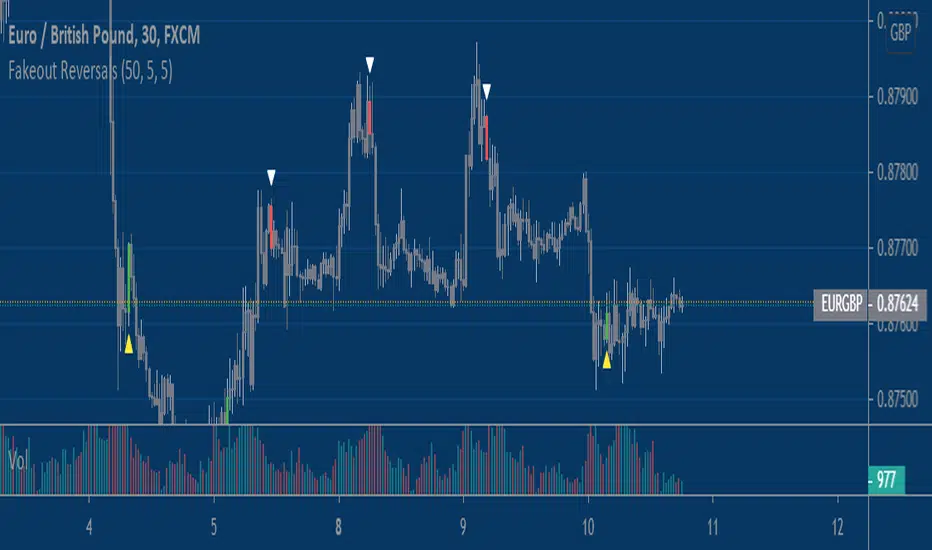
Fake-out ReversalsThis script combines two simple concepts, stop running and short term momentum, into a simple visual signal that can be applied to any market and any timeframe with some adjustment. It looks for price to violate a prior extreme within a certain lookback window, followed by price triggering a momentum filter that helps put the proverbial 'wind at your back' for the user. Users have the ability to customize three inputs; 1) Bars used to calculate price extremes 2)Bars since price violated that extreme 3)The sensitivity of the momentum filter.
You will find that these signals work best in choppy and rangebound price action, less so in trending/grinding markets. For entertainment/educational purposes only.
Enjoy!
The WWG Plan Indicator V2█ OVERALL
This indicator was specifically created for the Walsh Wealth Group.
In short it is a fusion of some of the most basic and widely used indicators to show overbought patterns and trend reversals.
Its best usage is with LTF scalping and agressive profit taking but can also be used to find HTF dips and buy-zones.
█ FEATURES
Buy Signal (Buy):
Printed only with all confirmations triggered
Small Buy Signal (B1 & B2)
Printed if some of the confirmations are triggered and can be treated as DCA entries or for further
confirmation with other indicators and basic TA.
Crayons (Color Bars):
Blue: RSI is oversold
Olive: RSI and Stoch RSI are oversold
Yellow: RSI, Stoch RSI are oversold and lower Bollinger Bands are crossed by Low
Orange: RSI, Stoch RSI and CCI are oversold
Trailing SL:
If activated in the config, a trailing SL can be displayed on the chart based on ATR.
█ SETTINGS
The underlying indicators used are RSI, Stoch RSI, Bollinger Bands, MACD and CCI.
All possible configs can be changed in the config settings.
█ GENERAL INFORMATION
Depending on the settings, the indicator performance will be highly affected.
This indicator is only displaying highly oversold areas and events of trend reversal it is not a *God*-Signal and will print false positives.
█ ALERTS
An alert for the main buy-signal is implemented and can be used via the TV alert functionality.

MyAlgo ZULU ZONESPLEASE READ THE ENTIRE POST BEFORE PURCHASING & USING THE MyAlgo Tool. Saves you and me some time in emails and messages. :)
This is the official version of MyAlgo ZULU ZONES
PLEASE UNDERSTAND THAT THIS IS A DIFFERENT AND SEPARATE PRODUCT AND SCRIPT FROM "MyAlgo SLIM" FROM THE MyAlgo TRADING TOOL SERIES
Description
ZULU Zones is a rework of a long-gone development from the early stages of MyAlgo.
It is an oscillator, which indicates the best timing for reversal zones, yet also in the settings allows the user to adjust itself to the given asset and its usual retraces/reversals, so it is easier to spot the next incoming reversal.
Side Notes
MyAlgo is being updated and upgraded very frequently to suit the requests of our customers.
This is not financial advice. Please read our disclaimer before using it.
Please refer to the signature field if you are interested in gaining access to this script.
Anything below this sentence will be Updates regarding MyAlgo


Upside reversalUpside reversal is a condition when price takes down prior day's low but closes in an upper half on a daily range

Overnight Bollinger Band ExtremesThis script is a combination of my overnight fakeout script and bollinger band color bars. It's designed to be used on CME/CBOT Equity Indexes during their GLOBEX session. It uses the built in Bollinger Band script and highlights bars that exceed the upper/lower bands during the overnight session.
