Z Score FilterComposite Risk Filter
This indicator works because it aggregates several independent but structurally important stress channels (currency strength, rates, equity volatility, bond volatility, and credit conditions) into a single normalized measure. Each input is transformed into a z-score, meaning the composite does not care about absolute levels, narratives, or regimes; it only measures whether conditions are tightening or easing relative to what has been normal recently. That makes the output robust to inflation, secular trends, and structural shifts that break simpler correlations.
What the indicator captures is not direction but constraint. Markets do not move because risk is “on” or “off”; they move because certain behaviors are more or less permitted under prevailing financial conditions. By identifying when systemic pressure is elevated, relaxed, or neutral, the indicator helps align trade expectations with the environment price is operating in. When used as a filter — not a signal — it reduces false confidence, improves expectancy selection, and keeps price in the primary role where it belongs.
Risk-off

Risk Filter Composite (DXY + US10Y + VIX + MOVE + Credit)Risk Filter Composite Indicator
This indicator is a contextual risk filter, not a trading signal. It combines five macro-market inputs — U.S. Dollar (DXY), U.S. 10-Year Yield, Equity Volatility (VIX), Bond Volatility (MOVE), and Credit Conditions — into a single composite value using standardized (z-score) normalization. The result is a continuous measure of risk pressure, where higher values indicate tightening / risk-off conditions and lower values indicate easing / risk-on conditions. The indicator is designed to be computed on a higher timeframe (recommended: 1-hour) and used as background context while executing trades on lower timeframes. It does not predict direction and does not “override” price; it provides regime awareness only.
Key Inputs
• Compute on timeframe: Sets the timeframe used to calculate the composite (default and recommended: 1H).
• Z-score lookback length: Number of bars used to define “normal” conditions for each component (default: 200 bars). Larger values produce slower, more regime-level behavior; smaller values are more reactive.
• Credit source: Choose between HYG/LQD (intraday credit proxy) or High-Yield OAS (daily, FRED). HYG/LQD is recommended for intraday trading; OAS is better suited for swing or macro analysis.
• Component weights: Allows relative emphasis on DXY, rates, volatility, or credit without changing the structure of the indicator.
• Risk-on / Risk-off thresholds: Define when the background shading changes state; defaults are ±0.75 standard deviations.
Interpretation
The indicator defines environmental state, not trade entries. Risk-off readings do not require price to fall, and risk-on readings do not require price to rise. The tool is best used to set expectations for trend quality, breakout reliability, and mean-reversion risk, not to time trades.

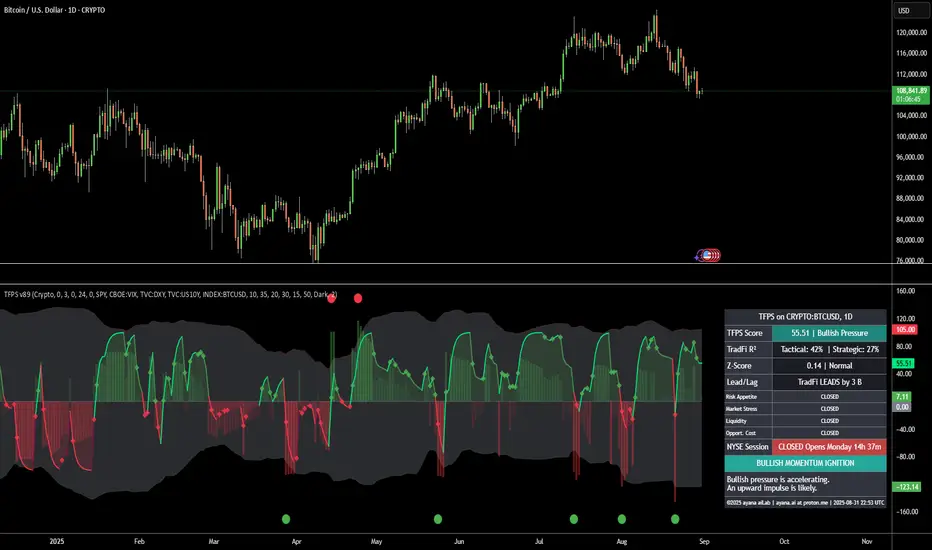
[ayana] TFPS - TradFi Pressure ScoreTFPS - TradFi Pressure Score: Your Market Pressure Barometer
Understand what moves Wall Street, before it moves Crypto.
This indicator is your real-time barometer for the influence of traditional financial markets (TradFi) on Crypto. It measures the combined pressure from four key quadrants—Risk Appetite (S&P 500), Market Stress (VIX), Liquidity (DXY), and Macro Expectations (US10Y)—to answer one question: "Do I have a tailwind or a headwind from the global markets?"
How to Read Your "Cockpit" in 60 Seconds
The Main Line (Overall Market Pressure)
GREEN / ABOVE 0: Bullish Tailwind. The macro environment is supportive for Crypto.
RED / BELOW 0: Bearish Headwind. The macro environment is creating pressure on Crypto.
BRIGHT Color: Pressure is ACCELERATING.
DARK Color: Pressure is DECELERATING (losing momentum).
The Dashboard (Your Command Center)
Lead/Lag Analysis: The game-changer. Tells you if TradFi is currently leading the price or vice-versa. This is your key to knowing whether to watch macro news or focus on crypto-specifics.
TradFi Influence (R²): Shows you HOW RELEVANT the macro pressure is right now. High R² means Wall Street's influence is dominant. Low R² means crypto is moving on its own narrative.
Dynamic Weights: Reveals the market's primary NARRATIVE. Is the pressure coming from Fear (VIX), Liquidity (DXY), or general Risk Appetite (SPX)?
Extreme Signals (Reversal Zones)
Stress Cloud (Z-Score): Large, opaque bars warn of statistically EXTREME greed or fear levels.
Extreme Dots: Pinpoint the moments when pressure has likely reached an unsustainable peak, often preceding turning points.
Key Strategies & Use Cases
As a Trend Filter: Simply avoid fighting the color. Don't force long trades when the TFPS shows a strong red headwind.
For Precision Entry/Exits: Use the Extreme Dots and a decelerating color on the Main Line to time your entries in confluence with your own strategy.
For Strategic Decisions: Use the Lead/Lag and R² metrics to decide where to focus your attention and how to manage portfolio risk based on the current macro regime.
Configuration
For best results, leave the engine settings on their default (auto-adaptive) mode. The indicator's core intelligence lies in its ability to adapt to changing market dynamics automatically. You can adjust the visual theme to match your chart.
Live Risk On/Off Sentiment Big Basket🔥 Live Risk On/Off Sentiment Indicator 🔥
This indicator provides a clear and immediate assessment of global market risk sentiment by combining multiple key financial instruments across various asset classes. It helps traders quickly gauge whether the market is currently in a risk-on or risk-off environment.
📈 Included Assets:
- Risk-off indicators:** VIX, Gold, US Dollar Index (DXY), US10Y Treasury Yields, TLT (Treasury Bonds)
- Risk-on indicators:** S&P 500 (SPY), Bitcoin (BTC), High Yield Bonds (HYG), AUD/JPY (Forex), Copper/Gold ratio, and Oil (WTI)
🛠️ How it Works:
The indicator calculates a weighted Z-score for each asset, dynamically capturing its performance relative to recent history. Positive values (green) indicate a risk-on sentiment, while negative values (red) suggest a risk-off sentiment.
🚨 Features:
- Fully customizable asset selection and weighting
- Easy-to-understand visual signals
- Adaptable lookback period for short-term and long-term market analysis
💡 How to Use:
- Identify market phases quickly (bullish or bearish sentiment).
- Enhance your decision-making for entries and exits based on broader market conditions.
- Incorporate into any trading strategy to improve alignment with global risk sentiment.
Harness the power of macro analysis and elevate your trading performance!
Enjoy and trade smart! 📊📈
Riseofatrader

RISK MANAGEMENTHi dear Traders,
Here I would present you my 'Risk Management' tool which is based on your buy orders, trading fees and your desired benefit.
Easily, fulfill the price and volume of each entries. Add to this, you can prepare the info about your next proposed entries, just let them not check at first and by meeting the prices then active the check-box beside it.
Two line will be presented on your candle-plot, one of the indicate the place that without any lose/win you can exit and also the desired exit position by considering user defined benefit.
Use it for free but please do not forget to boost the script.
Best regards and happy trading.
Shakib
