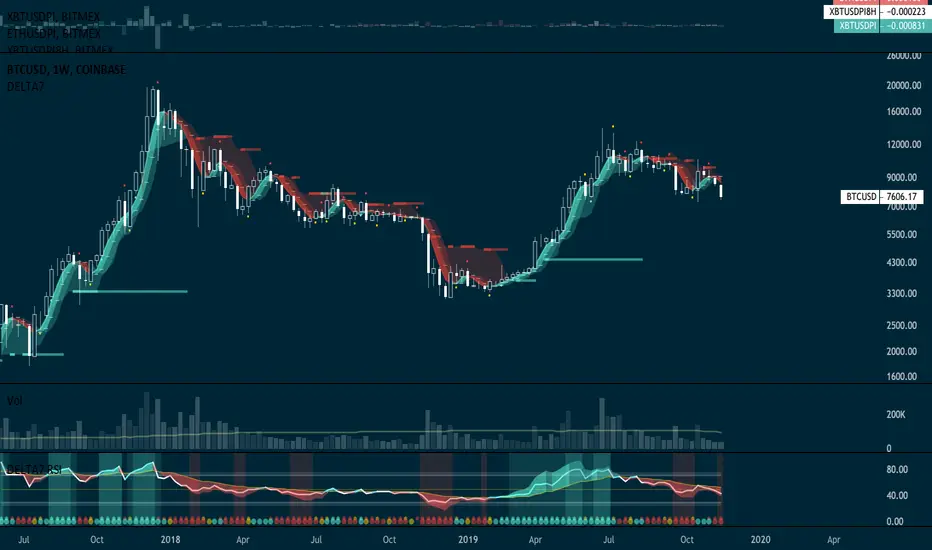
RSI 𝝙RSI 𝝙 is a full study system of several RSI analysis that can be used on different timeframes and adapt strategy to trending markets or trading ranges.
Identify better divergences/convergences, alerts for *potential* entry, flat and exit signals. Adapt personal strategy according to the market pace, behaviour and timeframe.
Default Settings:
RSI: 13
Linear Regression of RSI: 34
Signal RSI: 5
Long RSI: 55
RSI 𝝙 Histogram: Delta between RSI and Long RSI based on Signal RS 0.31% Length.
Activate Vertical Bar Highlights and/or Signal Flags for:
- RSI Oversold/Overbought. (Default: Highlight Bar)
- Signal RSI Oversold/Overbought. (Default: Highlight Bar)
- RSI crossing its Linear Regression . (Default: Signal Flag)
- RSI crossing its Long RSI . (Default: Off)
- Signal RSI crossing its RSI . (Default: Off)
- Signal RSI crossing its Long RSI . (Default: Off)
- RSI 𝝙 Histogram crossing baseline. (Default: Off)
Users can also do extra tunning in Style Section of Format options.
Typical use case for Daily timeframe:
RSI cross its Linear Regression produce a close signal of the on-going trend. RSI 𝝙 Histogram crossing could also provide early an signal or a confirmation. Then look RSI or RSI 𝝙 Histogram is forming a Divergence. If divergence is confirmed after candle close you can look into Signal RSI crossing RSI/Long RSI or RSI breaking the support/resistance horizontal/trendlines OR if you are more conservative wait until RSI cross Long RSI . The different markets will show slightly diff behaviours but with this indicator, we can capture its essence independently of timeframe.
RSI being above/bellow Long RSI establishes the relatively long-term bias in trending markets. This is also valid for Weekly and Monthly timeframes.
This is just a guideline suggestion. The reality is users of this indicator need to observe the market's behaviour and identify which signals will provide more reliable entries, exits and/or remain until next signals before the next round of trades.
The market behaves differently when pacing changes, volatility changes, when it trends or when it ranges. Develop an understanding of it with the help of this study.
Avoid risking more than 1% per trade. Be responsible for always making a priority about protecting capital and risk management. Develop emotional control and use this RSI study to develop a more complete trading system without any need for extra indicators other than Price and Volume .
👆active signals:
RSI crossing Linear Regression
RSI crossing Long RSI
👆active signals:
Signal RSI Long RSI
👆active signals:
RSI crossing Linear Regression
Also note that RSI 𝝙 Histogram divergences/convergences flag very often significant momentum changes. This important information is extremely useful when also looking to volume anomalies and help deciding to close a position (or enter next) before flash crash occur where a signal might come slightly late on higher timeframes.
RSI-7
TTM Apollo 11 RSIColor coded RSI to give a better indication of when to buy or sell based on the RSI level along with an included EMA signal to help describe the trend.
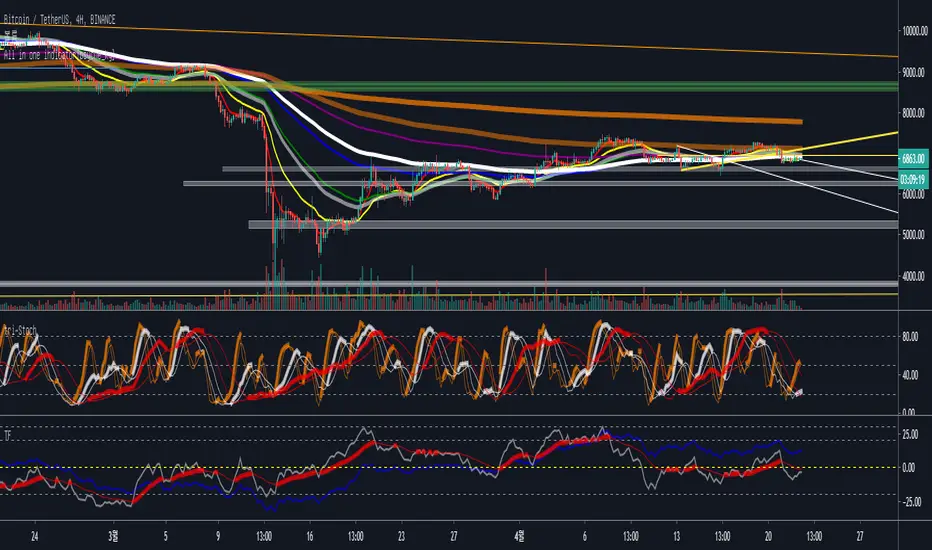
Stoch_Williams_RSI[wozdux]2Strategy. The indicator gives buy and sell signals based on two or three indicators.
Alert 2 is the signal from the two indicators is the Stochastic + Williams. Alert 3 signal from three Stochastic + Williams+ RSI indicators is simple. The Alert4 signal from the three Stochastic + Williams+MTF indicators is simple. Alert5 signal from three Stochastic + Williams+ RSI-2 indicators smoothed.
Settings.
""alert 2 show" - show signal button
""alert 3 show" - show signal button
""alert 4 show" - show signal button
""alert 5 show" - show signal button
To use, you need to connect the "alert" by one of the "alert-2-3-4-5".
Стратегия. Индикатор дает сигналы на покупку и продажу на основе двух или трех индикаторов.
Alert2 это сигнал от двух индикаторов Stochastic + Williams. Alert3 сигнал от трех индикаторов Stochastic + Williams+ RSI простой. Alert4 сигнал от трех индикаторов Stochastic + Williams+MTF простой. Alert5 сигнал от трех индикаторов Stochastic + Williams+ RSI-2 сглаженный.
Настройки.
"alert2 show"- кнопка показать сигнал
"alert3 show"- кнопка показать сигнал
"alert4 show"- кнопка показать сигнал
"alert5 show"- кнопка показать сигнал
Чтобы воспользоваться, нужно подключить "оповещение" по одному из «alert-2-3-4-5».

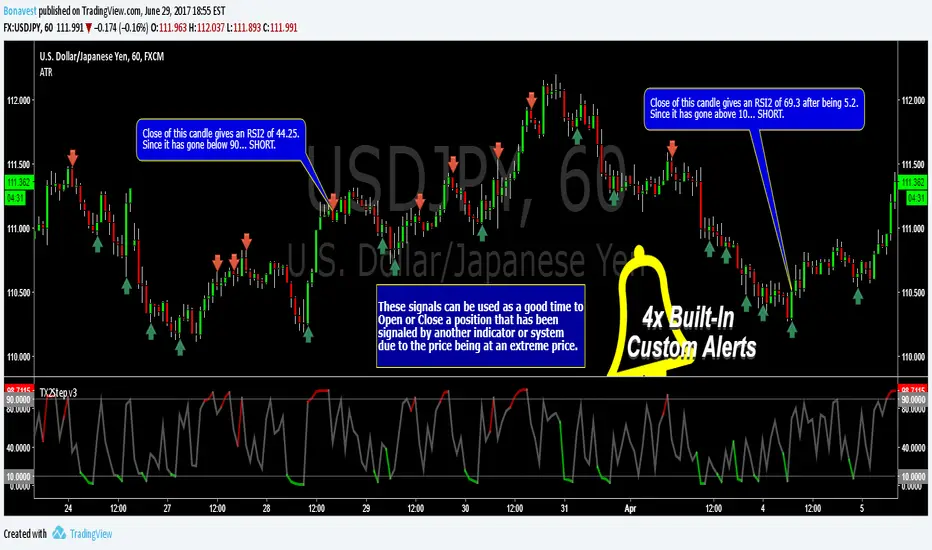
TEXAS 2 Step RSI-2 - Alerts Built-inBe sure to Add to Favorites (down below) and/or Like/Follow this script so that you will be alerted to UPDATES.
Adding to Favorites makes it available in your list of Indicators.
The Texas 2 Step is a lower indicator (arrows on candles added for reference) based on the RSI-2 Strategy made famous by Larry Connors.
I use this indicator for:
Timing Entries and Exits
Trading Between Up/Ddown Signals
Detecting Trends and Pull Backs
I use this indicator by looking for the RSI-2 number going back inside the 10-90 range(gray) after being outside (red/green). This tells me the price is no longer at an extreme. You never know how many candles will remain in the extreme areas so wait for a candle to close inside the range.
On longer time frames (daily/weekly) you will notice several candles will stay in the extreme areas resulting in 100 pips or more before returning to the inside range. In these cases you can go LONG/SHORT in the direction of the extreme area and close your position once it returns to the inside range.
There are 4 Built-In Notifications already created for you and are available by simply right clicking in the indicator area and selecting:
Condition: TX2Step v3 - RSI
Then 1 of the 4 Alerts:
Green Alert - RSI2 > 90 and line turns Green
Red Alert - RSI2 < 10 and line turns Red
Down - RSI2 < 90 after being in the top RSI2 > 90 area
Up - RSI2 > 10 after being in the bottom RSI2 < 10 area
I look forward to hearing your thoughts on the indicator and will definitely like to build upon this indicator and continue to update it.
This adaptation was based off of the original code from the talented Chris Moody.
Plenty of additional information about Larry Connors RSI-2 Strategy with PDFs and Backtests in the stock markets on the original Script.
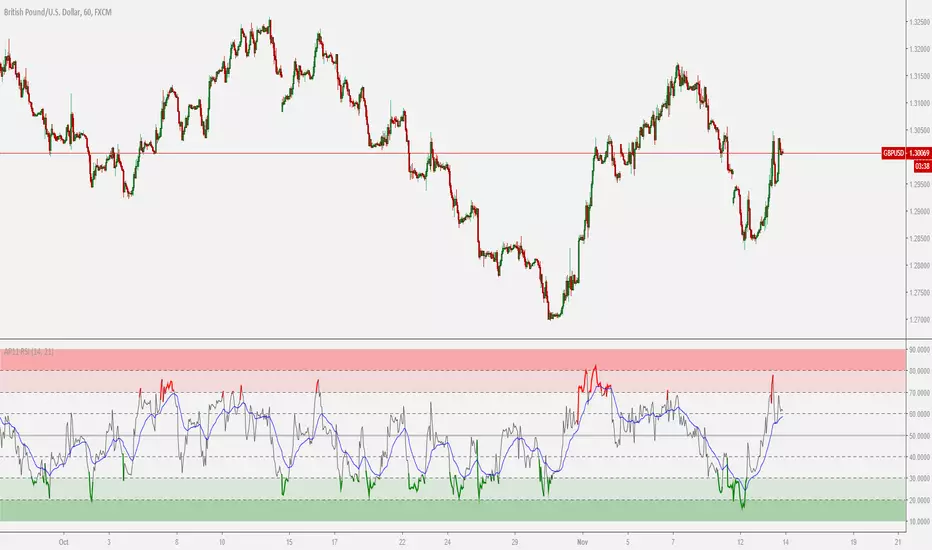
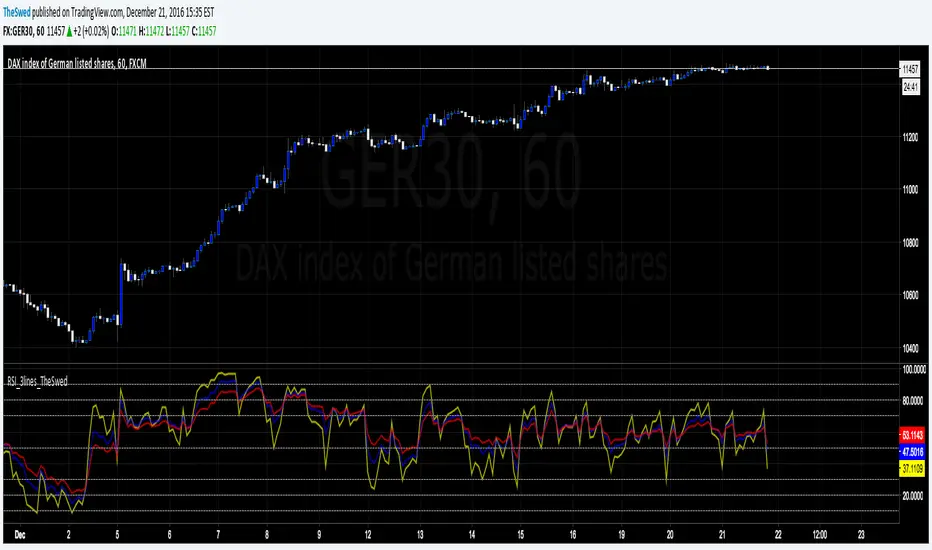
RSI_3lines_TheSwedRSI script with 3 lines. Also added lines: 90, 80, 20 and 10 to the script as I use this for trading.
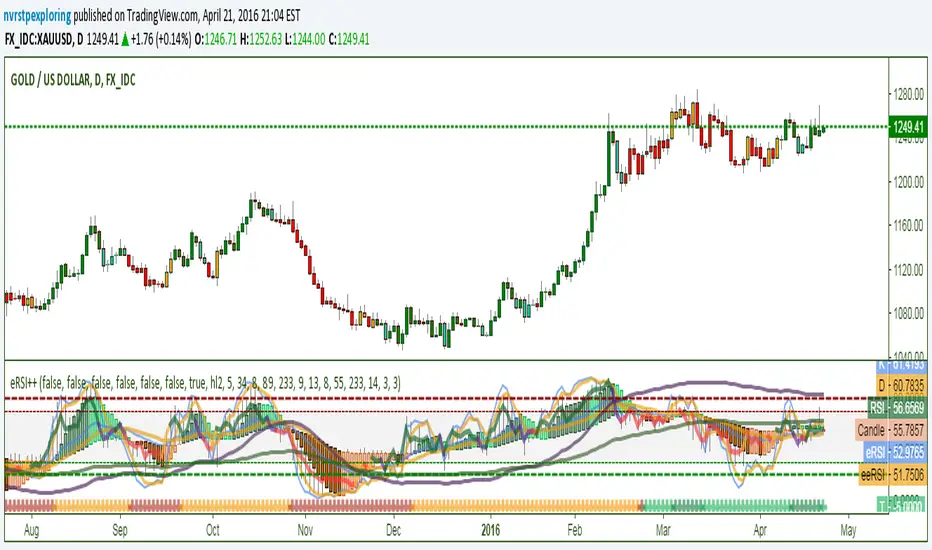
eRSI++Contains RSI; EMA of RSI; EMA of EMA of RSI; Stochastic Oscillator; 2 Inverse Fisher Transforms on RSI - IFRSI89 and IFRSI233 XOVER on higher timeframes from oversold/overbought is useful signal; RSI Trend/Divergence Candles with color variation based on multiple RSI length detection of trend decay; Chart candle overlay coloring based on RSI, eRSI, and eeRSI EMA55 & EMA233 Xover indicator on bottom for trend direction with color variations for counter trend movements.
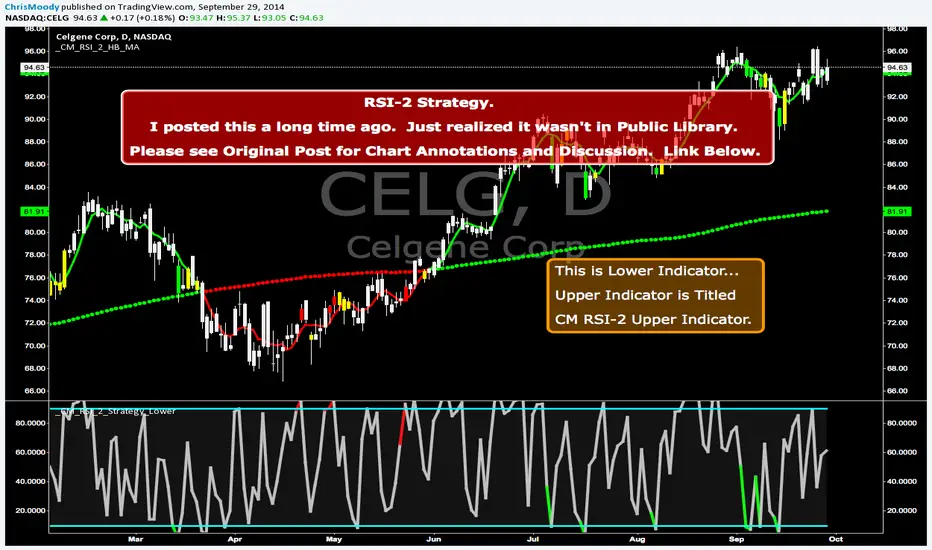
CM RSI-2 Strategy Lower IndicatorRSI-2 Strategy
***At the bottom of the page is a link where you can download the PDF of the Backtesting Results.
This year I am focusing on learning from two of the best mentors in the Industry with outstanding track records for Creating Systems, and learning the what methods actually work as far as back testing.
I came across the RSI-2 system that Larry Connors developed. Larry has become famous for his technical indicators, but his RSI-2 system is what actually put him “On The Map” per se. At first glance I didn’t think it would work well, but I decided to code it and ran backtests on the S&P 100 In Down Trending Markets, Up Trending Markets, and both combined. I was shocked by the results. So I thought I would provide them for you. I also ran a test on the Major forex Pairs (12) for the last 5 years, and All Forex Pairs (80) from 11/28/2007 - 6/09/2014, impressive results also.
The RSI-2 Strategy is designed to use on Daily Bars, however it is a short term trading strategy. The average length of time in a trade is just over 2 days. But the results CRUSH the general market averages.
Detailed Description of Indicators, Rules Below:
Link For PDF of Detailed Trade Results
d.pr
Original Post
CM RSI-2 Strategy - Upper Indicators.RSI-2 Strategy
***At the bottom of the page is a link where you can download the PDF of the Backtesting Results.
This year I am focusing on learning from two of the best mentors in the Industry with outstanding track records for Creating Systems, and learning the what methods actually work as far as back testing.
I came across the RSI-2 system that Larry Connors developed. Larry has become famous for his technical indicators, but his RSI-2 system is what actually put him “On The Map” per se. At first glance I didn’t think it would work well, but I decided to code it and ran backtests on the S&P 100 In Down Trending Markets, Up Trending Markets, and both combined. I was shocked by the results. So I thought I would provide them for you. I also ran a test on the Major forex Pairs (12) for the last 5 years, and All Forex Pairs (80) from 11/28/2007 - 6/09/2014, impressive results also.
The RSI-2 Strategy is designed to use on Daily Bars, however it is a short term trading strategy. The average length of time in a trade is just over 2 days. But the results CRUSH the general market averages.
Detailed Description of Indicators, Rules Below:
Link For PDF of Detailed Trade Results
d.pr
Original Post
