Session break 225The default session break line for the NIKKEI 225 INDEX FUTURES (NK225) is drawn at 16:30 (GMT+9), the start of the night session.
This indicator draws a vertical line at 8:45 a.m (GMT+9), the start of the day session.
It is also possible to change the time at which the vertical line is drawn.
Поиск скриптов по запросу "日经225指数介绍"
JP225 Influence AnalyzerThis tool provides a way to assess how USDJPY and DJIA influence JP225, using standardization and linear regression for quantitative evaluation. It also detects deviations from the linear model and displays the results in a colored table.
Table Structure
Row 1: Current value of USDJPY and its change from the previous bar
Row 2: Current value of DJIA and its change from the previous bar
Row 3: Theoretical value of Nikkei 225 calculated using the least squares method from USDJPY
and DJIA, and its change from the previous bar
Row 4: Current value of the chart symbol (Nikkei 225) and its change from the previous bar
Background Color Meanings
A. Current Value Column (Column 2)
If USDJPY or DJIA significantly contributes to the change in the theoretical value of Nikkei 225, the cell turns blue (increase) or red (decrease). The threshold is 1.5.
If the current value of Nikkei 225 increases, it turns blue; if it decreases, it turns red.
B. Change Value Column (Column 3)
If there is a discrepancy between the change in the theoretical value and the actual change of Nikkei 225, the cell turns yellow (moderate discrepancy: threshold 20) or red (significant discrepancy: threshold 50).
Judgment Based on Current Value Column (Column 2)
If the color of USDJPY or DJIA matches the color of Nikkei 225, that symbol is the main cause.
If there is no match, the main cause is "other factors."
Judgment Based on Change Column (Column 3)
Yellow: Suggests that other factors may be influencing the price.
Red: Strongly indicates that other factors are the main cause.
Parameter Descriptions Parameter Descriptions
symbol_x: Symbol for USDJPY (default: "SAXO:USDJPY")
symbol_y: Symbol for DJIA (default: "OSE:DJIA1!")
threshold_value1: Threshold for determining the influence of USDJPY and DJIA (blue/red color) (default: 1.5)
threshold_value2: Threshold for detecting specific price movements in Nikkei 225 (yellow color) (default: 20)
threshold_value3: Threshold for detecting significant price movements in Nikkei 225 (red color) (default: 50)
data_count: Number of past data points used for calculations (default: 10)
インジケーターの概要
このインジケーターは、日経225先物やCFDの値動きの主な原因が
以下のどれに起因するのかをリアルタイムで表示します
1. ドル円 (USDJPY)
2. ダウ (DJIA)
3. その他の要因(突発的なニュース、225の節目価格への攻防など)
テーブルの構成
1行目 ドル円の現在値と前足からの増減
2行目 ダウの現在値と前足からの増減
3行目 ドル円とダウから最小二乗法で算出した225の理論値とその増減
4行目 チャート銘柄(225)の現在値と前足からの増減
背景色の意味
1. 現在値列 (2列目):ドル円またはダウが225の理論値増減に大きく寄与した場合、
それぞれ青(増加)または赤(減少)に変化。閾値は1.5
225の現在値が増加すれば青、減少すれば赤。
2. 増減値列 (3列目):225の理論値増減と実際の増減が乖離した場合、
黄(中程度:閾値は20)または赤(大幅:閾値は50)に変化。
現在値列(2列目)での判断:
1. 銘柄(ドル円またはダウ)の色が225の色と一致する場合、その銘柄が主な原因。
2. 一致しない場合、主な原因は「その他」。
増減列(3列目)での判断:
黄色 その他の要因が影響している可能性。
赤色 その他の要因が主な原因と強く示唆。
パラメータの説明
symbol_x ドル円のシンボル(デフォルト: "SAXO:USDJPY")
symbol_y ダウのシンボル(デフォルト: "OSE:DJIA1!")
threshold_value1 ドル円とダウの影響を判定する(青/赤色)閾値(デフォルト: 1.5)
threshold_value2 225固有の値動きを判定する(黄色)閾値(デフォルト: 20)
threshold_value3 225固有の大きな値動きを判定する(赤色)閾値(デフォルト: 50)
data_count 計算に使用する過去データの本数(デフォルト: 10)

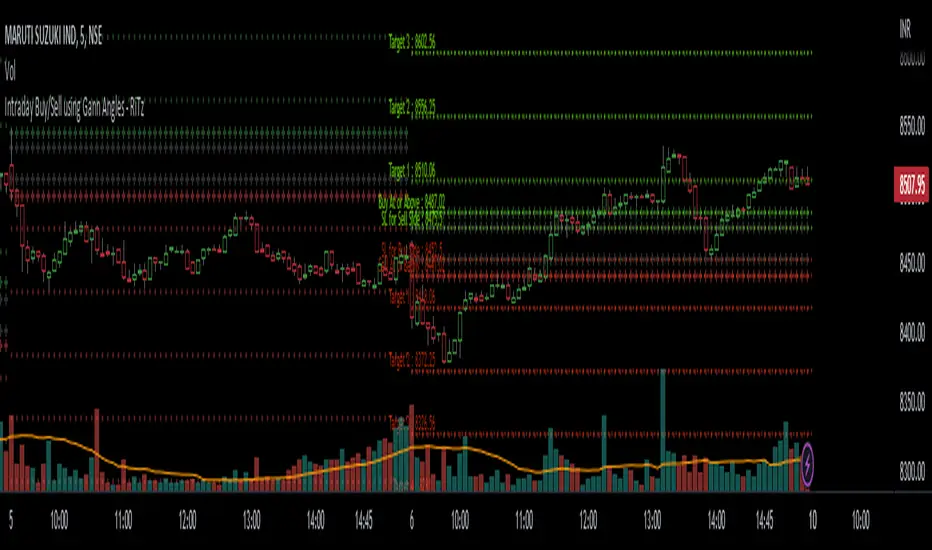
Intraday Buy/Sell using Gann Angles - RiTzIntraday Buy/Sell Levels using Gann Angles based on Todays Open/previous Day High/Low/Close prices
How to use this :
The Buy/Sell levels will be calculated on 1 of 4 things (you can choose any one which you prefer)
1. Todays Open price
2. Previous Day High
3. Previous Day Low
4. Previous Day Close
The Buy/Sell levels will be displayed in these ways
1. In a Table
2. on the Chart
You can turn them on/off according to your preference!
I can't seem to find the original documentation or a link to it.
i have it's excel file, in which we have to enter following data :
1. Todays Open price
2. Previous Day High
3. Previous Day Low
4. Previous Day Close
and the buy/sell levels are calculated by using the above data in following manner :
Based On Today's Opening Price
(lets call it TDO)
Degree's````````````````` Degree Factor```````````````````````` Buy````````````````````````` Sell
11.25```````````````````` =degree/180=11.25/180=0.0625````````` =(sqrt(TDO)-0.0625)^2``````` =(sqrt(TDO)+0.0625)^2````` SL
22.5````````````````````` =degree/180=22.5/180=0.125``````````` =(sqrt(TDO)+0.125)^2```````` =(sqrt(TDO)-0.125)^2`````` Buy/Sell At
45``````````````````````` =degree/180=45/180=0.25`````````````` =(sqrt(TDO)+0.25)^2````````` =(sqrt(TDO)-0.25)^2``````` Target-1
90``````````````````````` =degree/180=90/180=0.5``````````````` =(sqrt(TDO)+0.5)^2`````````` =(sqrt(TDO)-0.5)^2```````` Target-2
135`````````````````````` =degree/180=135/180=0.75````````````` =(sqrt(TDO)+0.75)^2````````` =(sqrt(TDO)-0.75)^2``````` Target-3
180`````````````````````` =degree/180=180/180=1```````````````` =(sqrt(TDO)+1)^2```````````` =(sqrt(TDO)-1)^2`````````` Target-4
225`````````````````````` =degree/180=225/180=1.25````````````` =(sqrt(TDO)+1.25)^2````````` =(sqrt(TDO)-1.25)^2``````` Target-5
270`````````````````````` =degree/180=270/180=1.5`````````````` =(sqrt(TDO)+1.5)^2`````````` =(sqrt(TDO)-1.5)^2```````` Target-6
315`````````````````````` =degree/180=315/180=1.75````````````` =(sqrt(TDO)+1.75)^2````````` =(sqrt(TDO)-1.75)^2``````` Target-7
360`````````````````````` =degree/180=360/180=2```````````````` =(sqrt(TDO)+2)^2```````````` =(sqrt(TDO)-2)^2`````````` Target-8
sqrt = square root
TDO = Today's Opening Price
PDH = Previous Days High
PDL = Previous Days Low
PDC = Previous Days Close
Based On Previous Days High Price
(lets call it PDH)
Degree's````````````````` Degree Factor```````````````````````` Buy````````````````````````` Sell
11.25```````````````````` =degree/180=11.25/180=0.0625````````` =(sqrt(PDH)-0.0625)^2``````` =(sqrt(PDH)+0.0625)^2````` SL
22.5````````````````````` =degree/180=22.5/180=0.125``````````` =(sqrt(PDH)+0.125)^2```````` =(sqrt(PDH)-0.125)^2`````` Buy/Sell At
45``````````````````````` =degree/180=45/180=0.25`````````````` =(sqrt(PDH)+0.25)^2````````` =(sqrt(PDH)-0.25)^2``````` Target-1
90``````````````````````` =degree/180=90/180=0.5``````````````` =(sqrt(PDH)+0.5)^2`````````` =(sqrt(PDH)-0.5)^2```````` Target-2
135`````````````````````` =degree/180=135/180=0.75````````````` =(sqrt(PDH)+0.75)^2````````` =(sqrt(PDH)-0.75)^2``````` Target-3
180`````````````````````` =degree/180=180/180=1```````````````` =(sqrt(PDH)+1)^2```````````` =(sqrt(PDH)-1)^2`````````` Target-4
225`````````````````````` =degree/180=225/180=1.25````````````` =(sqrt(PDH)+1.25)^2````````` =(sqrt(PDH)-1.25)^2``````` Target-5
270`````````````````````` =degree/180=270/180=1.5`````````````` =(sqrt(PDH)+1.5)^2`````````` =(sqrt(PDH)-1.5)^2```````` Target-6
315`````````````````````` =degree/180=315/180=1.75````````````` =(sqrt(PDH)+1.75)^2````````` =(sqrt(PDH)-1.75)^2``````` Target-7
360`````````````````````` =degree/180=360/180=2```````````````` =(sqrt(PDH)+2)^2```````````` =(sqrt(PDH)-2)^2`````````` Target-8
Based On Previous Days Low Price
(lets call it PDL)
Degree's````````````````` Degree Factor```````````````````````` Buy````````````````````````` Sell
11.25```````````````````` =degree/180=11.25/180=0.0625````````` =(sqrt(PDL)-0.0625)^2``````` =(sqrt(PDL)+0.0625)^2````` SL
22.5````````````````````` =degree/180=22.5/180=0.125``````````` =(sqrt(PDL)+0.125)^2```````` =(sqrt(PDL)-0.125)^2`````` Buy/Sell At
45``````````````````````` =degree/180=45/180=0.25`````````````` =(sqrt(PDL)+0.25)^2````````` =(sqrt(PDL)-0.25)^2``````` Target-1
90``````````````````````` =degree/180=90/180=0.5``````````````` =(sqrt(PDL)+0.5)^2`````````` =(sqrt(PDL)-0.5)^2```````` Target-2
135`````````````````````` =degree/180=135/180=0.75````````````` =(sqrt(PDL)+0.75)^2````````` =(sqrt(PDL)-0.75)^2``````` Target-3
180`````````````````````` =degree/180=180/180=1```````````````` =(sqrt(PDL)+1)^2```````````` =(sqrt(PDL)-1)^2`````````` Target-4
225`````````````````````` =degree/180=225/180=1.25````````````` =(sqrt(PDL)+1.25)^2````````` =(sqrt(PDL)-1.25)^2``````` Target-5
270`````````````````````` =degree/180=270/180=1.5`````````````` =(sqrt(PDL)+1.5)^2`````````` =(sqrt(PDL)-1.5)^2```````` Target-6
315`````````````````````` =degree/180=315/180=1.75````````````` =(sqrt(PDL)+1.75)^2````````` =(sqrt(PDL)-1.75)^2``````` Target-7
360`````````````````````` =degree/180=360/180=2```````````````` =(sqrt(PDL)+2)^2```````````` =(sqrt(PDL)-2)^2`````````` Target-8
Based On Previous Days Close Price
(lets call it PDC)
Degree's````````````````` Degree Factor```````````````````````` Buy````````````````````````` Sell
11.25```````````````````` =degree/180=11.25/180=0.0625````````` =(sqrt(PDC)-0.0625)^2``````` =(sqrt(PDC)+0.0625)^2````` SL
22.5````````````````````` =degree/180=22.5/180=0.125``````````` =(sqrt(PDC)+0.125)^2```````` =(sqrt(PDC)-0.125)^2`````` Buy/Sell At
45``````````````````````` =degree/180=45/180=0.25`````````````` =(sqrt(PDC)+0.25)^2````````` =(sqrt(PDC)-0.25)^2``````` Target-1
90``````````````````````` =degree/180=90/180=0.5``````````````` =(sqrt(PDC)+0.5)^2`````````` =(sqrt(PDC)-0.5)^2```````` Target-2
135`````````````````````` =degree/180=135/180=0.75````````````` =(sqrt(PDC)+0.75)^2````````` =(sqrt(PDC)-0.75)^2``````` Target-3
180`````````````````````` =degree/180=180/180=1```````````````` =(sqrt(PDC)+1)^2```````````` =(sqrt(PDC)-1)^2`````````` Target-4
225`````````````````````` =degree/180=225/180=1.25````````````` =(sqrt(PDC)+1.25)^2````````` =(sqrt(PDC)-1.25)^2``````` Target-5
270`````````````````````` =degree/180=270/180=1.5`````````````` =(sqrt(PDC)+1.5)^2`````````` =(sqrt(PDC)-1.5)^2```````` Target-6
315`````````````````````` =degree/180=315/180=1.75````````````` =(sqrt(PDC)+1.75)^2````````` =(sqrt(PDC)-1.75)^2``````` Target-7
360`````````````````````` =degree/180=360/180=2```````````````` =(sqrt(PDC)+2)^2```````````` =(sqrt(PDC)-2)^2`````````` Target-8
example based On Today's Opening Price = 4339
Degree's```````` Degree Factor```````` Buy`````````` Sell
11.25``````````` 0.0625``````````````` 4330.77`````` 4347.24```````` SL
22.5```````````` 0.125```````````````` 4355.48`````` 4322.55```````` Buy/Sell At
45`````````````` 0.25````````````````` 4372.00`````` 4306.13```````` Target-1
90`````````````` 0.5`````````````````` 4405.12`````` 4273.38```````` Target-2
135````````````` 0.75````````````````` 4438.37`````` 4240.76```````` Target-3
180````````````` 1```````````````````` 4471.74`````` 4208.26```````` Target-4
225````````````` 1.25````````````````` 4505.24`````` 4175.88```````` Target-5
270````````````` 1.5`````````````````` 4538.86`````` 4143.64```````` Target-6
315````````````` 1.75````````````````` 4572.61`````` 4111.51```````` Target-7
360````````````` 2```````````````````` 4606.48`````` 4079.52```````` Target-8
Note : ignore the '`' , inserted them to fill up the spaces , it was looking very weird!, tried to fix it as much as I can.
Note :- Please correct me if I'm wrong , as I've already mentioned I don't have it's original documentation.
if anyone can find it or already has it then please feel free to share it.
Japan Stock Market Indices Performance TableYou can display the performance of the Nikkei 225 Futures and major indices of the Japanese stock market for the day in a table format on your chart.
The 5-Minute Change Rate shows the change from the opening price of the most recent 5-minute candlestick.
The Daily Change Rate displays the change from the opening price at 09:00 GMT+9 on the current trading day.
Since the Japanese stock market opens at 09:00 GMT+9 , the values for Nikkei 225 Futures, USD/JPY, and EUR/JPY are also calculated based on their opening prices at that time. This script was created because, while brokerage apps allow you to see the comparison to the previous day's close for each index, they do not display the rate of change from the current day's opening price.
Notes:
All values are reset each trading day at 09:00 GMT+9.
If you have not purchased real-time market data from the Tokyo Stock Exchange and Osaka Exchange, data may be delayed by 20 minutes and may not display correctly.
The Tokyo Stock Exchange sector indices are distributed in real-time at 15-second intervals from the TSE, so this script aligns with that timing.
当日の日経225先物と日本株式市場の主要指数のパフォーマンスを表形式でチャート上に表示することができます。
5分変化率は直近の5分足の始値からの変化率、当日変化率は当日09:00の始値からの変化率を表示しています。
日本株式市場が開くのが GMT+9 09:00 のため、それに合わせて日経225先物、ドル円、ユーロ円も GMT+9 09:00 時点の始値を元に各値を算出しています。
各指数の前日比は証券会社のアプリで見れるものの、当日始値からの変化率が見れないため作成しました。
補足
各営業日の朝(GMT+9 09:00)に各値はリセットされます。
Tokyo Stock ExchangeとOsaka Exchangeのreal-time market dataを購入していない場合、データが20分遅れになるため正常に表示されない可能性があります。
東証業種別株価指数は東証から配信されるのが15秒間隔でのリアルタイムになるため、このスクリプトもそれに準ずる形となっています。

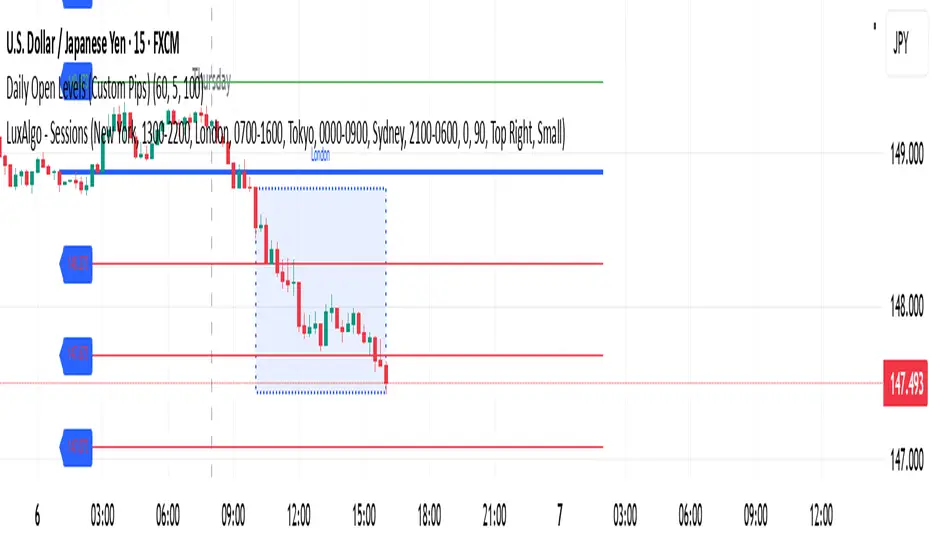
Daily Open Levels (Custom Pips)Daily Open Levels Indicator
Overview: The Daily Open Levels indicator is a simple but powerful tool designed for intraday traders who focus on the daily open price and pip-based levels for decision-making. This indicator helps you visualize key price levels based on the daily opening price, with configurable upper and lower levels calculated in pips. It is especially useful for tracking price movements relative to the previous day’s open and can help traders identify breakout zones, potential support/resistance, and key entry/exit points.
eatures:
Daily Open Price: The indicator automatically calculates and plots the daily open of the current trading day.
Upper and Lower Levels: Configurable upper and lower levels based on a user-defined pip interval. These levels can act as potential resistance or support zones.
Adjustable Pip Interval: You can customize the pip distance for the upper and lower levels to suit different trading styles and volatility.
Works for All Pairs: Option to automatically detect JPY pairs with a different pip value (0.1), or you can manually select your pair setting.
Color Customization: You can choose different colors for the daily open line, upper levels, and lower levels for easy visualization.
Immediate Visual Feedback: The indicator immediately draws the lines on the chart when added, without waiting for any market data.
How It Works:
The daily open price is retrieved from the current trading day, and horizontal lines are drawn at this price level, as well as at pip-based distances above and below it.
The pip distance is calculated using the Pip Interval setting and can be adjusted for any pair. For example, a 225-pip interval would create lines at 225 pips above and below the daily open.
The indicator dynamically updates every minute to reflect new daily opens and adjustments for each trading day.
Lines are drawn using the HLine (horizontal line) objects in MetaTrader 5, making them easy to spot and follow.
Parameters:
Pip Interval: Defines the pip distance for upper and lower levels (e.g., 225 pips). This affects how far above and below the daily open the levels are drawn.
Number of Levels: Sets how many upper and lower levels are drawn.
JPY Pairs: An option to adjust the pip value for JPY pairs (0.1 pip for JPY pairs vs. 0.01 pip for others).
Line Colors: Customize the colors for the daily open, upper levels, and lower levels.
Style & Width: Adjust the style (solid/dashed) and width of the lines to match your preferences.
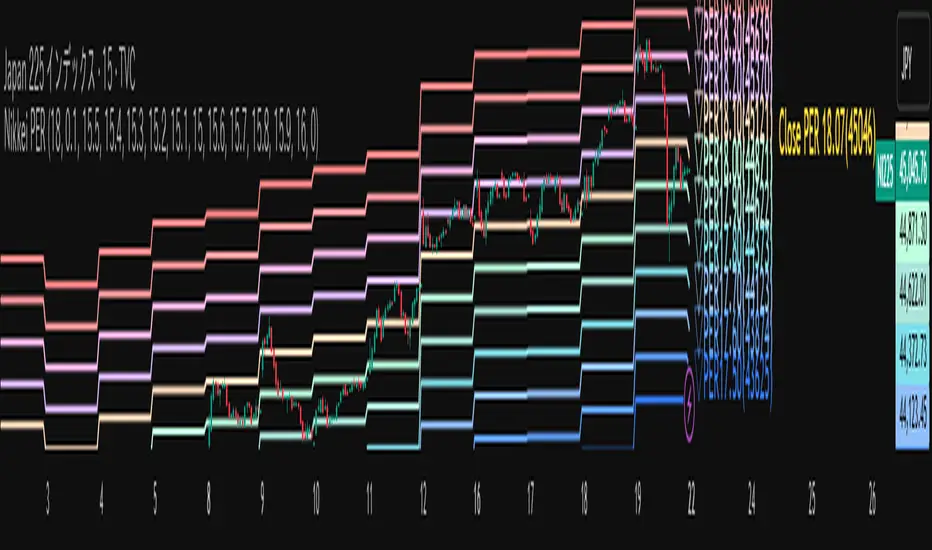
Nikkei PER Curve (EPS Text Area Input)
This indicator visualizes the PER levels of the Nikkei 225 based on the dates and EPS data entered in the text area.
By plotting multiple PER multiplier lines, it helps users to understand the following:
Potential support and resistance levels based on PER multipliers
Comparison between the current stock price and theoretical valuation levels
Observation of PER trends and detection of deviations from standard valuation levels
Trading Decisions:
When the stock price approaches a specific PER line, it can serve as a reference for support or resistance.
During intraday chart analysis, PER lines are drawn based on the most recent EPS, making them useful as reference levels even during market hours.
Valuation Analysis:
On daily charts, it helps to assess whether the Nikkei is overvalued or undervalued compared to historical levels, or to identify changes in valuation levels.
Risk Management:
The theoretical price lines based on PER can be used as reference points for stop-loss or profit-taking decisions.
Simple Data Input:
EPS data is entered in a text area, one line per date, in comma-separated format:
YYYY/MM/DD,EPS
YYYY/MM/DD,EPS
Multiple entries can be input by using line breaks between each date.
Note: Dates for which no candlestick exists in the chart will not be displayed.
This allows easy updating of PER lines without complex spreadsheets or external tools.
EPS Data Input: Manual input of date and EPS via the text area; supports multiple data entries.
PER Multiplier Lines:
For evenly spaced lines, simply set the central multiplier and the interval between lines. The indicator automatically generates 11 lines (center ±5 lines).
For non-even spacing or individual multiplier settings, you can choose to adjust each line.
Close PER Labels: Displays the PER of the close price relative to the current EPS.
Timeframe Limitation: Use on daily charts (1D) or lower. PER lines cannot be displayed on higher timeframes.
Label Customization: Allows adjustment of text size, color, and position.
EPS Parsing: The indicator reads the input text area line by line, splitting each line by a comma to obtain the date and EPS value.
Data Storage: The dates and EPS values are stored in arrays. These arrays allow the script to efficiently look up the latest EPS for any given date.
PER Calculation: For each chart bar, the indicator calculates the theoretical price for multiple PER multipliers using the formula:
Theoretical Price = EPS × PER multiplier
Line Plotting: PER lines are drawn at these calculated price levels. Labels are optionally displayed for the close price PER.
Date Matching: If a date from the EPS data does not exist as a candlestick on the chart, the corresponding PER line is not plotted.
PER lines are theoretical values: They serve as psychological reference points and do not always act as true support or resistance.
Market Conditions: Lines may be broken depending on market circumstances.
Accuracy of EPS Data: Be careful with EPS input errors, as incorrect data will result in incorrect PER curves.
Input Format: Dates and EPS must be correctly comma-separated and entered one per line. Dates with no corresponding candlestick on the chart will not be plotted. Incorrect formatting may prevent lines from displaying.
Reliability: No method guarantees success in trading; use in combination with backtesting and other technical analysis tools.
このインジケータは、入力した日付とEPSデータを基に日経225のPER水準を視覚化するものです
複数のPER倍率ラインを描画することで、以下を把握するのに役立ちます:
PER倍率に基づく潜在的なサポート・レジスタンス水準や目安
現在の株価と理論上の評価水準との比較
過去から現在までのPER推移の観察
トレード判断:
株価が特定の倍率のPERラインに近づいたとき、抵抗や支持の目安としての活用
日中足表示時は、前日(最新日)のEPSに基づいたPERラインを表示するように作成しているので、場中でも参考目安として使用可能
評価分析:
過去の推移と比較して日経が割高か割安か、またはPER評価水準が変化したかの確認
リスク管理:
PERに基づく理論価格ラインを、損切りや利確の目安としての利用
簡単なデータ入力:
EPSデータはテキストエリアに手動入力。1行につき1日付・EPSをカンマ区切りで記入します
例
2025/09/19,2492.85
2025/09/18,2497.43
行を改行することで複数データ入力が可能
注意: チャート上にローソク足が存在しない日付のデータは表示されません
表計算や外部ツールを使わずに倍率を掛けたPERラインの作成・更新が簡単に行える
PER倍率ライン:
等間隔ラインの場合、中心倍率と各ラインの間隔を設定するだけで、自動的に中心値±5本、計11本のラインを作成
等間隔以外や個別設定したい場合は で調整可能
終値PERラベル: 現在のEPSに対する終値PERを表示
時間足制限: 日足(1日足)以下で使用すること。高い時間足ではPERラインは表示できません
ラベルカスタマイズ: 文字サイズ、色、位置を調整可能
EPSデータの読み取り: 改行を検知し1日分のデータとして識別し、カンマで分割して日付とEPS値を取得
配列への格納: 日付とEPSを配列に格納し、各バーに対して最新のEPSを参照できるようにする
PER計算: 各バーに対して、以下の式で複数のPER倍率の理論価格を計算:
理論価格 = EPS × PER倍率
日付照合: EPSデータの日付がチャート上にローソク足として存在したら格納した配列からデータを取得。ローソク足が存在しない場合、そのPERラインは表示されない
ライン描画: 計算した価格にPERラインを描画。必要に応じて終値PERラベルも表示。
PERラインは理論値であり心理的目安として機能することがありますが、必ずしも機能する訳ではない
その為、過去の検証や他のテクニカル指標と併用推奨
市況によってはラインを無視するように突破する可能性ことがある
EPSデータの入力ミスに注意すること。誤入力するとPER曲線が誤表示される
日付とEPSの入力は1行ずつ、正しい位置でカンマ区切りをいれること
ローソク足が存在しない日付のデータは正しく表示されないことがあるので注意
誤った入力形式ではラインが表示されない場合がある
Deviation Rate Crash SignalDescription
This indicator provides entry signals for contrarian trades that aim to capture rebounds after sharp declines, such as during market crashes.
A signal is triggered when the deviation rate from the 25-day moving average falls below -25% (default setting). On the chart, a red circle is displayed below the candlestick to indicate the signal.
Backtest (2000–2024, Nikkei 225 stocks):
Win rate: 64.73%
Payoff ratio: 1.141
Probability of ruin: 0.0% (with proper risk control)
Trading Rules (Long only):
Entry: Market buy at next day’s open when the closing price is 25% or more below the 25-day MA.
Exit: Market sell at next day’s open when:
The closing price is 10% above the entry price (take profit), or
The closing price is 10% below the entry price (stop loss), or
40 days have passed since entry.
Notes:
This indicator is tuned for crisis periods (e.g., 2008 Lehman Shock, 2011 Great East Japan Earthquake, 2020 COVID-19 crash, 2024 Yen carry trade reversal).
In normal market conditions, signals will be rare.
Pine Screener BETA Support:
Add this indicator to your favorites and scan with long condition = true.
Screener results display both the MA deviation rate and current price.
When multiple signals occur, use the deviation rate as a reference to prioritize setups.
説明
このインジケーターは、暴落時など短期間で急落した銘柄のリバウンドを狙う逆張りトレードのエントリーシグナルを提供します。
25日移動平均線からの乖離率が -25% を下回ったときにシグナルが点灯します(初期設定)。シグナルはメインチャートのローソク足の下に赤い丸印で表示されます。
バックテスト結果(2000~2024年、日経225銘柄):
勝率: 64.73%
ペイオフレシオ: 1.141
破産確率: 0.0%(適切なリスク管理を行った場合)
トレードルール(買いのみ):
エントリー: 終値が25日移動平均線から25%以上下方乖離した場合、翌日の寄り付きで成行買い。
手仕舞い: 翌日の寄り付きで成行売り(以下のいずれかの条件を満たした場合)
終値が買値より10%以上上昇(利確)
終値が買値より10%以上下落(損切り)
エントリーから40日経過
注意点:
このインジケーターは、2008年リーマンショック、2011年東日本大震災、2020年コロナショック、2024年円キャリートレード巻き戻しショックなど、危機的局面で効果を発揮するように調整されています。
通常の相場ではシグナルはほとんど出現しません。
Pine Screener BETA 対応:
このインジケーターをお気に入り登録し、long condition = true をフィルター条件にしてスキャンしてください。
スクリーナー結果には移動平均乖離率と現在値が表示されます。
シグナルが同時に多数出現した場合は、移動平均乖離率を参考に優先順位をつけてください。

Daily Bollinger Band StrategyOverview of the Daily Bollinger Band Strategy
1. Strategy Overview and Features
This strategy is a tool for backtesting a trading method that uses Bollinger Bands. It is *not* a tool for automated trading.
1-1. Main Display Items
The main chart displays the Bollinger Bands and the 200-day moving average.
It also shows the entry and exit points along with the position size (in units of 100 shares).
1-2. Summary of Trading Rules
For long (buy) strategies, the trade enters when the price crosses above the +1σ line of the Bollinger Bands, aiming to ride an upward trend. The position is exited when the price crosses below the middle band.
For short (sell) strategies, the trade enters when the price crosses below the -1σ line of the Bollinger Bands, aiming to ride a downward trend. The position is exited when the price crosses above the middle band.
1-3. Strategic Enhancements
The strategy uses the slope of the 200-day moving average to determine the trend direction and enter trades accordingly. This improves the win rate and payoff ratio.
Additionally, to reduce the probability of ruin, the risk per trade is limited to 1.0% of capital, and position sizing is adjusted using ATR (a volatility indicator).
2. Trading Rules
2-1. Chart Type
Only daily charts are used.
2-2. Indicators Used
(1) Bollinger Bands** (used for entry and exit signals)
- Period: Fixed at 80 days
- Upper and lower bands: Fixed at ±1σ
(2) Moving Average** (used to determine trend direction)
- Period: Fixed at 200 days
- Trend direction is judged based on whether the difference from the previous day is positive (upward) or negative (downward)
2-3. Buy Rules
Setup:
- Price crosses above the +1σ line from below
- Both the middle band and 200-day moving average are upward sloping
Entry:
- Buy at the next day’s market open using a market order
Exit:
- If the price crosses below the middle band, sell at the next day’s open using a market order
2-4. Sell Rules
Setup:
- Price crosses below the -1σ line from above
- Both the middle band and 200-day moving average are downward sloping
Entry:
- Sell at the next day’s market open using a market order
Exit:
- If the price crosses above the middle band, buy back at the next day’s open using a market order
2-5. Risk Management Rules
- Risk per trade: 1.0% of total capital (acceptable loss = capital × 1.0%)
- Position size: Acceptable loss ÷ 2ATR (rounded down to the nearest unit of 100 shares)
2-6. Other Notes
- No brokerage fees
- No pyramiding
- No partial exits
- No reverse positions (no “stop-and-reverse” trades)
3. Strategy Parameters
The following settings can be specified:
3-1. Period Settings
- Start date: Set the start date for the backtest period
- Stop date: Set the end date for the backtest period
3-2. Display of Trend and Signals
- Show trend: When checked, the background color of the bars is light red for an uptrend and light blue for a downtrend
- Show signal: When checked, entry and exit signals are displayed (note: signals are executed at the next day’s open, so there is a one-day lag in the display)
3-3. Capital Management Settings
- Funds: Capital available for trading (in JPY)
- Risk rate: Specify what percentage of the capital to risk per trade
Settings in the “Properties” tab are not used in this strategy.
4. Backtest Results (Example)
Here are the backtest results conducted by the author:
- Target Stocks: All components of the Nikkei 225
- Test Period: January 4, 2000 – December 30, 2024
- Data Points: 12,886
- Win Rate: 33.45%
- Net Profit: ¥82,132,380
- Payoff Ratio: 2.450
- Expected Value: ¥6,373.8
- Risk Rate: 1.0%
- Probability of Ruin: 0.00%
---
デイリー・ボリンジャーバンド・ストラテジーの概要
1. ストラテジーの概要と特徴
このストラテジーは、ボリンジャーバンドを使ったトレード手法のバックテストを行うツールです。自動売買を行うツールではありません。
1-1. 主な表示項目
メインチャートにボリンジャーバンドと 200日移動平均線を表示します。
また、エントリーと手仕舞いのタイミングと数量(100株単位)も表示されます。
1-2. トレードルールの概要
買い戦略の場合、ボリンジャーバンドの +1σ 超えでエントリーして上昇トレンドに乗り、ミドルバンドを割ったら決済します。
売り戦略の場合、ボリンジャーバンドの -1σ 割りでエントリーして下降トレンドに乗り、ミドルバンドを上抜けたら決済します。
1-3. ストラテジーの工夫点
200日移動平均線の傾きを見てトレンド方向にエントリーをしています。こうして勝率とペイオフレシオの成績を向上しています。
また、破産確率を抑えるために、リスク資金比率を 1.0% にして、ATR(ボラティリティ指標) を使って注文数を調整しています。
2. 売買ルール
2-1. 使用するチャート
日足チャートに限定します
2-2. 使用する指標
(1) ボリンジャーバンド(仕掛けと手仕舞いのシグナルに使用)
期間は80日に固定
上下バンドは ±1σ に固定
(2) 移動平均線(トレンドの方向を見るために使用)
期間は200日に固定
移動平均の値の前日との差がプラスのとき上向き、マイナスのとき下向きと判断
2-3. 買いのルール
セットアップ:ボリンジャーバンドの +1σ を価格が下から上に交差 かつ ミドルバンドと 200日移動平均線が上向き
仕掛け:翌日の寄り付きに成行で買う
手仕舞い:ボリンジャーバンドのミドルバンドを価格が上から下に交差したら、翌日の寄り付きに成行で売る
2-4. 売りのルール
セットアップ:ボリンジャーバンドの -1σ を価格が上から下に交差 かつ ミドルバンドと 200日移動平均線が下向き
仕掛け:翌日の寄り付きに成行で売る
手仕舞い:ボリンジャーバンドのミドルバンドを価格が下から上に交差したら、翌日の寄り付きに成行で買い戻す
2-5. 資金管理のルール
リスク資金比率:資産の 1.0%(許容損失 = 資産 × 1.0%)
注文数:許容損失 ÷ 2ATR(単元株数未満は切り捨て)
2-6. その他
仲介手数料:なし
ピラミッディング:なし
分割決済:なし
ドテン:しない
3. ストラテジーのパラメーター
次の項目が指定できます。
3-1. 期間の設定
Staer date : バックテストの検証期間の開始日を指定します
Stop date : バックテストの検証期間の終了日を指定します
3-2. トレンドとシグナルの表示
Show trend : チェックを入れると、バーの背景色が、トレンドが上昇のときは薄い赤で、下落のときは薄い青で表示されます
Show signal : チェックを入れると、エントリーと手仕舞いのシグナルを表示します(シグナルの出た翌日の寄り付きに売買をするので表示に1日のずれがあります)
3-3. 資金管理用の設定
Funds : トレード用の資金(円)
Risk rate : 許容損失を資金の何%にするかで指定します
「プロパティタブ」で設定する値は、このストラテジーでは有効ではありません。
4. バックテストの結果(例)
作者がバックテストを実施した結果をお知らせします。
対象銘柄:日経225構成銘柄すべて
対象期間:2000年1月4日~2024年12月30日
データ件数:12,886
勝率:33.45%
純利益:82,132,380
ペイオフレシオ:2.450
期待値:6,373.8
リスク資金比率:1.0%
破産確率:0.00%

Low Price VolatilityI highlighted periods of low price volatility in the Nikkei 225 futures trading.
It is Japan Standard Time (JST)
This script is designed to color-code periods in the Nikkei 225 futures market according to times when prices tend to be more volatile and times when they are less volatile. The testing period is from March 11, 2024, to November 1, 2024. It identifies periods and counts where price movement exceeded half of the ATR, and colors are applied based on this data. There are no calculations involved; it simply uses the results of the analysis to apply color.

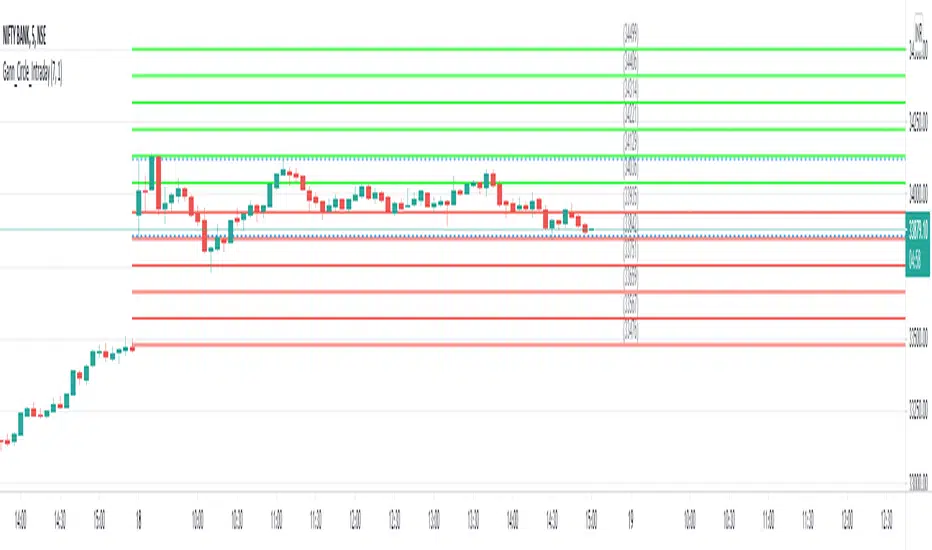
Gann Circle Intraday LevelsThis indicator is an intraday version of Gann Circle Swing Levels indicator. It further divides the Gann Circle into the Eighths in order to generate intraday Levels.
Introduction
This indicator is based on W. D. Gann's Square of 9 Chart and can be interpreted as the Gann Circle / Gann Wheel / 360 Degree Circle Chart or Square of the Circle Chart for intraday usage.
Spiral arrangement of numbers on the Square of 9 chart creates a very unique square root relationship amongst the numbers on the chart. If you take any number on the Square of 9 chart, take the square root of the number, then add 2 to the root and re-square it, resulting in one full 360 degree cycle (i.e. a 360 degree Circle) out from the center of the chart.
For example,
the square root of 121 = 11,
11 + 2 = 13,
and the square of 13 = 169
The number 169 is one full 360 degree cycle out (with reference to 121) from the center of the Square of 9 chart. If we further divide the circle in eight equal parts of 45 degree each, following intermediate resistance levels (ascending) would be generated:
127 (45 degree)
133 (90 degree)
139 (135 degree)
145 (180 degree)
151 (225 degree)
157 (270 degree)
163 (315 degree)
Similarly, if you take any number on the Square of 9 chart, take the square root of the number, then subtract 2 from the root and re-square it, resulting in one full 360 degree inward rotation towards the center of the chart.
For example,
the square root of 565 = 23.77,
23.77 - 2 = 21.77,
and the square of 21.77 = 473.93 (approximately equal to 474, which is directly below 565 on the Square of 9 chart)
The number 474 is one full 360 degree inward rotation (with reference to 565) towards the center of the chart. If we further divide the circle in eight equal parts of 45 degree each, following intermediate support levels (descending) would be generated:
553 (45 degree)
541 (90 degree)
529 (135 degree)
518 (180 degree)
507 (225 degree)
496 (270 degree)
485 (315 degree)
How to Use this Indicator ?
This indicator is designed to generate Gann Circle Intraday Levels based on HIGH and LOW of the opening bar for the day. You may use the bar interval (1 minute, 3 minutes, 5 minutes, 15 minutes etc.) which is suitable for the underlying instrument. Support and resistance lines for the day would be generated only after confirmation of the opening bar of the day.
Input :
Number of Gann Levels (Number of Gann Levels to be projected)
Color codes for the Support and Resistance Levels
Output :
Gann Support or Resistance Levels:
HIGH and LOW of the Opening bar for the day (dashed BLUE lines)
Support levels calculated with reference to the HIGH of the opening bar
Resistance levels calculated with reference to the LOW of the opening bar
Gann RetracementThe indicator is based on W. D. Gann's method of retracement studies. Gann looked at stock retracement action in terms of Halves (1/2), Thirds (1/3, 2/3), Fifths (1/5, 2/5, 3/5, and 4/5) and more importantly the Eighths (1/8, 2/8, 3/8, 4/8, 5/8, 6/8, and 7/8). Needless to say, {2, 3, 5, 8} are the only Fibonacci numbers between 1 to 10. These ratios can easily be visualized in the form of division of a Circle as follows :
Divide the circle in 12 equal parts of 30 degree each to produce the Thirds :
30 x 4 = 120 is 1/3 of 360
30 x 8 = 240 is 2/3 of 360
The 30 degree retracement captures fundamental geometric shapes like a regular Triangle (120-240-360), a Square (90-180-270-360), and a regular Hexagon (60-120-180-240-300-360) inscribed inside of the circle.
Now, divide the circle in 10 equal parts of 36 degree each to produce the Fifths :
36 x 2 = 72 is 1/5 of 360
36 x 4 = 144 is 2/5 of 360
36 x 6 = 216 is 3/5 of 360
36 x 8 = 288 is 4/5 of 360
where, (72-144-216-288-360) is a regular Pentagon.
Finally, divide the circle in 8 equal parts of 45 degree each to produce the Eighths :
45 x 1 = 45 is 1/8 of 360
45 x 2 = 90 is 2/8 of 360
45 x 3 = 135 is 3/8 of 360
45 x 4 = 180 is 4/8 of 360
45 x 5 = 225 is 5/8 of 360
45 x 6 = 270 is 6/8 of 360
45 x 7 = 315 is 7/8 of 360
where, (45-90-135-180-225-270-315-360) is a regular Octagon.
How to Use this indicator ?
The indicator generates Gann retracement levels between any two significant price points, such as a high and a low.
Input :
Swing High (significant high price point, such as a top)
Swing Low (significant low price point, such as a bottom)
Degree (degree of retracement)
Output :
Gann retracement levels (color coded as follows) :
Swing High and Swing Low (BLUE)
50% retracement (ORANGE)
Retracements between Swing Low and 50% level (RED)
Retracements between 50% level and Swing High (LIME)

GAURs Polynomial Regression ChannelsThanks to The Sweet Lord , here is the Gaur's Polynomial Regression Channel.
Its a Polynomial Regression Channel but applied a little differently. Wont go into technical details much. Overview of options is as follows-
- - - - - - - - - - - - - - - - - - - - - - - - - - - - - - - - - - - - - - - - - - - - - - - - - - - - - - - - - - - - - - - - - - - - - - - - - - - - - - - - - - - - - - - - - - - - - - - -
Channel Options
- - - - - - - - - - - - - - - - - - - - - - - - - - - - - - - - - - - - - - - - - - - - - - - - - - - - - - - - - - - - - - - - - - - - - - - - - - - - - - - - - - - - - - - - - - - - - - - -
1. Degree of Polynomial: 1/2/3
Default = 3
Defines the degree of polynomials - 1,2,3. Note here, degree 1 will not be a straight line since its applied differently.
Try different degrees for different fits and market conditions.
2. Channel Length:
Default 30 (candles)
You can go beyond 100 or 200 candle lengths but smaller is the usual preference of Poly-Reg-channel traders. It all depends on market conditions and your style of trading. Do your research. I am usually comfortable with a range of 20-50 (in crypto markets).
3. Basis of Channel height/boundries: ATR/Manual
Default: ATR
ATR provides a dynamically adjusted entry/exit bounds of the channels. As ATR changes, the channel bounds also changes its height. It can also be fixed manually. Manual heights wont change automatically.
4. Basis of Y-Value: open/close/ sma / ema / wma /hilow
Default: close
Y- value is the y value of the (x,y) coordinates used while calculating the regression coefficients. Dont worry about it, its nothing serious.
5. Apply channel smoothning using sma?: Yes/No
Default: Yes
Without smoothning, the channel does not "look" good.
6. Shaded Area Height Percentage:
Its the extra margin for the channel. Its in percentage of the total height (defined 3 above) of channels. The shaded area provides an extra allowance for your entries or exits beyond the ATR or manual heights.
7. Plot RSI?: Yes/No
Default: Yes
Plots RSI (orange line in between the channel - its different from the dotted center line) considering the downbound of channels as 0 (oversold) and upbound of channels as 100 (overbought)
8. Plot 200 sma?: Yes/No
Default: Yes
It plots a 200 period fast (green) and 225 period slow (red) sma . I usually use two MAs. Its visually very easy to understand.
- - - - - - - - - - - - - - - - - - - - - - - - - - - - - - - - - - - - - - - - - - - - - - - - - - - - - - - - - - - - - - - - - - - - - - - - - - - - - - - - - - - - - - - - - - - - - - - -
Sample Strategy
- - - - - - - - - - - - - - - - - - - - - - - - - - - - - - - - - - - - - - - - - - - - - - - - - - - - - - - - - - - - - - - - - - - - - - - - - - - - - - - - - - - - - - - - - - - - - - - -
You can develop your own strategy with the channels. But following is just one of the ways you can trade.
Best Application: Ranging markets. But can be happily used in volatile conditions, with a little experience.
1. SMA: -- (this condition is optional really)
If green (200) is above red (225) go only long. If red is above green go only short. Defines long term trend of the market.
2. Channel slope: -- (this stuff needs practice/experience)
Depending on the channel slope, like if its tending to go up or down, you can choose to take only short or long trades. It defines short term momentum of the market.
3. ATR based heights:
Since its ATR based, the channel height are our natural entry and exit points.
Long:
When price touches lower shaded area, consider possible long entry. Exit on price entering the upper shaded area.
Short:
Enter on upper bound shaded area, exit on lower.
4. RSI:
For additional conformations. Again note, the RSI considers the lower bound of channel as 0 and upper as 100. But since, the channel moves up and down, the RSI will also move not only as RSI but also with the channel. Meaning, say if the RSI is valued at 50, then it will be near the center of the channel but since the center changes as time and price changes, the RSI valued at 50 at different times will not be at the same horizontal level respect to the graph, although it will be at the same level (center) respect to the channel.
5. PRC Channel Percentage label:
This label is at the lower side a bit ahead of the current candle. Provides you info on what is the channel percentage. This is especially helpful in crypto markets to gauge your possible percentage profit where profits can be much higher than forex or other instruments. It can also helps you select a suitable market/instrument if the channels are based on ATR.
6. Extra indicators:
I usually use stochastic along with this setup for extra conformations.
- - - - - - - - - - - - - - - - - - - - - - - - - - - - - - - - - - - - - - - - - - - - - - - - - - - - - - - - - - - - - - - - - - - - - - - - - - - - - - - - - - - - - - - - - - - - - - - -
Donate
- - - - - - - - - - - - - - - - - - - - - - - - - - - - - - - - - - - - - - - - - - - - - - - - - - - - - - - - - - - - - - - - - - - - - - - - - - - - - - - - - - - - - - - - - - - - - - - -
Use freely and donate generously if you find value. Your help will really help.
I had earlier provided BTC addresses for donations but it seems to violate TV House rules.
Hope they make TV coins redeemable in future.
- Pranav Joshi
- - - - - - - - - - - - - - - - - - - - - - - - - - - - - - - - - - - - - - - - - - - - - - - - - - - - - - - - - - - - - - - - - - - - - - - - - - - - - - - - - - - - - - - - - - - - - - - -
Extra Info
- - - - - - - - - - - - - - - - - - - - - - - - - - - - - - - - - - - - - - - - - - - - - - - - - - - - - - - - - - - - - - - - - - - - - - - - - - - - - - - - - - - - - - - - - - - - - - - -
// © cpranavjoshi
// special thanks to the "Trading View" people for providing this great platform for free
// ------------------------
// MATH
// ------------------------
// special thanks to an article on the web that provided layman friendly explanation of the maths
// unfortunately i wont be able to provide the link to that article owing to TV restrictions, though i sincerely would have liked to credit the author.
// Google search this phrase, and you should be able to get it in one of the first results - "polynomialregression Mathematics of Polynomial Regression"
// my regression math calculation is a further resolution upon the generalized matrix formula given in the that article.
// the generalized matrix looks scary but in fact its much simpler than one may assume
// the summation sign things are just float numbers that can be easily found out
// so we get a matrix with number of equations equal to the number of unknowns.
// e.g. if its a 3rd degree poly, it has 4 unknowns (c0,c1,c2,c3) with 4 equations as in the generalized matrix
// it can be resolved by simple algebra
// Note: the results have been verified with excel using same input data points.
// pine was difficult for me so i coded it in python first to verify
// ------------------------
// WHY
// ------------------------
// this script was coded because Pranav badly needed Polynomial channels (had used them in mt4 earlier)
// and at the time of this coding, i could not find any readily available script in the trading view public library ( tnx public)
// the complex math was probably the hurdle
// i m not good in maths, but by the Will of the Lord, i could resolve the issue with simple algebra and logic
// ------------------------
// PINE
// ------------------------
// i am just an average (even poor probably) programmer and pine script is not my language
// this is a humble attempt to write my first pine with whatever i could do quickly
// experts - feel free to develop if needed. have used some workarounds in drawings/plottings. rectify them if possible
//
//
// - Pranav Joshi

Simple Pips GridOverview
This is a clean, simple, and highly practical indicator that draws horizontal grid lines at user-defined pip intervals.
Unlike other complex grid indicators, this script is designed to be lightweight and error-free. It eliminates automatic symbol detection and instead gives you full manual control, ensuring it works perfectly with any symbol you trade—FX, CFDs, Crypto, Stocks, Indices, and more.
Key Features
Universal Compatibility: Works with any trading pair by letting you manually define the pip value.
Fully Customizable: Easily set the pip interval for your grid (e.g., 10 pips, 50 pips, 100 pips).
Lightweight & Fast: Simple code ensures smooth performance without lagging your chart.
Visual Customization: Change the color, width, and style (solid, dashed, dotted) of the grid lines.
How to Use
It's incredibly simple to set up. You only need to configure two main settings:
Step 1: Set the "Pip Value"
This is the most important setting. You need to tell the indicator what "1 pip" means for the symbol you are currently viewing.
Go to the indicator settings and find the "Pip Value" input. Here are some common examples:
Symbol Pip Value (Input this number)
USD/JPY 0.01
EUR/USD 0.0001
GBP/USD 0.0001
XAU/USD (Gold) 0.1
JP225 (Nikkei 225) 10
US500 (S&P 500) 1
BTC/USD 0.1 or 1.0 (depending on your preference)
Step 2: Set the "Pip Interval"
Next, in the "Pip Interval" input, simply type how many pips you want between each line.
For a 10-pip grid, enter 10.
For a 50-pip grid, enter 50.
That's it! The grid will now be perfectly aligned to your specifications.
Additional Settings
Line Color, Width, Style: Customize the appearance of the lines to match your chart theme.
Number of Lines: Adjust how many lines are drawn above and below the current price to optimize performance and visibility.
This script was created with the assistance of Gemini (Google's AI) to be a simple and reliable tool for all traders. Feel free to use and modify it. Happy trading!

Mercury Venus Conjunction Sextiles 2019-2026How to Use It and What It Means Astrologically
How to Use the Script in TradingView
This Pine Script, called "Mercury Venus Aspects 2019–2026," is made to highlight the dates of Mercury-Venus conjunctions (0°) and sextiles (60°) from 2019 to 2026 on TradingView charts. Here's how to use it:
click “Add to Chart.” It will apply to any chart you have open—stocks, forex, crypto, etc.
Customize the Display
You can turn on/off the visibility of conjunctions and sextiles using checkboxes under "Inputs" in the settings.
You can also adjust the label size (small, normal, large, or huge) for better readability on your chart.
What You’ll See on the Chart
Conjunctions appear as blue shaded zones with labels like “C1,” “C2,” etc. These mark dates when Mercury and Venus are at the same degree.
Sextiles show up in orange with labels like “S1,” “S2,” marking when they’re about 60° apart.
Each event spans a 2-day window (one day before and after the exact aspect).
How to Use It Practically
You can overlay the script on market charts to look for any patterns between these planetary aspects and price movements.
You can also use it to plan personal or financial activities, since these aspects often affect communication, money, and relationships.
What to Keep in Mind
Dates are approximate and based on average planetary cycles (Mercury: ~88 days, Venus: ~225 days). For exact timing, use an ephemeris.
Only conjunctions and sextiles are shown. Oppositions, squares, and trines aren’t included because Mercury and Venus never get far enough apart (more than 75°).
This script is great for astrologers, traders, and enthusiasts who want to see Mercury-Venus aspects directly on their charts and explore their possible effects.
Astrological Meaning of Mercury-Venus Aspects
What Mercury and Venus Represent
Mercury rules communication, thinking, technology, travel, and trade. In global events (mundane astrology), it affects media, markets, and movement of information.
Venus is about love, beauty, money, and pleasure. It influences relationships, aesthetics, and finance. In the world stage, it’s linked to luxury, art, fashion, and economic balance.
When Mercury and Venus form aspects (like conjunctions or sextiles), their energies mix in helpful ways that can affect people and events.
Conjunction (0°) – Mercury and Venus Together
These two planets are in the same sign and degree, so their qualities merge.
For people:
Positive: Smooth communication, charm, creativity, and better relationships. Great for romance, art, and social interaction.
Negative: Too much focus on appearances, sweet talk, or pleasure can cloud judgment. Decisions may lack depth.
For the economy:
Positive: Boosts in media, entertainment, fashion, and tech. Good for trade, deals, and optimism in financial markets.
Negative: Risk of overspending or unrealistic expectations. May cause small market bubbles or misleading hype.
Sextile (60°) – Mercury and Venus in Harmony
These two planets are two signs apart, creating a smooth, supportive energy.
For people:
Positive: Easy conversations, creative teamwork, small financial wins, and pleasant social experiences.
Negative: Energy is mild, so opportunities might be missed if not acted on. People may avoid hard decisions.
For the economy:
Positive: Gradual improvements in areas like marketing, social media, hospitality, and design. Good for diplomacy.
Negative: Lack of strong initiative could limit bigger gains. Minor missteps are possible due to a laid-back attitude.
General Effects
These aspects are mostly beneficial. They support creativity, financial thinking, and social harmony.
Downsides: Conjunctions may lead to overindulgence or shallow choices, while sextiles may cause missed chances due to low energy.
These aspects rarely cause major economic shifts on their own but can amplify trends depending on other planetary influences (like Saturn or Uranus).
Zodiac Sign Influence
Fire signs (Aries, Leo, Sagittarius): Bold communication, energetic spending, gains in media or entertainment.
Earth signs (Taurus, Virgo, Capricorn): Practical results, stable finances, growth in real-world assets like property or food.
Air signs (Gemini, Libra, Aquarius): Intellectual growth, tech innovation, and social ideas flourish.
Water signs (Cancer, Scorpio, Pisces): Emotional depth in conversations, artistic growth, and financial sensitivity.
Mercury-Venus aspects are gentle but helpful. They combine logic (Mercury) with emotion and value (Venus). They’re good times for love, communication, and money—but their benefits depend on how we use the energy. This script lets you easily track these moments on a chart and explore how they might align with real-life trends or decisions.
Disclaimer: This script and its interpretations are for informational and educational purposes only. They do not constitute financial, trading, or professional astrological advice. Always conduct your own research and consult qualified professionals before making any financial or personal decisions. Use at your own discretion.

Classic Nacked Z-Score ArbitrageThe “Classic Naked Z-Score Arbitrage” strategy employs a statistical arbitrage model based on the Z-score of the price spread between two assets. This strategy follows the premise of pair trading, where two correlated assets, typically from the same market sector, are traded against each other to profit from relative price movements (Gatev, Goetzmann, & Rouwenhorst, 2006). The approach involves calculating the Z-score of the price spread between two assets to determine market inefficiencies and capitalize on short-term mispricing.
Methodology
Price Spread Calculation:
The strategy calculates the spread between the two selected assets (Asset A and Asset B), typically from different sectors or asset classes, on a daily timeframe.
Statistical Basis – Z-Score:
The Z-score is used as a measure of how far the current price spread deviates from its historical mean, using the standard deviation for normalization.
Trading Logic:
• Long Position:
A long position is initiated when the Z-score exceeds the predefined threshold (e.g., 2.0), indicating that Asset A is undervalued relative to Asset B. This signals an arbitrage opportunity where the trader buys Asset B and sells Asset A.
• Short Position:
A short position is entered when the Z-score falls below the negative threshold, indicating that Asset A is overvalued relative to Asset B. The strategy involves selling Asset B and buying Asset A.
Theoretical Foundation
This strategy is rooted in mean reversion theory, which posits that asset prices tend to return to their long-term average after temporary deviations. This form of arbitrage is widely used in statistical arbitrage and pair trading techniques, where investors seek to exploit short-term price inefficiencies between two assets that historically maintain a stable price relationship (Avery & Sibley, 2020).
Further, the Z-score is an effective tool for identifying significant deviations from the mean, which can be seen as a signal for the potential reversion of the price spread (Braucher, 2015). By capturing these inefficiencies, traders aim to profit from convergence or divergence between correlated assets.
Practical Application
The strategy aligns with the Financial Algorithmic Trading and Market Liquidity analysis, emphasizing the importance of statistical models and efficient execution (Harris, 2024). By utilizing a simple yet effective risk-reward mechanism based on the Z-score, the strategy contributes to the growing body of research on market liquidity, asset correlation, and algorithmic trading.
The integration of transaction costs and slippage ensures that the strategy accounts for practical trading limitations, helping to refine execution in real market conditions. These factors are vital in modern quantitative finance, where liquidity and execution risk can erode profits (Harris, 2024).
References
• Gatev, E., Goetzmann, W. N., & Rouwenhorst, K. G. (2006). Pairs Trading: Performance of a Relative-Value Arbitrage Rule. The Review of Financial Studies, 19(3), 1317-1343.
• Avery, C., & Sibley, D. (2020). Statistical Arbitrage: The Evolution and Practices of Quantitative Trading. Journal of Quantitative Finance, 18(5), 501-523.
• Braucher, J. (2015). Understanding the Z-Score in Trading. Journal of Financial Markets, 12(4), 225-239.
• Harris, L. (2024). Financial Algorithmic Trading and Market Liquidity: A Comprehensive Analysis. Journal of Financial Engineering, 7(1), 18-34.

WD Gann: Close Price X Bars Ago with Line or Candle PlotThis indicator is inspired by the principles of WD Gann, a legendary trader known for his groundbreaking methods in time and price analysis. It helps traders track the close price of a security from X bars ago, a technique that is often used to identify key price levels in relation to past price movements. This concept is essential for Gann’s market theories, which emphasize the relationship between time and price.
WD Gann’s analysis often revolved around specific numbers that he considered significant, many of which correspond to squared numbers (e.g., 1, 4, 9, 16, 25, 36, 49, 64, 81, 100, 121, 144, 169, 196, 225, 256, 289, 324, 361, 400, 441, 484, 529, 576, 625, 676, 729, 784, 841, 900, 961, 1024, 1089, 1156, 1225, 1296, 1369, 1444, 1521, 1600, 1681, 1764, 1849, 1936). These numbers are believed to represent natural rhythms and cycles in the market. This indicator can help you explore how past price levels align with these significant numbers, potentially revealing key price zones that could act as support, resistance, or reversal points.
Key Features:
- Historical Close Price Calculation: The indicator calculates and displays the close price of a security from X bars ago (where X is customizable). This method aligns with Gann's focus on price relationships over specific time intervals, providing traders with valuable reference points to assess market conditions.
- Customizable Plot Type: You can choose between two plot types for visualizing the historical close price:
- Line Plot: A simple line that represents the close price from X bars ago, ideal for those who prefer a clean and continuous representation.
- Candle Plot: Displays the close price as a candlestick chart, providing a more detailed view with open, high, low, and close prices from X bars ago.
- Candle Color Coding: For the candle plot type, the script color-codes the candles. Green candles appear when the close price from X bars ago is higher than the open price, indicating bullish sentiment; red candles appear when the close is lower, indicating bearish sentiment. This color coding gives a quick visual cue to market sentiment.
- Customizable Number of Bars: You can adjust the number of bars (X) to look back, providing flexibility for analyzing different timeframes. Whether you're conducting short-term or long-term analysis, this input can be fine-tuned to suit your trading strategy.
- Gann Method Application: WD Gann's methods involved analyzing price action over specific time periods to predict future movements. This indicator offers traders a way to assess how the price of a security has behaved in the past in relation to a chosen time interval, a critical concept in Gann's theories.
How to Use:
1. Input Settings:
- Number of Bars (X): Choose the number of bars to look back (e.g., 100, 200, or any custom period).
- Plot Type: Select whether to display the data as a Line or Candles.
2. Interpretation:
- Using the Line plot, observe how the close price from X bars ago compares to the current market price.
- Using the Candles plot, analyze the full price action of the chosen bar from X bars ago, noting how the close price relates to the open, high, and low of that bar.
3. Gann Analysis: Integrate this indicator into your broader Gann-based analysis. By looking at past price levels and their relationship to significant squared numbers, traders can uncover potential key levels of support and resistance or even potential reversal points. The historical close price can act as a benchmark for predicting future market movements.
Suggestions on WD Gann's Emphasis in Trading:
WD Gann’s trading methods were rooted in several key principles that emphasized the relationship between time and price. These principles are vital to understanding how the "Close Price X Bars Ago" indicator fits into his overall analysis:
1. Time Cycles: Gann believed that markets move in cyclical patterns. By studying price levels from specific time intervals, traders can spot these cycles and predict future market behavior. This indicator allows you to see how the close price from X bars ago relates to current market conditions, helping to spot cyclical highs and lows.
2. Price and Time Squaring: A core concept in Gann’s theory is that certain price levels and time periods align, often marking significant reversal points. The squared numbers (e.g., 1, 4, 9, 16, 25, etc.) serve as potential key levels where price and time might "square" to create support or resistance. This indicator helps traders spot these historical price levels and their potential relevance to future price action.
3. Geometric Angles: Gann used angles (like the 45-degree angle) to predict market movements, with the belief that prices move at specific geometric angles over time. This indicator gives traders a reference for past price levels, which could align with key angles, helping traders predict future price movement based on Gann's geometry.
4. Numerology and Key Intervals: Gann paid particular attention to numbers that held significance, including squared numbers and numbers related to the Fibonacci sequence. This indicator allows traders to analyze price levels based on these key numbers, which can help in identifying potential turning points in the market.
5. Support and Resistance Levels: Gann’s methods often involved identifying levels of support and resistance based on past price action. By tracking the close price from X bars ago, traders can identify past support and resistance levels that may become significant again in future market conditions.
Perfect for:
Traders using WD Gann’s methods, such as Gann angles, time cycles, and price theory.
Analysts who focus on historical price levels to predict future price action.
Those who rely on numerology and geometric principles in their trading strategies.
By integrating this indicator into your trading strategy, you gain a powerful tool for analyzing market cycles and price movements in relation to key time intervals. The ability to track and compare the historical close price to significant numbers—like Gann’s squared numbers—can provide valuable insights into potential support, resistance, and reversal points.
Disclaimer:
This indicator is based on the methods and principles of WD Gann and is for educational purposes only. It is not intended as financial advice. Trading involves significant risk, and you should not trade with money that you cannot afford to lose. Past performance is not indicative of future results. The use of this indicator is at your own discretion and risk. Always do your own research and consider consulting a licensed financial advisor before making any investment decisions.

AZ V.3 Test ++Position Size Fix+Float
Core Concept
This Strategy is Base on EMA Cross
But thing what make this strategy be different from original CDC Action Zone V.3 is "Position Size"
Compound Profit & Not Compound Profit Strategy
Position Sizing Concept
Be real.Everyone know the key of survive in the Market is "Risk & Money Management"
So, How can we manage our Risk and Money?
Yes, The key is " Make the Risk celling "
////////////////////////////////////
//// (Risk% * 100) / Stoploss % ////
////////////////////////////////////
How can we make the Risk celling?
1. Define your Risk Per Trade for you. (How much % money of your portfolio are you willing to pay for this trade?)
- Example -
- I Have 3,000$ in my portfolio.
- I think i can take the risk per trade for my trade 2.5% of my portfolio. (75$)
- I calculate the Position Size of my trade to pay 2.5% of my portfolio when i need to stoploss. (75$)
- And then, I have 97.5% of my fund (2,925$) for fight in next trade.
- ***** So, I'll never lose a big money of my fund. And "SURVIVE" in long term. *****
2. Mark the "Entry Point" and "Stop Loss Point"
- Example -
- I have a Entry Point at price 30,000 $
- I Make the "Hard Stop" at previous low 11 Bar. (Hard Stop = When the price went lower from this point, We Sell this position without any pity)
- For example. I assume the previous low is 20,000$
- I Clac. the different % from Entry to Stoploss. (33%)
- ***** So, If the price went low from Entry Point -33%. I'll stop this position. *****
3. Calculate my position size.
////////////////////////////////////
//// (Risk% * 100) / Stoploss % ////
////////////////////////////////////
- In the past 2 Example.
- We have Risk% = 2.5%
- We have Stoploss% = 33%
- So, We clac. >>
- 7.575757 >> 7.5 % of my Portfolio
- 7.5 % of my Portfolio = 225 $
- ***** When my position Dropdown I'll lose for this trade and survive to fight in next trade. *****
Compound Profit Concept
We calculate the base equity from
Normal People use this.
Not Compound Profit Concept
We calculate the base equity from
If we have some profit. We use this profit for "Reserve" the loss in next trade.

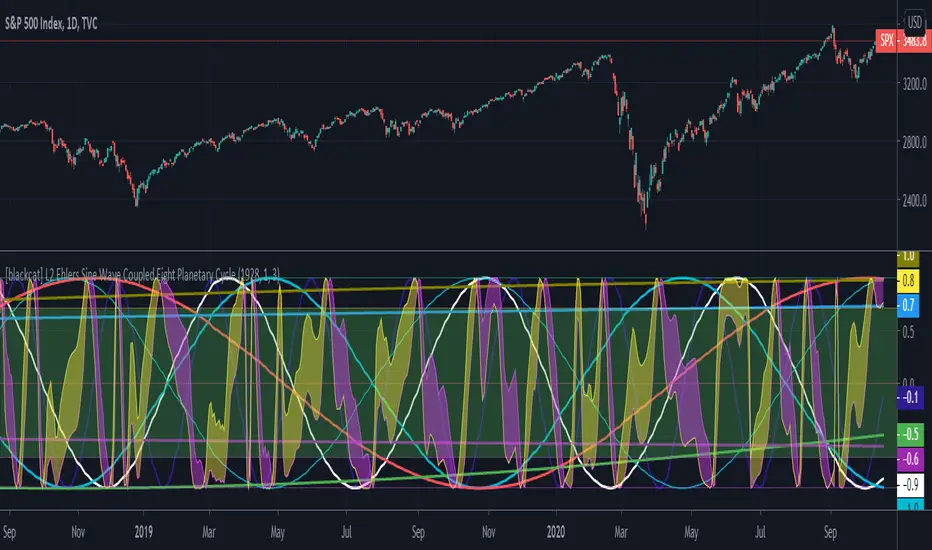
[blackcat] L2 Ehlers Sine Wave Coupled Eight Planetary CycleLevel: 2
Background
Have you considered that factors outside the Earth will be related to macro market trends? Let’s discuss the relationship between the planetary movement in the Galaxy and the market movement on Earth today! Although I said that, you may have laughed out in front of the screen, but the calculations in this script are entirely based on astronomical data and mathematical relationships.
Your next question may be why you compare the movements of the eight planets and the laws of the market on the earth together? My answer comes from a Cybernetic Sine Wave indicator proposed by Dr. John F. Ehlers.
Function
L2 Ehlers Sine Wave Coupled Eight Planetary Cycle first converts the astronomical data of the eight major planets into planetary aspects/phases through mathematical relationships. Planetary aspects/phases can provide the historical and current relative positions of each planet in the mathematical triangle relationship. We can use a simple mathematical sine formula to constrain the planet's trajectory between -1 and 1, which is what we often call a sine wave.
The relationship between the sine wave and the market can be extracted from the theory of John F. Ehlers. In Ehlers' theory, market price can be modeled by the trend and cycle modes. And in his works, there are many indicators of how to completely remove the trend in the market price and only leave the cycle mode data. The Cybernetic Sine Wave indicator is exactly the cycle mode data after the market trend is stripped, and expressed in the form of a sine wave.
If you can read to here with patience, you must also be aware of the premise that the trajectories of the eight planets and the laws of the earth market can be coupled: the trajectory of the sine wave mode. Therefore, this indicator is a tool for comparing and analyzing the two in the same chart. I hope you like it.
Finally, in order to benchmark the trajectories of the eight planets and the specific market on the earth, a starting point in time is particularly important. This is the base date of the market index to be analyzed. It is the year, month, and day data specified by the index, which needs to be input by the user when analyzing a specific stock index. For example, the base date of the S&P 500 index is January 3, 1928. This date needs to be entered into the indicator to analyze the SPX500.
Key Signal
Mercury_trail ---> smoothed Mercury orbit sine wave
Venus_trail ---> smoothed Venus orbit sine wave
Earth_trail ---> smoothed Earth orbit sine wave
Earth_mirror ---> smoothed Earth mirrored orbit sine wave
Mars_trail ---> smoothed Mars orbit sine wave
Jupiter_trail ---> smoothed Jupiter orbit sine wave
Saturn_trail ---> smoothed Saturn orbit sine wave
Uranus_trail ---> smoothed Uranus orbit sine wave
Neptune_trail ---> smoothed Neptune orbit sine wave
Aspect 0, 45, 90, 225, 270 deg ---> key planet aspects
ehlersine ---> Ehlers Cybernetic Sine Wave
ehlerslsine ---> Ehlers Cybernetic Lead Sine Wave
Pros and Cons
This is a technical indicator that I have come up with on a whim, and the laws of planetary operation and the operation of the Earth market are still being explored. Hope that interested friends will share your new discoveries.
Remarks
To celebrate I released the 50th technical indicator script on TV!
Courtesy of @sal157011 John Ehlers "Cybernetic Sine Wave" indicator, I converted it from pine v2 to pine v4 in this script.
Readme
In real life, I am a prolific inventor. I have successfully applied for more than 60 international and regional patents in the past 12 years. But in the past two years or so, I have tried to transfer my creativity to the development of trading strategies. Tradingview is the ideal platform for me. I am selecting and contributing some of the hundreds of scripts to publish in Tradingview community. Welcome everyone to interact with me to discuss these interesting pine scripts.
The scripts posted are categorized into 5 levels according to my efforts or manhours put into these works.
Level 1 : interesting script snippets or distinctive improvement from classic indicators or strategy. Level 1 scripts can usually appear in more complex indicators as a function module or element.
Level 2 : composite indicator/strategy. By selecting or combining several independent or dependent functions or sub indicators in proper way, the composite script exhibits a resonance phenomenon which can filter out noise or fake trading signal to enhance trading confidence level.
Level 3 : comprehensive indicator/strategy. They are simple trading systems based on my strategies. They are commonly containing several or all of entry signal, close signal, stop loss, take profit, re-entry, risk management, and position sizing techniques. Even some interesting fundamental and mass psychological aspects are incorporated.
Level 4 : script snippets or functions that do not disclose source code. Interesting element that can reveal market laws and work as raw material for indicators and strategies. If you find Level 1~2 scripts are helpful, Level 4 is a private version that took me far more efforts to develop.
Level 5 : indicator/strategy that do not disclose source code. private version of Level 3 script with my accumulated script processing skills or a large number of custom functions. I had a private function library built in past two years. Level 5 scripts use many of them to achieve private trading strategy.
Terminal : USD Based Stock Markets Change (%)Hello.
This script is a simple USD Based Stock Markets Change (%) Data Terminal.
You can also set the period to look back manually in the menu.
In this way, an idea can be obtained about Countries' Stock Markets.
And you can observe the stock exchanges of relatively positive and negative countries from others.
Features
Value changes on a percentage basis (%)
Stock exchange values are calculated in dollar terms.
Due to the advantage of movement, future data were chosen instead of spot values on the required instruments.
Stock Markets
Usa : S&P 500 Futures
Japan: Nikkei 225 Futures
England: United Kingdom ( FTSE ) 100
Australia: Australia 200
Canada: S&P / TSX Composite
Switzerland: Swiss Market Index
New Zealand: NZX 50 Index
China: SSE Composite (000001)
Denmark: OMX Copenhagen 25 Index
Hong-Kong: Hang Seng Index Futures
India: Nifty 50
Norway: Oslo Bors All Share Index
Russia: MOEX Russia Index
Sweden: OMX Stockholm Index
Singapore: Singapore 30
Turkey: BIST 100
South Africa: South Africa Top 40 Index
Spain: IBEX 35
France: CAC 40
Italy: FTSE MIB Index
Netherlands: Netherlands 25
Germany : DAX
Regards.

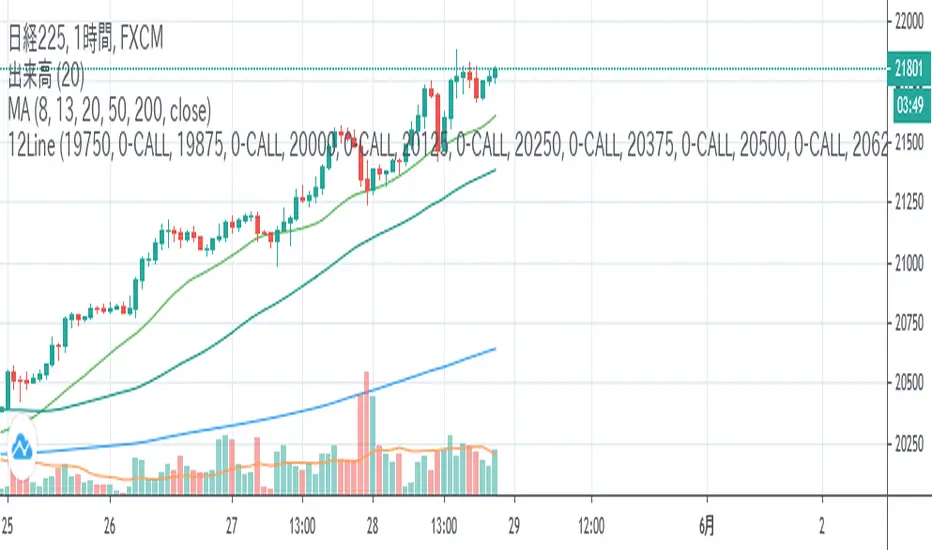
12LineA horizontal line is displayed during Nikkei 225 futures trading to help you draw a line quickly.
If you check the check box, you can display up to 12 lines of 6 types at the entered price.
日経平均先物取引時に水平ラインを表示し、素早いライン描画を助けます。
表示したい価格を入力し、チェックボックスをONにすると6種類の線を最大12本表示できます。
Price CorrelationsThis indicator shows price correlations of your current chart to various well-known indices.
Values above 0 mean a positive correlation, below 0 a negative correlation (not correlated).
It works well with daily candle charts and above, but you may also try it on 1h candles.
The default indices:
- Gold
- S&p 500
- Mini Dow Jones
- Dow Jones
- Russel 2000
- Nasdaq 100
- Crude Oil
- Nikkei 225 (Japan)
- FTSE 100 (UK)
- Silver
- DAX Futures (DE)
You can change the defaults to compare prices with other indices or stocks.

USDJPY Assumption v1Based on the "logical trading" post of Charles Cornley (thanks!).
Indicator States:
Very Bullish (Lime) = USD trend rising and JPY trend falling and Gold trend falling and US 10Y Bond trend falling and
Dow Jones trend rising and Nasdaq trend rising and Russell 2000 trend rising and
S&P 500 trend rising and Nikkei 225 trend rising
Bullish (Green) = USD trend rising and JPY trend falling
Bearish (Red) = USD trend falling and JPY trend rising
