COLOUR CODED ULTIMATE OSCILLATOR WITH LEVELS (70/50/30)Just added 70/30/50 levels to @LazyBear 's "Color Coded UO" script.
Happy Trading!
Поиск скриптов по запросу "欧元汇率走势30天"

[STRATEGY]EMA 30/60 Cross Strategystrategy based on EMA 30/60 cross
works best on 4hr timeframes & high-midcaps

5 Moving Average Exponential 7-15-30-50-2005 Moving Average Exponential. Crypto EMA. 7 is a fast support or resistance, 15 confirmation support or resistance. 30 Important support and resistance. 50 institutional support or resistance. 200 general trend, support and resistance.

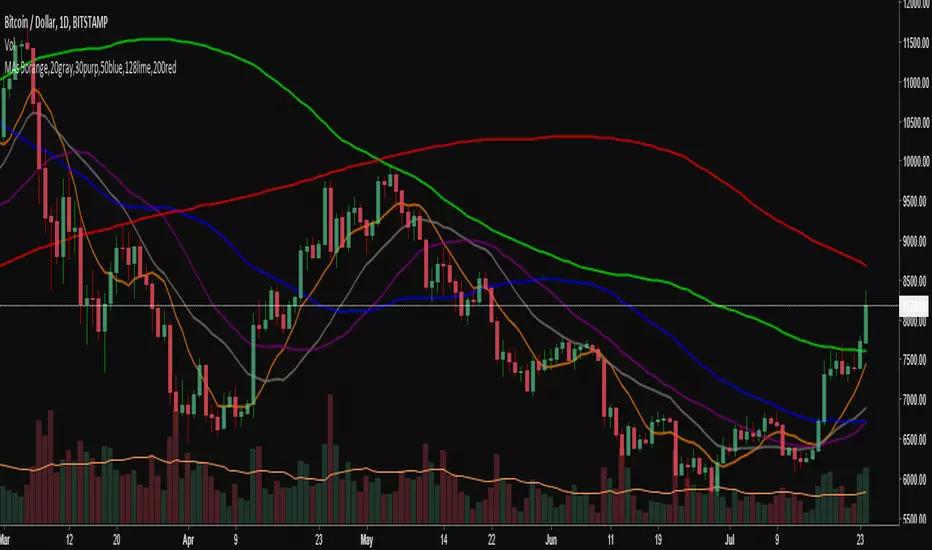
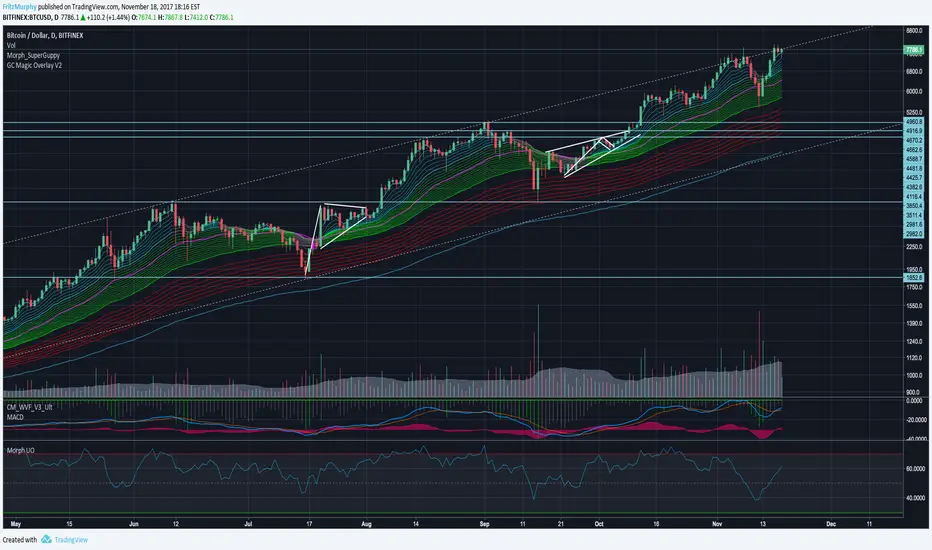
6 SMA's (fit to BTC) 9,20,30,50,128,200 (exponential optional)I've been using these for a while trading Bitcoin and I've found them to be the most useful to me. I replaced the 7 you may have seen in the first set with the 9 as I'm seeing it tested across many time frames quite frequently. The least used of the six is the 30 period, but it does have some influence I've found on the large time frames, mainly the weekly.

6 Simple Moving Averages 9,20,30,50,128,200 (bitcoin tested)I've condensed my SMAs down to these 6 and have found them to be most useful for Bitcoin, which is what I trade the most. They all have played their roll in acting as support and resistance and making decisions with the 30 period probably the least relevant, but relevant nonetheless. There is the option to change to exponential if desired.

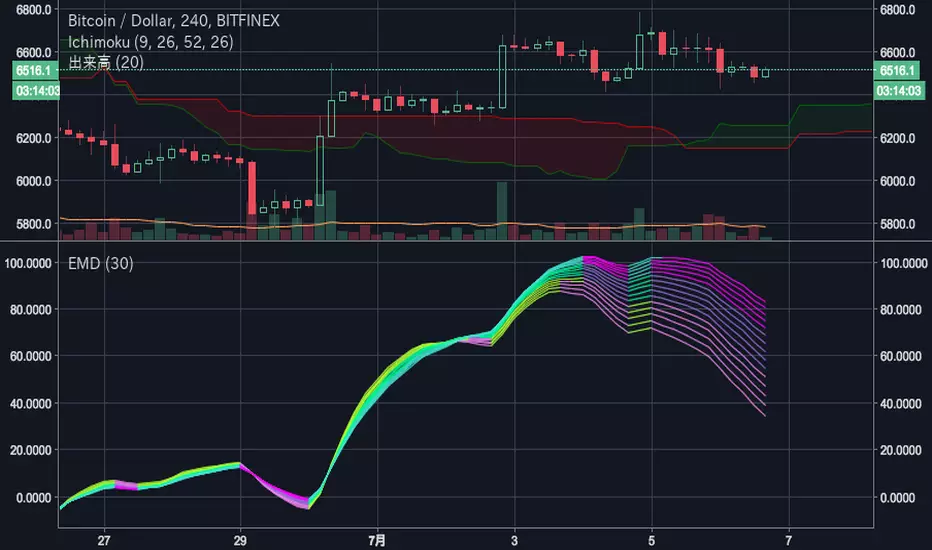
EvaMacD for 30 linesEva Chart calculate IIR Filter with Multiple MACD Histogram and estimate the cycle.
This oscillator can find the most powerful frequency. This use 30 MACD histogram lines tuned for filter.

Simple Moving Averages (7, 30, 50, 100, 200)7, 30, 50, 100, 200 simple moving averages, bundled in one indicator (for users who are using the free TradingView service and can only load limited number of indicators at any given time).
You can turn each moving average on or off at will and change the colors.

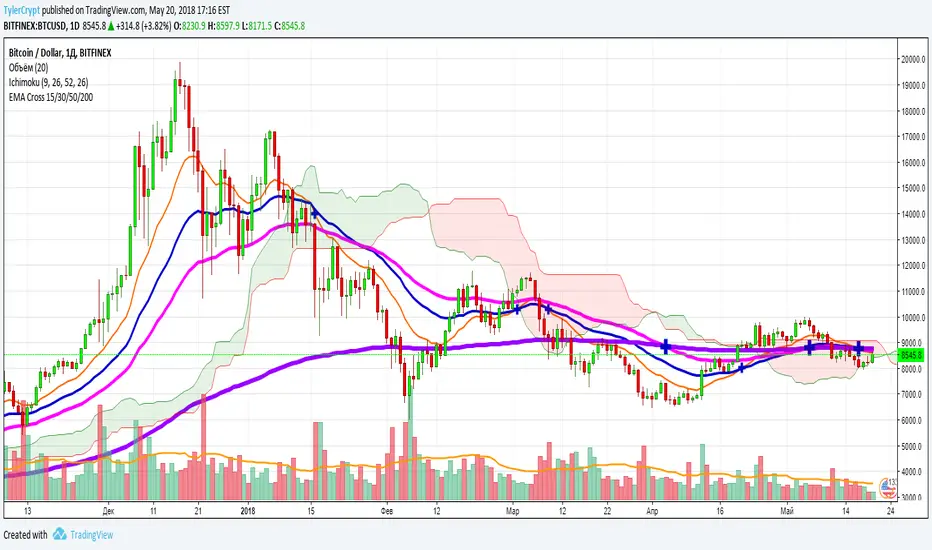
Guppy MMA 3, 5, 8, 10, 12, 15 and 30, 35, 40, 45, 50, 60Guppy Multiple Moving Average
Short Term EMA 3, 5, 8, 10, 12, 15
Long Term EMA 30, 35, 40, 45, 50, 60
Use for SFTS Class

Ultimate Oscillator with 70/30/50 LinesUltimate Oscillator with 70/30/50 lines and a background.
Read how to use it here:
stockcharts.com
Enjoy :)


9:30 USA OPENEasy if it go up it will turn green and you can lng if it goes down it will turn red and you can short

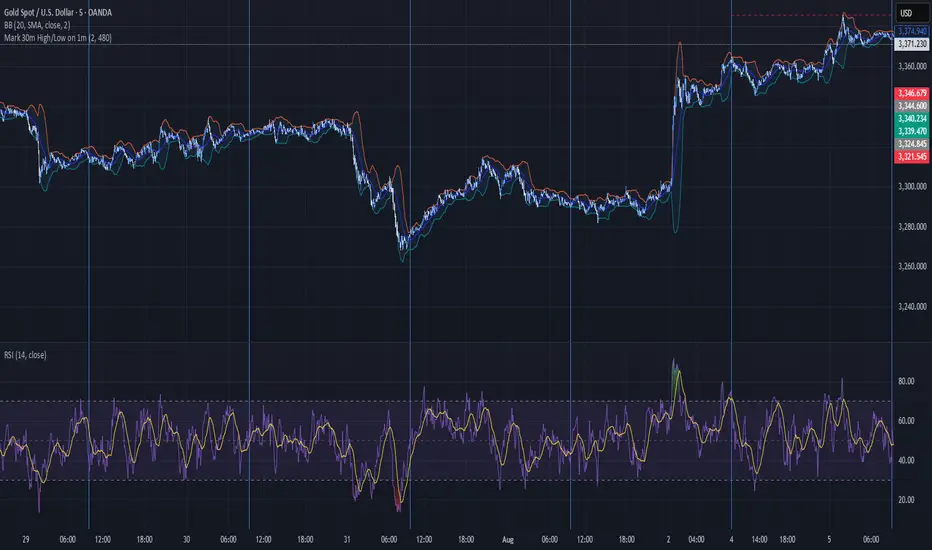
Mark 30m High/Low on 1m30 MIN HIGHS AND LOWS
Marked on the one minute chart.
High is marked with a green line.
Low is marked with a red line.
MTF EMA Pane with Diagnostics30 sec chart, 1 min EMA goes flat, I buy, 1 min EMA stays inside the group, I stay in the trade.
Not financial advice. I am working on an Algo killer, stay tuned. I am dedicating the rest of my life, as short as it my be, to beating the Men behind the Algo's. Buy me some coffee.
Send USDT thru ETH or Base to BYDFi 0x20391e32afd61dc9e1ec027651391b56ceade4e0
Join BYDFi
Referral Link: Spin for a possible $100
partner.bydfi.com
Deposit: USDT via;
ETH (ERC20) 0x20391e32afd61dc9e1ec027651391b56ceade4e0
Tron (TRC20)
TUs5u2YxtQrQfRwYK2CsMmSDGvND6Uopdj
BNB/Base (BEP20)
0x20391e32afd61dc9e1ec027651391b56ceade4e0
Solana
696LAngiQBbdk4m6k1ZBiKZrFtjTJo6dxCnVXMEePQea

30s OR ProjectionsThis script gets the opening range for NQ,ES, and YM. It then created deviations based on this range as targets to take profit from. You may also use the deviations to enter into trades looking for the other side of the range. You have the ability to shade areas of the range.

7:30 AM ET Bar HighlighterHow it works
Step Explanation
1️⃣ hour(time, targetTZ) and minute(time, targetTZ) convert each bar’s opening time to America/New_York and check for 7 : 25.
2️⃣ When both match, isTargetBar becomes true.
3️⃣ bgcolor() paints that candle red, and plotshape() draws the white dot just above it.
Adjustable Color Changing WMA by Slope Degree30 weighted moving average that changes colors based upon degree of slope. Consider it a green light for buying/selling pullbacks to the wma. You can adjust the colors and the threshold for the degree of slope.

30 Day Moving AverageThis indicator offers a longer time frame view compared to the 9 day moving average. This can give a better indication over longer term market moves.

Grok/Claude Quantum Signal Pro * Grok/Claude X Series*Grok/Claude Quantum Signal Pro
This is a TradingView indicator focused on catching momentum reversals at price extremes, with a sophisticated divergence detection system as its standout feature. The "Quantum" branding is marketing flair — under the hood, it's a well-structured combination of momentum oscillators, volatility bands, and divergence analysis working together to identify high-probability turning points.
Core Philosophy
The indicator asks: "Is price at an extreme level where momentum is exhausted, and is there evidence that a reversal or continuation is likely?"
It approaches this by requiring multiple confirming factors before generating a signal. Price must be at a band extreme, momentum indicators must be at extreme readings, and the market must be trending (not choppy). Optionally, it can also require RSI divergence and volume confirmation.
The Dynamic Envelope Bands
The foundation is an adaptive channel built around a moving average (EMA or SMA, user's choice). The bands extend above and below this centerline using ATR (Average True Range) multiplied by a dynamic factor.
What makes these bands "adaptive" is that the multiplier adjusts based on ADX — when trends are stronger, the bands widen to accommodate larger directional moves. In weaker trend environments, the bands stay tighter. This helps the bands stay relevant across different market conditions rather than being too loose in quiet markets or too tight during volatile trends.
The centerline itself is color-coded based on its slope: green when rising, red when falling, yellow when flat. This gives immediate visual feedback on short-term directional bias.
The Multi-Layer Filter System
Signals must pass through several filters before being displayed. Here's what each filter does:
FilterWhat It ChecksDefault StateADX TrendingIs ADX above threshold (20)? Avoids signals in choppy, directionless marketsRequired (always on)RSI ExtremesIs RSI oversold (<30) for buys, overbought (>70) for sells?Required (always on)Fisher TransformIs Fisher below -2.0 for buys, above +2.0 for sells? Confirms momentum exhaustionRequired (always on)Trend AlignmentIs price above/below the trend EMA in the right direction?Optional (off by default)Volume SurgeIs current volume significantly above average?Optional (off by default)DivergenceIs there an active RSI divergence pattern?Optional (off by default)
The Fisher Transform
The Fisher Transform is a lesser-known oscillator that converts price into a Gaussian normal distribution, making extreme values much more pronounced. When Fisher readings hit +2.0 or -2.0, it indicates statistically significant momentum exhaustion. By requiring both RSI and Fisher to be at extremes simultaneously, the indicator filters out many false signals that would occur using just one oscillator.
The Detrended Price Oscillator (DPO)
The indicator also calculates DPO, which removes the trend component from price to show where current price sits relative to a historical average. This is displayed in the info panel as a percentage — positive values mean price is extended above its typical level, negative values mean it's extended below. This helps gauge how "stretched" price is from its mean.
RSI Divergence Detection — The Core Feature
This is where the indicator really shines. It detects both regular divergences (reversal signals) and hidden divergences (continuation signals).
Regular Divergences
Regular divergences suggest potential reversals:
Regular Bullish Divergence: Price makes a lower low, but RSI makes a higher low. This indicates that despite price falling further, selling momentum is actually weakening — a potential bottom signal. These are marked with cyan/light blue solid lines on the chart.
Regular Bearish Divergence: Price makes a higher high, but RSI makes a lower high. Despite price rising further, buying momentum is weakening — a potential top signal. Also marked with cyan solid lines.
Hidden Divergences
Hidden divergences suggest trend continuation (often overlooked by traders):
Hidden Bullish Divergence: Price makes a higher low, but RSI makes a lower low. The uptrend is healthy (higher lows in price), but RSI dipped lower, creating a "hidden" bullish setup that often precedes another leg up. Marked with purple dashed lines.
Hidden Bearish Divergence: Price makes a lower high, but RSI makes a higher high. The downtrend structure is intact, but RSI bounced higher, suggesting another leg down is coming. Also marked with purple dashed lines.
The divergence detection uses pivot points (local highs and lows) to identify the comparison points. Users can adjust the pivot lookback (how many bars to use for pivot identification) and the maximum lookback window for finding divergence pairs.
Signal Generation Logic
A buy signal fires when all these conditions align:
Market is trending (ADX above threshold)
RSI is in oversold territory (below 30)
Fisher Transform is oversold (below -2.0)
Plus any optional filters that are enabled
A sell signal requires the mirror conditions: trending market, overbought RSI (above 70), and overbought Fisher (above +2.0).
There's also a cooldown mechanism requiring at least 5 bars between signals to prevent clustering.
Visual Elements
The indicator provides layered visual information:
Adaptive bands with color-coded centerline (green/red/yellow based on slope)
Cloud fill between bands, colored by trend direction
Signal arrows (triangles) at entry points
Price labels showing exact entry price at each signal
Divergence lines connecting the pivot points that form the divergence pattern
Divergence labels ("REG BULL", "HID BEAR", etc.) with tooltips explaining what each pattern means
Info panel showing current status of all indicators and any active divergences
The Info Panel
The top-right panel displays real-time status for all the indicator components. Each row is color-coded to show whether that factor is currently bullish, bearish, or neutral. The last two rows specifically track whether regular and hidden divergences are currently active, making it easy to see at a glance if a divergence pattern has recently formed.
Alert System
The indicator includes a comprehensive alert system covering not just buy/sell signals, but also "setup building" conditions (when RSI and Fisher are at extremes but ADX hasn't confirmed yet), market regime changes (trending to ranging and vice versa), and individual divergence detections for all four types.
Summary
This indicator is designed for traders who want to catch reversals at price extremes with multiple layers of confirmation. Its strength lies in the divergence detection system, which identifies both potential reversals and trend continuation setups. The modular filter system lets users dial in their preferred level of strictness — from the default configuration that requires just the core filters, to a highly selective mode requiring trend alignment, volume confirmation, and divergence all at once. It's best suited for swing trading or identifying key turning points on higher timeframes.

Grok/Claude AI Neural Fusion Pro * Grok/Claude X SeriesGrok/Claude AI Neural Fusion Pro
This is a TradingView indicator that combines multiple technical analysis methods into a unified scoring system to identify trading opportunities. Despite the "Neural" and "AI" branding, it's not actually using machine learning — it's a sophisticated blend of traditional indicators weighted together to produce a single decision-aiding score.
Core Philosophy
The indicator attempts to answer the question: "How bullish or bearish is the current market environment, and when should I consider entering a trade?"
It does this by calculating a "GXS Score" (ranging from -1 to +1) that aggregates five different market dimensions: trend strength, momentum, volume, price structure, and price action quality. Each dimension contributes to the final score based on user-defined weights.
The Dynamic Bands System
Rather than using standard Bollinger Bands, this indicator creates adaptive bands that expand and contract based on market conditions. The bands are built around a midpoint calculated from Heikin Ashi candles (smoothed price bars that filter out noise), then extended outward using ATR (Average True Range) multiplied by a dynamic factor.
What makes these bands "dynamic" is that the multiplier adjusts based on two factors: the Chaikin Oscillator (which measures buying/selling pressure through accumulation/distribution) and ADX (trend strength). When there's strong directional pressure or a powerful trend, the bands widen to accommodate larger price swings. In quieter markets, they tighten.
The Five Scoring Components
The GXS Score is built from five weighted components:
ComponentDefault WeightWhat It MeasuresTrend Strength30%ADX direction and magnitude — is there a real trend, and which way?Momentum25%RSI, MACD, Stochastic, CCI, Rate of Change, plus divergence detectionVolume20%On-Balance Volume slope and whether volume confirms price movementPrice Structure15%Where price sits within the bands, plus volatility regimePrice Action10%Ratio of bullish vs bearish candles over recent bars
Trend Strength Component
This component only contributes to the score when ADX indicates a trending market (above the threshold, default 24). If DI+ exceeds DI-, the score tilts bullish; if DI- dominates, it tilts bearish. In ranging markets, this component essentially zeros out, preventing false trend signals during choppy conditions.
Momentum Component
This is the most complex component, combining six sub-indicators. RSI is normalized around the 50 level. MACD histogram is standardized against its own volatility. Stochastic and CCI contribute bonus points at extreme levels (oversold/overbought). Rate of Change adds directional bias for strong moves. Finally, divergence detection looks for situations where price makes new highs/lows but RSI doesn't confirm — a classic reversal warning.
Volume Component
The indicator tracks On-Balance Volume (a cumulative measure of buying vs selling pressure) and compares it to its moving average. When OBV is rising above its average during an uptrend, that's confirmation. The volume rate of change also contributes — surging volume adds conviction to signals.
Price Structure Component
This measures where the current price sits within the dynamic bands. If price is in the bottom 20% of the band range, that's bullish (potential bounce zone). If it's in the top 20%, that's bearish (potential resistance). The component also factors in volatility regime — low volatility environments get a slight bullish bias (breakouts tend to follow compression), while high volatility gets a bearish bias (exhaustion risk).
Price Action Component
A simple measure of recent candle character. If 70%+ of the last 10 candles were bullish (closed higher than they opened), the score tilts positive. Heavy bearish candle dominance tilts it negative.
Signal Generation
Buy and sell signals are generated when price touches or breaches the dynamic bands, but only if several filters pass:
ADX Filter (optional): Requires the market to be trending, avoiding signals in choppy conditions
RSI Filter (optional): For buys, RSI must be oversold (below 30); for sells, RSI must be overbought (above 70)
Cooldown Period: Prevents signal spam by requiring a minimum number of bars between signals (default 6)
The indicator also tracks "zones" based purely on the GXS Score. When the score exceeds the buy threshold (default 0.12) during a trending market, a green cloud appears between the bands. When it drops below the sell threshold (default -0.12), a red cloud appears. These zones indicate favorable conditions even without a specific band-touch signal.
Trend Strength Meter
Separate from the GXS Score, the indicator calculates a "Trend Strength" percentage (0-100%) displayed in the info table. This combines ADX strength (40% weight), slope consistency (30% — how steady is the price direction), volume alignment (20% — is volume confirming the move), and momentum agreement (10% — are multiple indicators pointing the same direction). This helps traders gauge how reliable the current trend is.
Visual Elements
The indicator provides multiple visual layers that can be toggled on or off:
Dynamic bands (blue midline, red upper, green lower)
Signal clouds between the bands when in buy/sell zones
Background shading indicating bullish (green) or bearish (red) regime
Triangle arrows at signal points with configurable sizes
Price labels showing exact entry prices at signals
ADX strength dots at the bottom (white = weak, orange = moderate, blue = strong)
Info table with current readings for all key metrics
Debug panel (optional) showing individual component scores
Summary
This is essentially a "committee voting" system where multiple technical indicators each cast votes on market direction, and those votes are weighted and summed into a single score. The dynamic bands provide context for where price is relative to recent volatility, while the various filters help avoid low-quality signals. It's designed for traders who want a synthesized view of market conditions rather than watching a dozen separate indicators.
