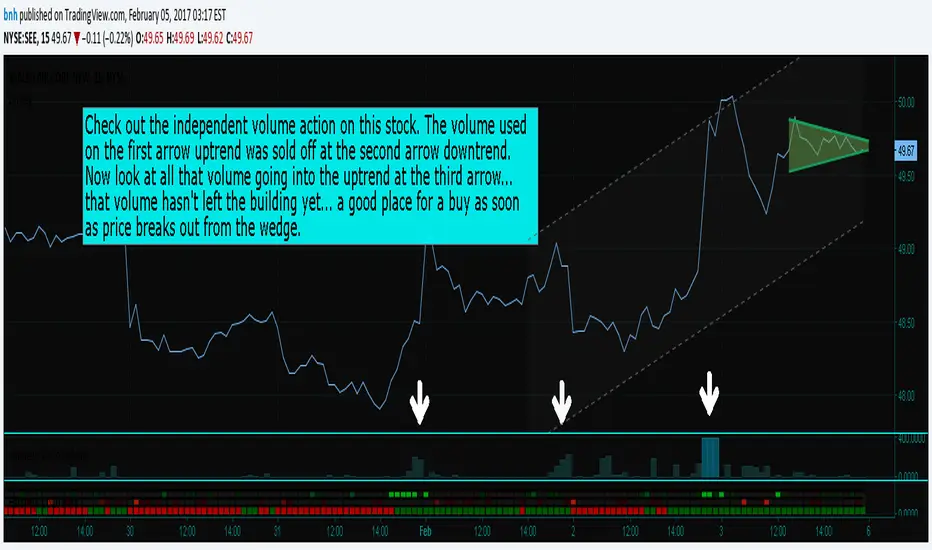
Hersheys CoCo VolumeCoCo Volume shows you volume movement of your symbol after subtracting the movement from another symbol, preferrably the sector or market the stock belongs to.
My latest update to my CoCoVolume Indicator. It calculates today's volume percent over the 60 period average for both your symbol and index, and displays that difference. If the percent is over the max it highlights the color, showing BIG action for that stock.
The last version was calculating the percent volume difference from yesterday to today for the stock and index and displaying the difference. The prior method had large swings on low volume stocks... this one shows the independent volume action much better. The default values will suit most stocks.
You can set three variables...
- the index symbol, default is SPY
- the period for averaging, default is 60
- the max volume percent, default is 500
Good trading!
Brian Hershey
Поиск скриптов по запросу "涨幅超过60日均线的股票"
close-hl2 Price actionStill not tested, but looks very good ; it is the difference between EMA median price and EMA close in different time frame, I used 240, 60, and the current Time frame ,plus one more customed period ; can forcast the price movement , but it s not in scale, so it can not show how much higher or lower the price can goes but just the next direction. I think intraday on 5 ,15 ,60 better then high frame.If you need to try on Daily frame have to change the period to higher then Daily

Everyday 0002 _ MAC 1st Trading Hour WalkoverThis is the second strategy for my Everyday project.
Like I wrote the last time - my goal is to create a new strategy everyday
for the rest of 2016 and post it here on TradingView.
I'm a complete beginner so this is my way of learning about coding strategies.
I'll give myself between 15 minutes and 2 hours to complete each creation.
This is basically a repetition of the first strategy I wrote - a Moving Average Crossover,
but I added a tiny thing.
I read that "Statistics have proven that the daily high or low is established within the first hour of trading on more than 70% of the time."
(source: )
My first Moving Average Crossover strategy, tested on VOLVB daily, got stoped out by the volatility
and because of this missed one nice bull run and a very nice bear run.
So I added this single line: if time("60", "1000-1600") regarding when to take exits:
if time("60", "1000-1600")
strategy.exit("Close Long", "Long", profit=2000, loss=500)
strategy.exit("Close Short", "Short", profit=2000, loss=500)
Sweden is UTC+2 so I guess UTC 1000 equals 12.00 in Stockholm. Not sure if this is correct, actually.
Anyway, I hope this means the strategy will only take exits based on price action which occur in the afternoon, when there is a higher probability of a lower volatility.
When I ran the new modified strategy on the same VOLVB daily it didn't get stoped out so easily.
On the other hand I'll have to test this on various stocks .
Reading and learning about how to properly test strategies is on my todo list - all tips on youtube videos or blogs
to read on this topic is very welcome!
Like I said the last time, I'm posting these strategies hoping to learn from the community - so any feedback, advice, or corrections is very much welcome and appreciated!
/pbergden

RSI Median DeviationRSI Median Deviation – Adaptive Statistical RSI for High-Probability Extremes
The Relative Strength Index (RSI) is a momentum oscillator developed by J. Welles Wilder in 1978 to measure the magnitude of recent price changes and identify potential overbought or oversold conditions. It calculates the ratio of upward to downward price movements over a specified period, scaled to 0-100. However, standard RSI often relies on fixed thresholds like 70/30, which can produce unreliable signals in varying market regimes due to their lack of adaptability to the actual distribution of RSI values.
This indicator was developed because I needed a reliable tool for spotting intermediate high-probability bottoms and tops. Instead of arbitrary horizontal lines, it uses the RSI’s own historical median as a dynamic centerline and measures how far the current RSI deviates from that median over a chosen lookback period. The main signals are triggered only at 2 standard deviation (2σ) extremes — statistically rare events that occur roughly 5 % of the time under a normal distribution. I selected 2σ because it is extreme enough to be meaningful yet frequent enough for practical trading. For oversold signals I further require RSI to be below 42, a filter that significantly improved results in my mean-reversion tests (enter on oversold, exit on the first bar the condition is no longer true).
The combination of percentile median + standard deviation bands is deliberate: the median is far more robust to outliers than a simple average, while the SD bands automatically adjust to the current volatility of the RSI itself, producing adaptive envelopes that work equally well in ranging and trending markets.
Underlying Concepts and Calculations
Base RSI: RSI = 100 − (100 / (1 + RS)), RS = average gain / average loss (default length 10).
Percentile Median: 50th percentile of the last "N" RSI values (default 28 = 4 weeks)
→ dynamic, outlier-resistant centerline.
Standard Deviation Bands: rolling stdev of RSI (default length 27 = = 4 weeks (almost))
→ bands = median ± 1σ / 2σ.
Optional Dynamic MA Envelopes: user-selectable moving average (TEMA, WMA, etc., default WMA length 37) for additional momentum context.
Trend Bias Coloring
Independent of the statistical extremes, the RSI line itself is colored green when above the user-defined Long Threshold (default 60) and red when below the Short Threshold (default 47). This provides an instant bullish/bearish bias overlay similar to classic RSI usage, without interfering with the main 2σ extreme signals.
Extremes are highlighted with background color (green for oversold 2σ + RSI<42, magenta for overbought 2σ) and small diamond markers for ultra-extremes (RSI <25 or >85).
Originality and Development Rationale
The indicator was built and refined through extensive testing on dozens of assets including major cryptocurrencies:
(BTC, ETH, SOL, SUI, BNB, XRP, TRX, DOGE, LINK, PAXG, CVX, HYPE, VIRTUAL and many more),
the Magnificent 7 stocks,, QQQ, SPX, and gold.
Default parameters were chosen to deliver consistent profitability in simple mean-reversion setups while maximizing Sortino ratio and minimizing maximum drawdown across this broad universe — ensuring the settings are robust and not overfitted to any single instrument or timeframe.
How to Use It
Ideal for swing / position trading on the 1h to daily charts (the same defaults work).
Oversold (high-probability long): RSI crosses below lower 2σ band AND RSI < 42
→ green background
→ enter long, exit the first bar the condition disappears.
Overbought (high-probability short): RSI crosses above upper 2σ band
→ magenta background
→ enter short, exit on opposite signal or at median. (Shorts were not tested, it's only an idea)
Use the green/red RSI line coloring for quick trend context and to avoid fighting strong momentum.
Always confirm with price action and manage risk appropriately.
This indicator is not a standalone trading system.
Disclaimer: This is not financial advice. Backtests are based on past results and are not indicative of future performance.

FF calculation Saptarshi ChatterjeeForward factor (in options contexts) measures implied volatility (IV) for a future period between two expirations, like from 30 DTE (days to expiry) front-month to 60 DTE back-month options.
This indicator calculates the FORWARD FACTOR(FF) using 2 IVs of 2 DTEs.
+ve value means front DTE is rich in premium and back expiry is cheap.
-ve value means front DTE IV is cheap and 2nd DTE is expensive
we can use this term structure disbalance to trade calendar spreads with edge.

Trend Following $ZEC - Multi-Timeframe Structure Filter + Revers# Trend Following CRYPTOCAP:ZEC - Strategy Guide
## 📊 Strategy Overview
Trend Following CRYPTOCAP:ZEC is an enhanced Turtle Trading system designed for cryptocurrency spot trading, combining Donchian Channel breakouts, multi-timeframe structure filtering, and ATR-based dynamic risk management for both long and short positions.
---
## 🎯 Core Features
1. Multi-Timeframe Structure Filtering
- Uses Swing High/Low to identify market structure
- Customizable structure timeframe (default: 1 minute)
- Only enters trades in the direction of the trend, avoiding counter-trend positions
2. Reverse Signal Exit
- No fixed stop-loss or fixed-period exits
- Exits only when a reverse entry signal triggers
- Maximizes trend profits, reduces premature exits
3. ATR Dynamic Pyramiding
- Adds positions when price moves 0.5 ATR in favorable direction
- Supports up to 2 units maximum (adjustable)
- Pyramid scaling to enhance profitability
4. Complete Risk Management
- Fixed position size (5000 USD per unit)
- Commission fee 0.06% (Binance spot rate)
- Initial capital 10,000 USD
---
## 📈 Trading Logic
Entry Conditions
✅ Long Entry:
- Close price breaks above 20-period high
- Structure trend is bullish (price breaks above Swing High)
✅ Short Entry:
- Close price breaks below 20-period low
- Structure trend is bearish (price breaks below Swing Low)
Add Position Conditions
- Long: Price rises ≥ 0.5 ATR
- Short: Price falls ≥ 0.5 ATR
- Maximum 2 units including initial entry
Exit Conditions
- Long Exit: When short entry signal triggers (price breaks 20-period low + structure turns bearish)
- Short Exit: When long entry signal triggers (price breaks 20-period high + structure turns bullish)
---
## ⚙️ Parameter Settings
Channel Settings
- Entry Channel Period: 20 (Donchian Channel breakout period)
- Exit Channel Period: 10 (reserved parameter, actually uses reverse signal exit)
ATR Settings
- ATR Period: 20
- Stop Loss ATR Multiplier: 2.0 (reserved parameter)
- Add Position ATR Multiplier: 0.5
Structure Filter
- Swing Length: 160 (Swing High/Low calculation period)
- Structure Timeframe: 1 minute (can change to 5/15/60, etc.)
Position Management
- Maximum Units: 2 (including initial entry)
- Capital Per Unit: 5000 USD
---
## 🎨 Visualization Features
Background Colors
- Light Green: Bullish structure
- Light Red: Bearish structure
- Dark Green: Long entry
- Dark Red: Short entry
Optional Display (Default: OFF)
- Entry/exit channel lines
- Structure high/low lines
- ATR stop-loss line
- Next add position indicator
- Entry/exit labels
---
## 📱 Alert Message Format
Strategy sends notifications on entry/exit with the following format:
- Entry: `1m Long EP:428.26`
- Add Position: `15m Add Long 2/2 EP:429.50`
- Exit: `1m Close Long Reverse Signal`
Where:
- `1m`/`15m` = Current chart timeframe
- `EP` = Entry Price
---
## 💰 Backtest Settings
Capital Allocation
- Initial Capital: 10,000 USD
- Per Entry: 5,000 USD (split into 2 entries)
- Leverage: 0x (spot trading)
Trading Costs
- Commission: 0.06% (Binance spot VIP0)
- Slippage: 0
---
## 🎯 Use Cases
✅ Best Scenarios
- Trending markets
- Moderate volatility assets
- 1-minute to 4-hour timeframes
⚠️ Not Suitable For
- Highly volatile choppy markets
- Low liquidity small-cap coins
- Extreme market conditions (black swan events)
---
## 📊 Usage Recommendations
Timeframe Suggestions
| Timeframe | Trading Style | Suggested Parameter Adjustment |
|-----------|--------------|-------------------------------|
| 1-5 min | Scalping | Swing Length 100-160 |
| 15-30 min | Short-term | Swing Length 50-100 |
| 1-4 hour | Swing Trading | Swing Length 20-50 |
Optimization Tips
1. Adjust swing length based on backtest results
2. Different coins may require different parameters
3. Recommend backtesting on 1-minute chart first before live trading
4. Enable labels to observe entry/exit points
---
## ⚠️ Risk Disclaimer
1. Past Performance Does Not Guarantee Future Results
- Backtest data is for reference only
- Live trading may be affected by slippage, delays, etc.
2. Market Condition Changes
- Strategy performs better in trending markets
- May experience frequent stops in ranging markets
3. Capital Management
- Do not invest more than you can afford to lose
- Recommend setting total capital stop-loss threshold
4. Commission Impact
- Frequent trading accumulates commission fees
- Recommend using exchange discounts (BNB fee reduction, etc.)
---
## 🔧 Troubleshooting
Q: No entry signals?
A: Check if structure filter is too strict, adjust swing length or timeframe
Q: Too many labels displayed?
A: Turn off "Show Labels" option in settings
Q: Poor backtest performance?
A:
1. Check if the coin is suitable for trend-following strategies
2. Adjust parameters (swing length, channel period)
3. Try different timeframes
Q: How to set alerts?
A:
1. Click "Alert" in top-right corner of chart
2. Condition: Select "Strategy - Trend Following CRYPTOCAP:ZEC "
3. Choose "Order filled"
4. Set notification method (Webhook/Email/App)
---
## 📞 Contact Information
Strategy Name: Trend Following CRYPTOCAP:ZEC
Version: v1.0
Pine Script Version: v6
Last Updated: December 2025
---
## 📄 Copyright Notice
This strategy is for educational and research purposes only.
All risks of using this strategy for live trading are borne by the user.
Commercial use without authorization is prohibited.
---
## 🎓 Learning Resources
To understand the strategy principles in depth, recommended reading:
- "The Complete TurtleTrader" - Curtis Faith
- "Trend Following" - Michael Covel
- TradingView Pine Script Official Documentation
---
Happy Trading! Remember to manage your risk 📈

RSI Swing Indicator (Win-Rate + Forecast Line + Range Row)What the script does:
It’s essentially an enhanced RSI tool that doesn’t just show the raw RSI line. Instead, it adds forecasting, trade statistics, and range detection so you can see how reliable RSI signals have been historically and what they might mean going forward.
The main components
RSI Calculation
- Uses your chosen source (close, hl2, etc.) and length (default 7).
- Plots the RSI line (orange).
Forecasting
- Projects RSI into the future using slope extrapolation.
- Plots a forecast line (blue) and shows whether RSI is likely to become overbought, oversold, or stay neutral.
Trade Statistics
- Tracks how many long and short trades would have been profitable based on RSI bias.
- Calculates Win‑Rate (percentage of profitable trades) and Average Return (average gain/loss per trade).
- This gives you a statistical edge: are longs or shorts historically working better?
Bias & Conflict Detection
- Defines current bias (Bullish, Bearish, Neutral).
- Flags Conflict when the forecast disagrees with the current bias (e.g., RSI bullish now but forecast bearish).
- Helps you avoid trading against weakening momentum.
Range Detection
- Checks if RSI slope is flat and values are between mid‑bounds (40–60).
- Calculates Range Probability (how often range conditions occur).
- Adds a Range row to the table so you know when the market is likely sideways instead of trending.
Table Display
- Summarizes everything in a neat table: Forecast, Win‑Rates, Avg Returns, Prob Bias, Conflict, Range Prob, and Range status.
- Color‑coded so you can instantly see what’s favorable (green), risky (red), or neutral (yellow/orange).
How to use it
- Trend trading: Look for Profitable Bias with forecast alignment.
- Range trading: When both win‑rates are weak and Range row says Range Likely, fade extremes (buy low RSI, sell high RSI).
- Risk management: Avoid trades when Conflict is flagged.
- Forecasting: Use the projected RSI to anticipate overbought/oversold zones before they happen.
In short:
The script is like a “smart RSI dashboard”. It takes the basic RSI, adds forecasting, tracks how well past trades worked, and tells you whether the market is trending or ranging. This way, you’re not just reacting to RSI — you’re trading with context, probabilities, and forward‑looking signals.

SNIPER ORB V2# 🎯 SNIPER ORB TRADING CHEAT SHEET
## Quick Reference Guide for Live Trading
---
## 📊 VISUAL IDENTIFICATION GUIDE
```
═══════════════════════════════════════════════════════════════════
YOUR CHART AT A GLANCE
═══════════════════════════════════════════════════════════════════
🔵 BRIGHT BLUE LINES (3px) → 5min ORB High/Low
🔷 CYAN LINES (2px) → 15min ORB High/Low
🟣 PURPLE LINES (2px) → 30min ORB High/Low (PRIMARY)
🟢 GREEN DASHED LINES (1px) → Upside targets (1x, 2x, 3x from 30min ORB)
🔴 RED DASHED LINES (1px) → Downside targets (1x, 2x, 3x from 30min ORB)
🟡 GOLD LINE (2px) → Anchored VWAP (9:30 AM anchor for NY, 3:00 AM for London)
📋 INFO TABLE (top-right) → Shows live ORB ranges, VWAP price, status
═══════════════════════════════════════════════════════════════════
```
**KEY DIFFERENCE FROM OTHER ORB INDICATORS:**
- You see **ALL 3 ORB PERIODS SIMULTANEOUSLY** (5min, 15min, 30min)
- Targets calculated from **30min ORB ONLY** (not 5min or 15min)
- **NO BOX FILLS** - clean line-only display for sniper precision
- Auto-disappears at session end (no clutter from old sessions)
---
## 🔘 NEW FEATURE: ORB DISPLAY TOGGLES
**You now have FULL CONTROL over which ORB periods to display!**
```
In indicator settings → "ORB Display" section:
☑ Show 5min ORB → Toggle blue lines ON/OFF
☑ Show 15min ORB → Toggle cyan lines ON/OFF
☑ Show 30min ORB → Toggle purple lines ON/OFF
USE CASES:
━━━━━━━━━━━━━━━━━━━━━━━━━━━━━━━━━━━━━━━━━━━━━━━
1. FOCUS MODE (30min only)
☐ 5min ☐ 15min ☑ 30min
→ Clean chart, just your primary trading range
→ Best for beginners or minimalist traders
2. EARLY WARNING MODE (5min + 30min)
☑ 5min ☐ 15min ☑ 30min
→ See early breaks with 5min, trade 30min confirmation
→ Reduces visual noise from 15min
3. CONFLUENCE MODE (all 3 ORBs)
☑ 5min ☑ 15min ☑ 30min
→ Maximum information, all alignment signals
→ For advanced traders seeking highest probability
4. INTRADAY SCALP MODE (5min only)
☑ 5min ☐ 15min ☐ 30min
→ Ultra-fast entries on 5min breaks
→ High-risk, high-frequency approach
━━━━━━━━━━━━━━━━━━━━━━━━━━━━━━━━━━━━━━━━━━━━━━━
💡 PRO TIP: Start with 30min only, then add 5min/15min as you gain experience
```
---
## 🎯 FIXED: ANCHORED VWAP (TIMESTAMP-BASED)
**The VWAP now anchors with SURGICAL PRECISION to the exact session start candle!**
```
LONDON SESSION:
• Anchors at the EXACT 3:00 AM ET candle
• Uses timestamp checking: hour == 3 AND minute == 0
• Resets every morning at London Open
NEW YORK SESSION:
• Anchors at the EXACT 9:30 AM ET candle
• Uses timestamp checking: hour == 9 AND minute == 30
• Resets every day at NY Open
WHAT THIS MEANS:
✅ VWAP starts accumulating from the first tick of the session
✅ No more "off by one bar" errors
✅ Institutional-grade VWAP anchoring
✅ Perfect alignment with your ORB start times
HOW TO VERIFY IT'S WORKING:
1. Load indicator on 1min or 5min chart
2. Find the exact 9:30 AM candle (NY) or 3:00 AM candle (London)
3. VWAP should START appearing from that exact bar
4. Not the bar before, not the bar after - THAT EXACT BAR
```
---
## ⏰ SESSION TIMING MATRIX
| Session | Start Time | 5min Complete | 15min Complete | 30min Complete | Session End |
|---------|-----------|---------------|----------------|----------------|-------------|
| **London** | 3:00 AM ET | 3:05 AM | 3:15 AM | 3:30 AM | 9:30 AM ET (disappears) |
| **New York** | 9:30 AM ET | 9:35 AM | 9:45 AM | 10:00 AM | 5:00 PM ET (disappears) |
**💡 GOLDEN RULES:**
1. **WAIT FOR 30MIN ORB TO COMPLETE** before trading targets (10:00 AM NY / 3:30 AM London)
2. Use 5min and 15min ORBs as **early warning signals** only
3. All ORB lines + VWAP **auto-delete** at session end (clean chart)
---
## 🎯 THE 3-ORB SYSTEM: HOW IT WORKS
### **Hierarchical ORB Structure**
```
TIME: 9:30 AM ─────────────────────────────────> 10:00 AM ──────> 5:00 PM
↓ ↓
SESSION START 30min ORB COMPLETE
(all 3 ORBs begin forming) (targets appear)
📍 5min ORB (9:30-9:35 AM): ━━━━━━━━━━━━━━━━━━━━━━━━━━━━━━━━━━━━━>
Purpose: EARLY breakout signal, fastest-moving boundary
📍 15min ORB (9:30-9:45 AM): ━━━━━━━━━━━━━━━━━━━━━━━━━━━━━━━━━━━━━>
Purpose: MID-TERM institutional reference level
📍 30min ORB (9:30-10:00 AM): ━━━━━━━━━━━━━━━━━━━━━━━━━━━━━━━━━━━━━>
Purpose: PRIMARY TRADING RANGE - all targets calculated from this
🎯 TARGETS (10:00 AM onward): ▪ ▪ ▪ ▪ ▪ (1x, 2x, 3x from 30min ORB)
Purpose: Profit-taking levels based on 30min range
```
**Why 3 ORBs Instead of 1?**
- **5min ORB**: Captures early institutional positioning (first 5 minutes)
- **15min ORB**: Confirms directional bias (more stable than 5min)
- **30min ORB**: Full market digestion of overnight news + opening orders
- **Confluence = Higher Win Rate**: When all 3 align, breakouts are extremely reliable
---
## 🎯 THE 5 HIGH-PROBABILITY SETUPS
### **SETUP #1: TRIPLE ORB BREAKOUT CONFLUENCE** ⭐⭐⭐⭐⭐
```
CONDITIONS:
✅ 30min ORB complete (10:00 AM NY / 3:30 AM London)
✅ Price breaks ALL 3 ORBs simultaneously:
• 5min high/low (blue line)
• 15min high/low (cyan line)
• 30min high/low (purple line)
✅ VWAP confirms direction (below price = bullish, above = bearish)
✅ Volume spike on breakout candle
ENTRY: Close of breakout candle (must close beyond ALL 3 ORBs)
STOP: Inside 30min ORB at 30m low (long) or 30m high (short)
TARGET 1: First green/red dashed line (0.5x 30m range)
TARGET 2: Second target (1x 30m range)
TARGET 3: Third target (1.5x 30m range)
WIN RATE: 75-85% | R:R = 1:2.5 minimum
NOTES: When all 3 ORBs align, institutional order flow is unanimous
```
---
### **SETUP #2: 5MIN EARLY BREAKOUT → 30MIN CONFIRMATION** ⭐⭐⭐⭐
```
CONDITIONS:
✅ Price breaks 5min ORB first (blue line crossed)
✅ 15min ORB holds initially (cyan line not crossed yet)
✅ After 30min ORB completes, price breaks 30min boundary (purple)
✅ VWAP alignment confirms direction
✅ All 3 ORBs now broken in same direction
ENTRY: When 30min ORB breaks (purple line) + 5min/15min already broken
STOP: 30min ORB opposite boundary
TARGET 1-3: Standard targets from 30min ORB
WIN RATE: 70-80% | R:R = 1:2+
NOTES: 5min gave early warning, 30min confirms institutional commitment
```
---
### **SETUP #3: FALSE 5MIN BREAKOUT → 30MIN REVERSAL** ⭐⭐⭐⭐⭐
```
CONDITIONS:
✅ Price breaks 5min ORB (blue line)
✅ Fails to break 15min or 30min ORBs (cyan/purple lines hold)
✅ Price reverses back inside 5min ORB
✅ Then breaks OPPOSITE side of 30min ORB (purple line)
✅ VWAP flips to confirm new direction
ENTRY: When 30min ORB breaks in OPPOSITE direction of failed 5min break
STOP: Failed 5min breakout high/low (now a liquidity grab zone)
TARGET 1-3: Standard targets
WIN RATE: 80-90% | R:R = 1:3+ (trapped traders forced to exit)
NOTES: Most profitable setup - 5min breakout was liquidity hunt
```
---
### **SETUP #4: TIGHT COMPRESSION → EXPLOSION** ⭐⭐⭐⭐
```
CONDITIONS:
✅ All 3 ORBs tightly overlapping (5m, 15m, 30m within 50 points on YM)
✅ Range < 0.3% of price (very tight consolidation)
✅ VWAP sitting in middle of compression
✅ 30min ORB complete, price still inside all 3
ENTRY: Simultaneous break of ALL 3 ORBs + VWAP cross
STOP: Middle of compression zone
TARGET: 2x-4x normal targets (volatility expansion)
WIN RATE: 65-75% | R:R = 1:5+ (explosive breakout)
NOTES: Low volatility → high volatility shift, institutions coiling spring
```
---
### **SETUP #5: VWAP BOUNCE WITHIN 30MIN ORB** ⭐⭐⭐⭐
```
CONDITIONS:
✅ Price stayed inside 30min ORB for 1+ hours post-formation
✅ VWAP acting as dynamic support (long) or resistance (short)
✅ Price bouncing between VWAP and 30min ORB boundaries
✅ Clear rejection candles at VWAP
ENTRY: When price bounces off VWAP toward 30min ORB boundary
• Long: VWAP bounce up toward 30m high (purple)
• Short: VWAP rejection down toward 30m low (purple)
STOP: Beyond VWAP by 20 points
TARGET: 30min ORB opposite boundary
WIN RATE: 70-80% | R:R = 1:1.5-2
NOTES: Range-bound play, NOT for breakout traders
```
---
## 🛡️ RISK MANAGEMENT RULES
### **Position Sizing by ORB Range**
```
30min ORB Range | Stop Distance | Risk $500 (1%) | YM Contracts
-----------------|------------------|-----------------|-------------
< 50 points | 50 pts | $500 ÷ $250 = | 2 contracts
50-100 points | 100 pts | $500 ÷ $500 = | 1 contract
100-150 points | 150 pts | $500 ÷ $750 = | 0.66 (use 1)
150-200 points | 200 pts | $500 ÷ $1000 = | 0.5 (use 1)
> 200 points | Don't trade | Too wide | Skip setup
Formula: Risk $ ÷ (Stop Distance × $5 per YM point) = Max Contracts
```
### **The 3-Strike Rule (MANDATORY)**
```
✅ Trade 1: Full position size (based on 30m ORB range)
❌ Stop hit → Trade 2: HALF position size
❌ Stop hit → Trade 3: QUARTER position size
❌ Stop hit → DONE FOR THE DAY (no exceptions)
```
### **Profit Taking Ladder**
```
TARGET 1 (0.5x 30m range): Take 50% off, move stop to breakeven
TARGET 2 (1.0x 30m range): Take 30% off, trail stop by 25 points
TARGET 3 (1.5x 30m range): Take 15% off, let 5% run with 50pt trail
```
---
## ⚠️ DO NOT TRADE IF...
```
🚫 30min ORB incomplete (< 10:00 AM NY / < 3:30 AM London)
🚫 30min ORB range < 40 points YM (too tight, likely chop)
🚫 30min ORB range > 250 points YM (too wide, unpredictable)
🚫 All 3 ORBs wildly divergent (5m=100pts, 15m=180pts, 30m=240pts)
🚫 Major news release within 30 minutes (wait for ORB to reform)
🚫 You've hit 3 losses in the session (3-strike rule)
🚫 You're tired, emotional, revenge trading, or distracted
🚫 Time > 12:00 PM ET (lunch, avoid until 1:00 PM)
🚫 Time > 3:00 PM ET unless Power Hour (3:00-4:00 PM) momentum
```
---
## 🔍 PRE-SESSION CHECKLIST
**15 Minutes Before London (2:45 AM ET) or NY (9:15 AM ET):**
```
□ Check economic calendar (FOMC? NFP? CPI? → extra caution)
□ Review previous session's ORB ranges (context for today's volatility)
□ Load SNIPER ORB on 1min or 5min chart
□ Select correct session: "London" or "New York"
□ Verify indicator settings:
• Number of Targets: 3
• Target % of 30min Range: 50%
• Show Anchored VWAP: ON
□ Set TradingView alerts:
• 30min ORB complete (10:00 AM or 3:30 AM)
• Price crossing 30min high/low
• VWAP crosses
□ Prepare bracket orders mentally (entry, stop, 3 targets)
□ Review yesterday's P&L and lessons learned
□ Set phone to "Do Not Disturb" mode
```
---
## 🎨 INDICATOR SETTINGS GUIDE
### **Core Settings (Updated with Toggles)**
```
SESSION SETTINGS:
━━━━━━━━━━━━━━━━━━━━━━━━━━━━━━━━━━━━━━━━
• Active Session: "London" or "New York"
ORB DISPLAY (NEW!):
━━━━━━━━━━━━━━━━━━━━━━━━━━━━━━━━━━━━━━━━
☑ Show 5min ORB (toggle blue lines)
☑ Show 15min ORB (toggle cyan lines)
☑ Show 30min ORB (toggle purple lines)
💡 Turn OFF any ORB to declutter your chart!
TARGET SETTINGS:
━━━━━━━━━━━━━━━━━━━━━━━━━━━━━━━━━━━━━━━━
• Number of Targets: 3 (default)
• Target % of 30min Range: 50% (default)
VWAP SETTINGS:
━━━━━━━━━━━━━━━━━━━━━━━━━━━━━━━━━━━━━━━━
☑ Show Anchored VWAP
• VWAP Color: Gold (#FFC107)
• VWAP Width: 2px
```
### **Color Customization (Optimized for Dark Charts)**
```
DEFAULT COLORS:
━━━━━━━━━━━━━━━━━━━━━━━━━━━━━━━━━━━━━━━━
5min ORB: Bright Blue (#2196F3) - 3px wide
15min ORB: Cyan (#00BCD4) - 2px wide
30min ORB: Purple (#9C27B0) - 2px wide
Upside Targets: Green (#4CAF50) - 1px dashed
Downside Targets: Red (#F44336) - 1px dashed
VWAP: Gold (#FFC107) - 2px solid
━━━━━━━━━━━━━━━━━━━━━━━━━━━━━━━━━━━━━━━━
WHY THESE COLORS?
• Blue family (5m/15m) = short-term, high-frequency
• Purple (30m) = primary, institutional level
• Green/Red = universal up/down
• Gold VWAP = fair value anchor (stands out)
```
### **Settings by Trading Style**
**BEGINNER (Clean & Simple):**
```
ORB Display:
☐ Show 5min ORB
☐ Show 15min ORB
☑ Show 30min ORB (30min only - focus mode)
Number of Targets: 2-3
Target % of 30min Range: 50%
Chart Timeframe: 5-minute
```
**SCALPER (5-15 min holds):**
```
ORB Display:
☑ Show 5min ORB (early signals)
☐ Show 15min ORB
☑ Show 30min ORB (confirmation)
Number of Targets: 5
Target % of 30min Range: 30-40%
Label Size: Tiny
Chart Timeframe: 1-minute
```
**DAY TRADER (30-90 min holds):**
```
ORB Display:
☑ Show 5min ORB
☑ Show 15min ORB
☑ Show 30min ORB (all 3 - confluence mode)
Number of Targets: 3
Target % of 30min Range: 50%
Label Size: Small
Chart Timeframe: 5-minute (RECOMMENDED)
```
**SWING TRADER (2-4 hour holds):**
```
ORB Display:
☐ Show 5min ORB (too noisy for swings)
☑ Show 15min ORB
☑ Show 30min ORB
Number of Targets: 2-3
Target % of 30min Range: 75-100%
Label Size: Normal
Chart Timeframe: 15-minute
```
---
## 📈 TIMEFRAME SELECTION GUIDE
| Your Timeframe | What You See | Best For |
|---------------|--------------|----------|
| **1-minute** | Every tick, high noise | Scalping, precision entries |
| **5-minute** | Balanced clarity | Day trading (RECOMMENDED) |
| **15-minute** | Clean structure | Swing positions |
| **30-minute** | Too compressed | Not recommended (can't see ORB form) |
**💡 PRO TIP:**
- **Primary chart: 5-minute** (for entries and monitoring)
- **Secondary chart: 1-minute** (for precise timing)
- **Never go above 15-minute** (ORBs won't form properly)
---
## 🧠 READING THE 3-ORB STRUCTURE
### **Bullish Alignment Patterns**
```
PATTERN 1: "Staircase Expansion"
5min: ━━━━ (tight, 60 pts)
15min: ━━━━━━ (wider, 90 pts)
30min: ━━━━━━━━ (widest, 120 pts)
→ Bullish expansion, expect upside breakout
PATTERN 2: "Nested Compression"
5min: ━━ (30 pts)
15min: ━━━ (35 pts)
30min: ━━━━ (40 pts)
→ All tight, explosive breakout likely
PATTERN 3: "Early Commitment"
5min: ━━━━━━ (100 pts, already broken up)
15min: ━━━━━ (80 pts, holding)
30min: ━━━━━ (110 pts, about to break)
→ 5min led the way, 30min confirmation coming
```
### **Bearish Alignment Patterns**
```
PATTERN 1: "Waterfall Setup"
5min: ━━━━ (50 pts, broke down)
15min: ━━━━━ (70 pts, broke down)
30min: ━━━━━━ (90 pts, about to break)
→ Sequential breakdown, strong bearish momentum
PATTERN 2: "Failed Highs"
5min: ━━━━━━ (upper wick rejections)
15min: ━━━━━━ (couldn't break)
30min: ━━━━━━━ (topped out)
→ All 3 rejecting highs, bearish reversal likely
```
### **Neutral/Chop Patterns (AVOID TRADING)**
```
PATTERN 1: "Wide Divergence"
5min: ━━ (30 pts)
15min: ━━━━━━━ (120 pts)
30min: ━━━━━━━━━━━ (200 pts)
→ No consensus, unpredictable, skip
PATTERN 2: "Whipsaw City"
• Price breaking 5min up, then down, then up again
• 15min and 30min not aligned
• VWAP getting crossed every 5 minutes
→ Chop day, step aside, wait for clarity
```
---
## 📊 INTEGRATION WITH YM ULTIMATE SNIPER v8.1
**The 2-System Confluence Method:**
```
┌─────────────────────────────────────────────────────────────┐
│ STEP 1: SNIPER ORB → Defines "Zones That Matter" │
│ • 30min ORB = primary institutional range │
│ • VWAP = fair value anchor │
│ • Targets = profit zones │
│ • 5min/15min = early warning signals │
└─────────────────────────────────────────────────────────────┘
↓
┌─────────────────────────────────────────────────────────────┐
│ STEP 2: YM ULTIMATE SNIPER → Triggers precise entry │
│ • Wait for GOD MODE signal AT 30min ORB boundary │
│ • 6-gate filter: Score ≥9, fat body ≥70%, delta ≥70% │
│ • Candle Dominance Index (CDI) ≥7 │
│ • Intrabar pressure consistent throughout formation │
└─────────────────────────────────────────────────────────────┘
↓
┌─────────────────────────────────────────────────────────────┐
│ STEP 3: EXECUTE TRADE │
│ • ORB breakout + GOD MODE = MAXIMUM PROBABILITY │
│ • Enter ONLY when BOTH systems align │
│ • This is TRUE "sniper" trading (2-5 trades/day max) │
└─────────────────────────────────────────────────────────────┘
```
**Confluence Scoring for Combined System:**
```
SNIPER ORB Criteria:
□ 30min ORB complete (10:00 AM+) +2 points
□ All 3 ORBs broken in same direction +2 points
□ VWAP alignment (below=bull, above=bear) +1 point
□ Volume spike on breakout candle +1 point
□ Tight 3-ORB compression (<100pt divergence) +1 point
YM ULTIMATE SNIPER Criteria:
□ GOD MODE signal at ORB boundary +3 points
□ Score ≥9.0 (tier classification) +1 point
□ Candle Dominance Index (CDI) ≥8 +1 point
TOTAL POSSIBLE: 12 points
TRADE EXECUTION RULES:
• 10-12 points = MAX SIZE (this is the holy grail setup)
• 8-9 points = FULL SIZE (high probability)
• 6-7 points = HALF SIZE (moderate probability)
• <6 points = NO TRADE (wait for better alignment)
```
---
## 💡 COMMON MISTAKES & FIXES
```
❌ MISTAKE: Trading before 30min ORB completes
✅ FIX: Wait until 10:00 AM (NY) or 3:30 AM (London), NO EXCEPTIONS
❌ MISTAKE: Ignoring 5min and 15min ORBs (only watching 30min)
✅ FIX: Use all 3 for confluence - they're your early warning system
❌ MISTAKE: Chasing breakouts 100+ points beyond 30min ORB
✅ FIX: Wait for pullback to VWAP or 30min boundary for re-entry
❌ MISTAKE: Not adjusting target % for market conditions
✅ FIX: Volatile day (ORB >200pts)? Use 75-100% targets
Calm day (ORB <80pts)? Use 30-40% targets
❌ MISTAKE: Trading when all 3 ORBs are wildly different sizes
✅ FIX: Skip the day if 5m/15m/30m diverge by >100pts - no consensus
❌ MISTAKE: Forgetting VWAP position
✅ FIX: VWAP MUST confirm bias:
• Long: price > VWAP
• Short: price < VWAP
• If VWAP contradicts, skip the trade
❌ MISTAKE: Not respecting the 3-strike rule
✅ FIX: 3 losses = DONE for the session, no rationalization
❌ MISTAKE: Trading during lunch (12:00-1:00 PM ET)
✅ FIX: Volume dies, ORBs lose relevance, false signals increase
```
---
## 🔔 ALERT SETUP (ESSENTIAL)
**TradingView Alerts You MUST Set:**
```
ALERT 1: "30min ORB Complete"
• Type: Time-based
• Trigger: 10:00 AM ET (NY) or 3:30 AM ET (London)
• Message: "🎯 30min ORB complete - targets now active"
ALERT 2: "30min ORB High Breakout"
• Type: Crossing Up
• Value 1: Close
• Value 2: 30min ORB High (purple line)
• Message: "🚀 30m ORB HIGH broken - check for long setup"
ALERT 3: "30min ORB Low Breakdown"
• Type: Crossing Down
• Value 1: Close
• Value 2: 30min ORB Low (purple line)
• Message: "📉 30m ORB LOW broken - check for short setup"
ALERT 4: "VWAP Cross"
• Type: Crossing
• Value 1: Close
• Value 2: VWAP
• Message: "⚡ VWAP crossed - check institutional bias shift"
ALERT 5: "Target 1 Hit"
• Type: Crossing
• Value 1: High (for longs) or Low (for shorts)
• Value 2: First target line
• Message: "🎯 Target 1 hit - take 50% off, move stop to BE"
```
---
## 📱 MOBILE TRADING WORKFLOW
**TradingView Mobile App Setup:**
```
1. SAVE LAYOUT
• Chart: 5-minute timeframe
• SNIPER ORB indicator loaded
• YM Ultimate SNIPER v8.1 loaded (if using)
• Save as "SNIPER ORB - YM"
2. ENABLE NOTIFICATIONS
• Settings → Notifications → Push Alerts: ON
• All 5 alerts above configured
3. QUICK ACCESS
• Add YM futures to Watchlist: "MYM" or "YM1!"
• Pin SNIPER ORB layout to favorites
4. EXECUTION READY
• Broker app (TastyTrade, NinjaTrader, etc.) logged in
• Preset bracket orders:
- Entry: market order
- Stop: 30m ORB opposite boundary
- Targets: 3 levels (50%, 30%, 20% of position)
5. BATTERY & CONNECTIVITY
• Phone charged 100% before session
• Stable WiFi or LTE connection
• Backup power bank available
```
---
## 🎓 DAILY PERFORMANCE JOURNAL
**After Each Trading Session (MANDATORY):**
```
═══════════════════════════════════════════════════════════════
DATE: __________ SESSION: □ London □ New York
═══════════════════════════════════════════════════════════════
ORB DATA:
• 5min ORB Range: ______ points
• 15min ORB Range: ______ points
• 30min ORB Range: ______ points
• Alignment: □ Tight □ Moderate □ Wide (skip if wide)
VWAP BEHAVIOR:
• Opening position: □ Above price □ Below price □ Mixed
• Did VWAP act as support/resistance? □ Yes □ No
TRADES TAKEN:
Total Setups Identified: _____
Trades Executed: _____
Win/Loss Record: _____ W / _____ L
Win Rate: _____%
Gross P&L: $_______
Net P&L (after commissions): $_______
BEST TRADE:
• Setup: ____________________ (which of the 5 setups?)
• Entry Price: ______ Exit Price: ______
• Profit: $_______
• What went RIGHT: _________________________________
_________________________________________________
WORST TRADE:
• Setup: ____________________
• Entry Price: ______ Exit Price: ______
• Loss: $_______
• What went WRONG: _________________________________
_________________________________________________
• Lesson Learned: ___________________________________
3-STRIKE RULE STATUS:
□ No losses (great day)
□ 1 loss (still in game)
□ 2 losses (caution, half size)
□ 3 losses (stopped for day, as required)
TOMORROW'S ADJUSTMENTS:
□ _________________________________________________
□ _________________________________________________
□ _________________________________________________
EMOTIONAL STATE TODAY:
□ Calm & focused (optimal)
□ Anxious/rushed (need to work on patience)
□ Overconfident (dial back position size)
□ Fearful (review winning trades to build confidence)
═══════════════════════════════════════════════════════════════
```
---
## 🚀 YOUR FIRST LIVE TRADE WALKTHROUGH
**Step-by-Step for New York Session (Most Common):**
```
⏰ 9:15 AM ET - PREPARATION
□ Load SNIPER ORB on YM 5-minute chart
□ Select "New York" session in indicator settings
□ Verify VWAP is showing (gold line)
□ Check economic calendar (any big news at 9:30?)
□ Prepare mentally: "I will wait for 30min ORB to complete"
⏰ 9:30 AM ET - SESSION OPENS
□ Watch 3 ORBs begin forming:
• Blue lines (5min) will lock in at 9:35 AM
• Cyan lines (15min) will lock in at 9:45 AM
• Purple lines (30min) will lock in at 10:00 AM
□ Observe VWAP anchoring at 9:30 AM candle
□ DO NOT TRADE YET - just observe
⏰ 9:35 AM - 5MIN ORB COMPLETE
□ Note 5min high/low (blue lines locked)
□ Check info table: "5m Range = XX points"
□ If 5min ORB breaks early, note direction but DON'T ENTER
⏰ 9:45 AM - 15MIN ORB COMPLETE
□ Note 15min high/low (cyan lines locked)
□ Compare to 5min ORB: Aligned? Expanding?
□ Still waiting... patience pays
⏰ 10:00 AM - 30MIN ORB COMPLETE (TARGETS APPEAR!)
□ Purple lines locked (30m high/low)
□ Green/red dashed target lines appear automatically
□ Info table shows "Status: ✓ Complete"
□ NOW you can trade breakouts
⏰ 10:00 AM - 11:30 AM - TRADING WINDOW
□ Wait for price to break purple line (30m ORB high or low)
□ Confirm:
1. All 3 ORBs broken in same direction?
2. VWAP confirming (below=bullish, above=bearish)?
3. Volume spike visible?
4. YM SNIPER GOD MODE signal? (if using)
□ If all YES → ENTER TRADE:
• Market order at breakout close
• Stop at 30m ORB opposite boundary
• Targets at green/red dashed lines
⏰ TARGET MANAGEMENT
□ Price hits first target (1x) → Take 50% off, move stop to BE
□ Price hits second target (2x) → Take 30% off, trail stop
□ Price hits third target (3x) → Take 15% off, let 5% run
⏰ 12:00 PM - LUNCH (AVOID TRADING)
□ Volume dies down
□ ORBs become less relevant
□ Take a break, review morning trades
⏰ 1:00 PM - 3:00 PM - AFTERNOON SESSION
□ ORBs still valid but less reliable
□ Consider waiting for Power Hour (3:00-4:00 PM)
⏰ 5:00 PM - SESSION END
□ All ORB lines disappear automatically
□ VWAP disappears automatically
□ Chart cleans itself - ready for tomorrow
□ Fill out daily journal
```
---
## 🏆 WINNING MINDSET AFFIRMATIONS
Read these BEFORE each trading session:
```
"I trade ORBs, not chaos. Structure gives me edge."
"3 high-quality trades beat 20 mediocre ones."
"The 30min ORB is my anchor. I wait for it. Every. Single. Time."
"When all 3 ORBs align, institutions are unified. I follow."
"VWAP is my institutional compass. I respect its guidance."
"3 strikes and I'm out. Discipline > Ego."
"I am a SNIPER, not a machine gunner. Precision wins."
"My edge is patience. Let the ORBs complete."
"I don't predict. I react to proven structure."
"One perfect setup is worth waiting all morning."
```
---
## 📞 TROUBLESHOOTING
**"ORB lines not showing on chart!"**
→ Check timeframe: Must be 1min-30min (not daily/weekly)
→ Verify session time: Must be during London (3AM-9:30AM) or NY (9:30AM-5PM)
→ Check indicator status: Should say "⏳ Forming" or "✓ Complete" in table
**"Targets not appearing!"**
→ 30min ORB must be complete (10:00 AM NY / 3:30 AM London)
→ Check "Number of Targets" setting (must be ≥1)
→ Verify "Target % of 30min Range" is set (default 50%)
**"VWAP disappeared!"**
→ Normal behavior: VWAP auto-deletes at session end (5PM NY / 9:30AM London)
→ Toggle "Show Anchored VWAP" OFF then ON to reset
→ Check if you're viewing chart outside session hours
**"All 3 ORBs look the same!"**
→ This is actually GOOD - means tight alignment (high-probability setup)
→ If they're diverging wildly (>100pts difference), that's a skip signal
**"Info table blocking my view!"**
→ Info table is in top-right corner by default
→ Drag it to a different position (TradingView allows moving)
→ Or minimize it by clicking the small arrow
**"Colors are hard to see on my chart!"**
→ Go to indicator settings:
• "5min ORB", "15min ORB", "30min ORB" color pickers
• "Upside Targets", "Downside Targets" color pickers
• Recommended: Use contrasting colors vs your chart background
---
## 📚 ADVANCED INTEGRATION TECHNIQUES
### **Combining with Market Profile**
```
• Use Volume Profile to identify Value Area High (VAH) and Low (VAL)
• If 30min ORB aligns with VAH/VAL → extra confluence
• POC (Point of Control) acts similar to VWAP
```
### **Combining with Cumulative Delta**
```
• Check if delta is positive on 30min ORB high break (bullish confirmation)
• Negative delta on low break confirms bearish institutional flow
• Your YM SNIPER already tracks this - use together!
```
### **Combining with Options Flow**
```
• Large call buying near 30min ORB high? Institutions positioning for breakout
• Large put buying near 30min ORB low? Smart money hedging/shorting
• Tools: Unusual Whales, Cheddar Flow, OptionStrat
```
---
## 🎯 FINAL PRE-LIVE CHECKLIST
**DO NOT GO LIVE UNTIL ALL CHECKED:**
```
□ Practiced on TradingView Replay for 2+ weeks
□ Can identify all 5 setups by pattern recognition
□ Understand why targets come from 30min ORB only
□ Know difference between 5min/15min/30min roles
□ Risk management rules memorized (position sizing, 3-strike)
□ YM Ultimate SNIPER v8.1 loaded (optional but recommended)
□ All 5 TradingView alerts configured
□ Broker platform tested with demo account
□ Stop/target orders can be placed in <10 seconds
□ Daily journal template prepared
□ Emotional state: calm, patient, focused
□ Account size: Minimum $10,000 recommended
□ Understand auto-disappear behavior (ORBs delete at session end)
□ Know NOT to trade before 30min ORB complete
□ Comfortable with looking at chart and seeing 6+ lines (3 ORBs + targets)
IF ALL CHECKED → YOU'RE READY TO SNIPE! 🎯
IF ANY UNCHECKED → KEEP PRACTICING, DON'T RUSH
```
---
## 💎 THE CORE PRINCIPLE
```
╔═══════════════════════════════════════════════════════════╗
║ ║
║ "The ORB doesn't predict the market. ║
║ The ORB reveals where institutions are positioned. ║
║ ║
║ When you see all 3 ORBs align and break, ║
║ you're not guessing direction— ║
║ you're following the billion-dollar order flow." ║
║ ║
║ THAT'S YOUR EDGE. ║
║ ║
╚═══════════════════════════════════════════════════════════╝
```
**🎯 Good luck, stay patient, and happy sniping! 🎯**
═══════════════════════════════════════════════════════════════════
END OF SNIPER ORB TRADING CHEAT SHEET v1.0
═══════════════════════════════════════════════════════════════════

CRR Bill Williams These are SMMA based on the average price (high+low/2):
Jaw – Blue
Slow line, the base of the trend.
Teeth – Red
Medium speed.
Lips – Green/Lime
The fast one, the one that touches the price first.
Trend reading with the Alligator:
🟢 Uptrend (trendUpAlligator):
Lips (green) > Teeth (red) > Jaw (blue)
The alligator is awake and eating UP.
🔴 Downtrend (trendDownAlligator):
Lips (green) < Teeth (red) < Jaw (blue)
The alligator is eating DOWN.
⚪ Range / sleeping market (trendNeutral):
The lines cross, get tangled, without a clear order → better NOT to trade aggressively there.
In the HUD it shows it as:
UPTREND (green)
DOWNTREND (red)
RANGE (gray)
2️⃣ Fractals (▲ and ▼ arrows)
Fractal High (▲ green): possible local top (resistance).
Fractal Low (▼ red): possible local bottom (support).
They serve as:
Points where the price can break through to continue.
Areas where you can place stop losses or breakouts.
3️⃣ AO and AC (trend strength)
AO (Awesome Oscillator): difference of moving averages (5 and 34 of the average price).
AO > 0 → bullish pressure.
AO < 0 → bearish pressure.
AC (Accelerator): AO – average of AO.
AC > 0 → acceleration in favor of the movement.
AC < 0 → the movement slows down or goes against the trend.
In the HUD you see:
AO > 0 | AC > 0 → good tailwind.
AO < 0 | AC < 0 → strong headwind. 4️⃣ Bill Williams MFI (GREEN, FADE, FAKE, SQUAT)
This MFI is based on the candle range/volume and then compares it to the previous candle:
GREEN (Lime) → mfiUp + volUp
Price and volume rise together → real, strong momentum.
FADE (Gray) → mfiDown + volDown
Everything is dying down, price and volume fall → exhaustion.
FAKE (Orange) → mfiUp + volDown
Price rises but volume falls → deceptive movement.
SQUAT (Fuchsia) → mfiDown + volUp
Strong fight between buyers and sellers → explosive zone.
The color you see in the "MFI" HUD is:
Green → healthy momentum
Gray → fading out
Orange → deception
Fuchsia → strong fight, a big move may be coming
5️⃣ Candle Colors (barcolor)
Your script paints the candles like this:
💚 StrongBull (strong buying)
Bullish Alligator (Lips > Teeth > Jaw)
AO > 0
AC > 0
MFI = "GREEN"
→ Bright LIME candle:
👉 strong upward trend, ideal time to look for buying opportunities.
❤️ StrongBear (strong selling)
Bearish Alligator (Lips < Teeth < Jaw)
AO < 0
AC < 0
MFI = "GREEN"
→ Strong RED candle:
👉 strong downward trend, ideal for looking for selling opportunities.
🩵 Normal bullish trend:
Bullish Alligator but without all the strength conditions → TEAL (bluish-green) candle.
🟥 Normal bearish trend:
Bearish Alligator but without full strength → MAROON candle.
⚪ Sideways market:
Everything mixed → translucent GRAY candle (color.gray 60).
👉 Not the best time to enter aggressively. 6️⃣ BUY / SELL Signals (triangles)
✔️ BUY Condition (longSignalCond)
The code requires:
Bullish Alligator → Lips > Teeth > Jaw
AO > 0
AC > 0
MFI = GREEN or SQUAT
close > Lips (green lips) → the price is already above the fast moving average.
When fulfilled:
A green “BUY” triangle appears below the candle.
In the HUD:
Trend: BULLISH (green)
AO / AC: > 0
MFI: GREEN or SQUAT
BW Setup: “SIGNAL: BUY”
Context: “Buying Pressure”
👉 Idea for making money (buys):
Wait for the Alligator to be in a bullish order.
Check that the HUD says BULLISH and AO/AC > 0.
Check MFI: GREEN or SQUAT.
As soon as the BUY triangle appears and the candle is lime/teal, you can:
Enter a buy position.
Place the stop loss below the last fractal low (▼).
Close partially when:
MFI changes to FADE/FAKE or
The candles change to gray/maroon or
The Alligator becomes entangled (loses its order).
❌ SELL Condition (shortSignalCond)
The code requires:
Bearish Alligator → Lips < Teeth < Jaw
AO < 0
AC < 0
MFI = GREEN or SQUAT (strength but downwards)
close < Lips → price below the lips.
When fulfilled:
A red “SELL” triangle appears above the candle.
In the HUD:
Trend: BEARISH
AO / AC: < 0
MFI: GREEN / SQUAT
BW Setup: “SIGNAL: SELL”
Context: “Selling Pressure”
👉 Idea for making money (sells):
Wait for the Alligator to be in a bearish order.
HUD in BEARISH, AO/AC < 0.
MFI in GREEN or SQUAT.
When the SELL triangle appears with a red/maroon candle:
Enter a sell position. Stop above the last fractal high (▲).
Partial exit when:
MFI changes to FADE/FAKE,
The candles turn gray/teal,
Or the Alligator becomes tangled.
7️⃣ When NOT to trade
Avoid:
HUD → “RANGE”
Mostly gray candles.
AO and AC mixed (one >0 and the other <0).
MFI constantly in FAKE/FADE.
In these situations, the system tells you: slow or deceptive market → not suitable for serious trades.
8️⃣ Ultra-short summary (golden rule)
BUY:
Alligator ordered UP (green > red > blue).
AO > 0 and AC > 0.
MFI = GREEN or SQUAT.
Strong green candle (lime/teal) + BUY triangle.
Even better if it breaks a previous fractal low upwards.
SELL:
Alligator ordered DOWN (green < red < blue).
AO < 0 and AC < 0.
MFI = GREEN or SQUAT.
Red/maroon candle + SELL triangle.
Even better if it breaks a fractal high downwards.

SNIPER ORB v1# 🎯 SNIPER ORB TRADING CHEAT SHEET
## Quick Reference Guide for Live Trading
---
## 📊 VISUAL IDENTIFICATION GUIDE
```
═══════════════════════════════════════════════════════════════════
YOUR CHART AT A GLANCE
═══════════════════════════════════════════════════════════════════
🔵 BRIGHT BLUE LINES (3px) → 5min ORB High/Low
🔷 CYAN LINES (2px) → 15min ORB High/Low
🟣 PURPLE LINES (2px) → 30min ORB High/Low (PRIMARY)
🟢 GREEN DASHED LINES (1px) → Upside targets (1x, 2x, 3x from 30min ORB)
🔴 RED DASHED LINES (1px) → Downside targets (1x, 2x, 3x from 30min ORB)
🟡 GOLD LINE (2px) → Anchored VWAP (9:30 AM anchor for NY, 3:00 AM for London)
📋 INFO TABLE (top-right) → Shows live ORB ranges, VWAP price, status
═══════════════════════════════════════════════════════════════════
```
**KEY DIFFERENCE FROM OTHER ORB INDICATORS:**
- You see **ALL 3 ORB PERIODS SIMULTANEOUSLY** (5min, 15min, 30min)
- Targets calculated from **30min ORB ONLY** (not 5min or 15min)
- **NO BOX FILLS** - clean line-only display for sniper precision
- Auto-disappears at session end (no clutter from old sessions)
---
## ⏰ SESSION TIMING MATRIX
| Session | Start Time | 5min Complete | 15min Complete | 30min Complete | Session End |
|---------|-----------|---------------|----------------|----------------|-------------|
| **London** | 3:00 AM ET | 3:05 AM | 3:15 AM | 3:30 AM | 9:30 AM ET (disappears) |
| **New York** | 9:30 AM ET | 9:35 AM | 9:45 AM | 10:00 AM | 5:00 PM ET (disappears) |
**💡 GOLDEN RULES:**
1. **WAIT FOR 30MIN ORB TO COMPLETE** before trading targets (10:00 AM NY / 3:30 AM London)
2. Use 5min and 15min ORBs as **early warning signals** only
3. All ORB lines + VWAP **auto-delete** at session end (clean chart)
---
## 🎯 THE 3-ORB SYSTEM: HOW IT WORKS
### **Hierarchical ORB Structure**
```
TIME: 9:30 AM ─────────────────────────────────> 10:00 AM ──────> 5:00 PM
↓ ↓
SESSION START 30min ORB COMPLETE
(all 3 ORBs begin forming) (targets appear)
📍 5min ORB (9:30-9:35 AM): ━━━━━━━━━━━━━━━━━━━━━━━━━━━━━━━━━━━━━>
Purpose: EARLY breakout signal, fastest-moving boundary
📍 15min ORB (9:30-9:45 AM): ━━━━━━━━━━━━━━━━━━━━━━━━━━━━━━━━━━━━━>
Purpose: MID-TERM institutional reference level
📍 30min ORB (9:30-10:00 AM): ━━━━━━━━━━━━━━━━━━━━━━━━━━━━━━━━━━━━━>
Purpose: PRIMARY TRADING RANGE - all targets calculated from this
🎯 TARGETS (10:00 AM onward): ▪ ▪ ▪ ▪ ▪ (1x, 2x, 3x from 30min ORB)
Purpose: Profit-taking levels based on 30min range
```
**Why 3 ORBs Instead of 1?**
- **5min ORB**: Captures early institutional positioning (first 5 minutes)
- **15min ORB**: Confirms directional bias (more stable than 5min)
- **30min ORB**: Full market digestion of overnight news + opening orders
- **Confluence = Higher Win Rate**: When all 3 align, breakouts are extremely reliable
---
## 🎯 THE 5 HIGH-PROBABILITY SETUPS
### **SETUP #1: TRIPLE ORB BREAKOUT CONFLUENCE** ⭐⭐⭐⭐⭐
```
CONDITIONS:
✅ 30min ORB complete (10:00 AM NY / 3:30 AM London)
✅ Price breaks ALL 3 ORBs simultaneously:
• 5min high/low (blue line)
• 15min high/low (cyan line)
• 30min high/low (purple line)
✅ VWAP confirms direction (below price = bullish, above = bearish)
✅ Volume spike on breakout candle
ENTRY: Close of breakout candle (must close beyond ALL 3 ORBs)
STOP: Inside 30min ORB at 30m low (long) or 30m high (short)
TARGET 1: First green/red dashed line (0.5x 30m range)
TARGET 2: Second target (1x 30m range)
TARGET 3: Third target (1.5x 30m range)
WIN RATE: 75-85% | R:R = 1:2.5 minimum
NOTES: When all 3 ORBs align, institutional order flow is unanimous
```
---
### **SETUP #2: 5MIN EARLY BREAKOUT → 30MIN CONFIRMATION** ⭐⭐⭐⭐
```
CONDITIONS:
✅ Price breaks 5min ORB first (blue line crossed)
✅ 15min ORB holds initially (cyan line not crossed yet)
✅ After 30min ORB completes, price breaks 30min boundary (purple)
✅ VWAP alignment confirms direction
✅ All 3 ORBs now broken in same direction
ENTRY: When 30min ORB breaks (purple line) + 5min/15min already broken
STOP: 30min ORB opposite boundary
TARGET 1-3: Standard targets from 30min ORB
WIN RATE: 70-80% | R:R = 1:2+
NOTES: 5min gave early warning, 30min confirms institutional commitment
```
---
### **SETUP #3: FALSE 5MIN BREAKOUT → 30MIN REVERSAL** ⭐⭐⭐⭐⭐
```
CONDITIONS:
✅ Price breaks 5min ORB (blue line)
✅ Fails to break 15min or 30min ORBs (cyan/purple lines hold)
✅ Price reverses back inside 5min ORB
✅ Then breaks OPPOSITE side of 30min ORB (purple line)
✅ VWAP flips to confirm new direction
ENTRY: When 30min ORB breaks in OPPOSITE direction of failed 5min break
STOP: Failed 5min breakout high/low (now a liquidity grab zone)
TARGET 1-3: Standard targets
WIN RATE: 80-90% | R:R = 1:3+ (trapped traders forced to exit)
NOTES: Most profitable setup - 5min breakout was liquidity hunt
```
---
### **SETUP #4: TIGHT COMPRESSION → EXPLOSION** ⭐⭐⭐⭐
```
CONDITIONS:
✅ All 3 ORBs tightly overlapping (5m, 15m, 30m within 50 points on YM)
✅ Range < 0.3% of price (very tight consolidation)
✅ VWAP sitting in middle of compression
✅ 30min ORB complete, price still inside all 3
ENTRY: Simultaneous break of ALL 3 ORBs + VWAP cross
STOP: Middle of compression zone
TARGET: 2x-4x normal targets (volatility expansion)
WIN RATE: 65-75% | R:R = 1:5+ (explosive breakout)
NOTES: Low volatility → high volatility shift, institutions coiling spring
```
---
### **SETUP #5: VWAP BOUNCE WITHIN 30MIN ORB** ⭐⭐⭐⭐
```
CONDITIONS:
✅ Price stayed inside 30min ORB for 1+ hours post-formation
✅ VWAP acting as dynamic support (long) or resistance (short)
✅ Price bouncing between VWAP and 30min ORB boundaries
✅ Clear rejection candles at VWAP
ENTRY: When price bounces off VWAP toward 30min ORB boundary
• Long: VWAP bounce up toward 30m high (purple)
• Short: VWAP rejection down toward 30m low (purple)
STOP: Beyond VWAP by 20 points
TARGET: 30min ORB opposite boundary
WIN RATE: 70-80% | R:R = 1:1.5-2
NOTES: Range-bound play, NOT for breakout traders
```
---
## 🛡️ RISK MANAGEMENT RULES
### **Position Sizing by ORB Range**
```
30min ORB Range | Stop Distance | Risk $500 (1%) | YM Contracts
-----------------|------------------|-----------------|-------------
< 50 points | 50 pts | $500 ÷ $250 = | 2 contracts
50-100 points | 100 pts | $500 ÷ $500 = | 1 contract
100-150 points | 150 pts | $500 ÷ $750 = | 0.66 (use 1)
150-200 points | 200 pts | $500 ÷ $1000 = | 0.5 (use 1)
> 200 points | Don't trade | Too wide | Skip setup
Formula: Risk $ ÷ (Stop Distance × $5 per YM point) = Max Contracts
```
### **The 3-Strike Rule (MANDATORY)**
```
✅ Trade 1: Full position size (based on 30m ORB range)
❌ Stop hit → Trade 2: HALF position size
❌ Stop hit → Trade 3: QUARTER position size
❌ Stop hit → DONE FOR THE DAY (no exceptions)
```
### **Profit Taking Ladder**
```
TARGET 1 (0.5x 30m range): Take 50% off, move stop to breakeven
TARGET 2 (1.0x 30m range): Take 30% off, trail stop by 25 points
TARGET 3 (1.5x 30m range): Take 15% off, let 5% run with 50pt trail
```
---
## ⚠️ DO NOT TRADE IF...
```
🚫 30min ORB incomplete (< 10:00 AM NY / < 3:30 AM London)
🚫 30min ORB range < 40 points YM (too tight, likely chop)
🚫 30min ORB range > 250 points YM (too wide, unpredictable)
🚫 All 3 ORBs wildly divergent (5m=100pts, 15m=180pts, 30m=240pts)
🚫 Major news release within 30 minutes (wait for ORB to reform)
🚫 You've hit 3 losses in the session (3-strike rule)
🚫 You're tired, emotional, revenge trading, or distracted
🚫 Time > 12:00 PM ET (lunch, avoid until 1:00 PM)
🚫 Time > 3:00 PM ET unless Power Hour (3:00-4:00 PM) momentum
```
---
## 🔍 PRE-SESSION CHECKLIST
**15 Minutes Before London (2:45 AM ET) or NY (9:15 AM ET):**
```
□ Check economic calendar (FOMC? NFP? CPI? → extra caution)
□ Review previous session's ORB ranges (context for today's volatility)
□ Load SNIPER ORB on 1min or 5min chart
□ Select correct session: "London" or "New York"
□ Verify indicator settings:
• Number of Targets: 3
• Target % of 30min Range: 50%
• Show Anchored VWAP: ON
□ Set TradingView alerts:
• 30min ORB complete (10:00 AM or 3:30 AM)
• Price crossing 30min high/low
• VWAP crosses
□ Prepare bracket orders mentally (entry, stop, 3 targets)
□ Review yesterday's P&L and lessons learned
□ Set phone to "Do Not Disturb" mode
```
---
## 🎨 INDICATOR SETTINGS GUIDE
### **Color Customization (Optimized for Dark Charts)**
```
DEFAULT COLORS:
━━━━━━━━━━━━━━━━━━━━━━━━━━━━━━━━━━━━━━━━
5min ORB: Bright Blue (#2196F3) - 3px wide
15min ORB: Cyan (#00BCD4) - 2px wide
30min ORB: Purple (#9C27B0) - 2px wide
Upside Targets: Green (#4CAF50) - 1px dashed
Downside Targets: Red (#F44336) - 1px dashed
VWAP: Gold (#FFC107) - 2px solid
━━━━━━━━━━━━━━━━━━━━━━━━━━━━━━━━━━━━━━━━
WHY THESE COLORS?
• Blue family (5m/15m) = short-term, high-frequency
• Purple (30m) = primary, institutional level
• Green/Red = universal up/down
• Gold VWAP = fair value anchor (stands out)
```
### **Settings by Trading Style**
**SCALPER (5-15 min holds):**
```
Number of Targets: 5
Target % of 30min Range: 30-40%
Label Size: Tiny
Chart Timeframe: 1-minute
```
**DAY TRADER (30-90 min holds):**
```
Number of Targets: 3
Target % of 30min Range: 50%
Label Size: Small
Chart Timeframe: 5-minute
```
**SWING TRADER (2-4 hour holds):**
```
Number of Targets: 2-3
Target % of 30min Range: 75-100%
Label Size: Normal
Chart Timeframe: 15-minute
```
---
## 📈 TIMEFRAME SELECTION GUIDE
| Your Timeframe | What You See | Best For |
|---------------|--------------|----------|
| **1-minute** | Every tick, high noise | Scalping, precision entries |
| **5-minute** | Balanced clarity | Day trading (RECOMMENDED) |
| **15-minute** | Clean structure | Swing positions |
| **30-minute** | Too compressed | Not recommended (can't see ORB form) |
**💡 PRO TIP:**
- **Primary chart: 5-minute** (for entries and monitoring)
- **Secondary chart: 1-minute** (for precise timing)
- **Never go above 15-minute** (ORBs won't form properly)
---
## 🧠 READING THE 3-ORB STRUCTURE
### **Bullish Alignment Patterns**
```
PATTERN 1: "Staircase Expansion"
5min: ━━━━ (tight, 60 pts)
15min: ━━━━━━ (wider, 90 pts)
30min: ━━━━━━━━ (widest, 120 pts)
→ Bullish expansion, expect upside breakout
PATTERN 2: "Nested Compression"
5min: ━━ (30 pts)
15min: ━━━ (35 pts)
30min: ━━━━ (40 pts)
→ All tight, explosive breakout likely
PATTERN 3: "Early Commitment"
5min: ━━━━━━ (100 pts, already broken up)
15min: ━━━━━ (80 pts, holding)
30min: ━━━━━ (110 pts, about to break)
→ 5min led the way, 30min confirmation coming
```
### **Bearish Alignment Patterns**
```
PATTERN 1: "Waterfall Setup"
5min: ━━━━ (50 pts, broke down)
15min: ━━━━━ (70 pts, broke down)
30min: ━━━━━━ (90 pts, about to break)
→ Sequential breakdown, strong bearish momentum
PATTERN 2: "Failed Highs"
5min: ━━━━━━ (upper wick rejections)
15min: ━━━━━━ (couldn't break)
30min: ━━━━━━━ (topped out)
→ All 3 rejecting highs, bearish reversal likely
```
### **Neutral/Chop Patterns (AVOID TRADING)**
```
PATTERN 1: "Wide Divergence"
5min: ━━ (30 pts)
15min: ━━━━━━━ (120 pts)
30min: ━━━━━━━━━━━ (200 pts)
→ No consensus, unpredictable, skip
PATTERN 2: "Whipsaw City"
• Price breaking 5min up, then down, then up again
• 15min and 30min not aligned
• VWAP getting crossed every 5 minutes
→ Chop day, step aside, wait for clarity
```
---
## 📊 INTEGRATION WITH YM ULTIMATE SNIPER v8.1
**The 2-System Confluence Method:**
```
┌─────────────────────────────────────────────────────────────┐
│ STEP 1: SNIPER ORB → Defines "Zones That Matter" │
│ • 30min ORB = primary institutional range │
│ • VWAP = fair value anchor │
│ • Targets = profit zones │
│ • 5min/15min = early warning signals │
└─────────────────────────────────────────────────────────────┘
↓
┌─────────────────────────────────────────────────────────────┐
│ STEP 2: YM ULTIMATE SNIPER → Triggers precise entry │
│ • Wait for GOD MODE signal AT 30min ORB boundary │
│ • 6-gate filter: Score ≥9, fat body ≥70%, delta ≥70% │
│ • Candle Dominance Index (CDI) ≥7 │
│ • Intrabar pressure consistent throughout formation │
└─────────────────────────────────────────────────────────────┘
↓
┌─────────────────────────────────────────────────────────────┐
│ STEP 3: EXECUTE TRADE │
│ • ORB breakout + GOD MODE = MAXIMUM PROBABILITY │
│ • Enter ONLY when BOTH systems align │
│ • This is TRUE "sniper" trading (2-5 trades/day max) │
└─────────────────────────────────────────────────────────────┘
```
**Confluence Scoring for Combined System:**
```
SNIPER ORB Criteria:
□ 30min ORB complete (10:00 AM+) +2 points
□ All 3 ORBs broken in same direction +2 points
□ VWAP alignment (below=bull, above=bear) +1 point
□ Volume spike on breakout candle +1 point
□ Tight 3-ORB compression (<100pt divergence) +1 point
YM ULTIMATE SNIPER Criteria:
□ GOD MODE signal at ORB boundary +3 points
□ Score ≥9.0 (tier classification) +1 point
□ Candle Dominance Index (CDI) ≥8 +1 point
TOTAL POSSIBLE: 12 points
TRADE EXECUTION RULES:
• 10-12 points = MAX SIZE (this is the holy grail setup)
• 8-9 points = FULL SIZE (high probability)
• 6-7 points = HALF SIZE (moderate probability)
• <6 points = NO TRADE (wait for better alignment)
```
---
## 💡 COMMON MISTAKES & FIXES
```
❌ MISTAKE: Trading before 30min ORB completes
✅ FIX: Wait until 10:00 AM (NY) or 3:30 AM (London), NO EXCEPTIONS
❌ MISTAKE: Ignoring 5min and 15min ORBs (only watching 30min)
✅ FIX: Use all 3 for confluence - they're your early warning system
❌ MISTAKE: Chasing breakouts 100+ points beyond 30min ORB
✅ FIX: Wait for pullback to VWAP or 30min boundary for re-entry
❌ MISTAKE: Not adjusting target % for market conditions
✅ FIX: Volatile day (ORB >200pts)? Use 75-100% targets
Calm day (ORB <80pts)? Use 30-40% targets
❌ MISTAKE: Trading when all 3 ORBs are wildly different sizes
✅ FIX: Skip the day if 5m/15m/30m diverge by >100pts - no consensus
❌ MISTAKE: Forgetting VWAP position
✅ FIX: VWAP MUST confirm bias:
• Long: price > VWAP
• Short: price < VWAP
• If VWAP contradicts, skip the trade
❌ MISTAKE: Not respecting the 3-strike rule
✅ FIX: 3 losses = DONE for the session, no rationalization
❌ MISTAKE: Trading during lunch (12:00-1:00 PM ET)
✅ FIX: Volume dies, ORBs lose relevance, false signals increase
```
---
## 🔔 ALERT SETUP (ESSENTIAL)
**TradingView Alerts You MUST Set:**
```
ALERT 1: "30min ORB Complete"
• Type: Time-based
• Trigger: 10:00 AM ET (NY) or 3:30 AM ET (London)
• Message: "🎯 30min ORB complete - targets now active"
ALERT 2: "30min ORB High Breakout"
• Type: Crossing Up
• Value 1: Close
• Value 2: 30min ORB High (purple line)
• Message: "🚀 30m ORB HIGH broken - check for long setup"
ALERT 3: "30min ORB Low Breakdown"
• Type: Crossing Down
• Value 1: Close
• Value 2: 30min ORB Low (purple line)
• Message: "📉 30m ORB LOW broken - check for short setup"
ALERT 4: "VWAP Cross"
• Type: Crossing
• Value 1: Close
• Value 2: VWAP
• Message: "⚡ VWAP crossed - check institutional bias shift"
ALERT 5: "Target 1 Hit"
• Type: Crossing
• Value 1: High (for longs) or Low (for shorts)
• Value 2: First target line
• Message: "🎯 Target 1 hit - take 50% off, move stop to BE"
```
---
## 📱 MOBILE TRADING WORKFLOW
**TradingView Mobile App Setup:**
```
1. SAVE LAYOUT
• Chart: 5-minute timeframe
• SNIPER ORB indicator loaded
• YM Ultimate SNIPER v8.1 loaded (if using)
• Save as "SNIPER ORB - YM"
2. ENABLE NOTIFICATIONS
• Settings → Notifications → Push Alerts: ON
• All 5 alerts above configured
3. QUICK ACCESS
• Add YM futures to Watchlist: "MYM" or "YM1!"
• Pin SNIPER ORB layout to favorites
4. EXECUTION READY
• Broker app (TastyTrade, NinjaTrader, etc.) logged in
• Preset bracket orders:
- Entry: market order
- Stop: 30m ORB opposite boundary
- Targets: 3 levels (50%, 30%, 20% of position)
5. BATTERY & CONNECTIVITY
• Phone charged 100% before session
• Stable WiFi or LTE connection
• Backup power bank available
```
---
## 🎓 DAILY PERFORMANCE JOURNAL
**After Each Trading Session (MANDATORY):**
```
═══════════════════════════════════════════════════════════════
DATE: __________ SESSION: □ London □ New York
═══════════════════════════════════════════════════════════════
ORB DATA:
• 5min ORB Range: ______ points
• 15min ORB Range: ______ points
• 30min ORB Range: ______ points
• Alignment: □ Tight □ Moderate □ Wide (skip if wide)
VWAP BEHAVIOR:
• Opening position: □ Above price □ Below price □ Mixed
• Did VWAP act as support/resistance? □ Yes □ No
TRADES TAKEN:
Total Setups Identified: _____
Trades Executed: _____
Win/Loss Record: _____ W / _____ L
Win Rate: _____%
Gross P&L: $_______
Net P&L (after commissions): $_______
BEST TRADE:
• Setup: ____________________ (which of the 5 setups?)
• Entry Price: ______ Exit Price: ______
• Profit: $_______
• What went RIGHT: _________________________________
_________________________________________________
WORST TRADE:
• Setup: ____________________
• Entry Price: ______ Exit Price: ______
• Loss: $_______
• What went WRONG: _________________________________
_________________________________________________
• Lesson Learned: ___________________________________
3-STRIKE RULE STATUS:
□ No losses (great day)
□ 1 loss (still in game)
□ 2 losses (caution, half size)
□ 3 losses (stopped for day, as required)
TOMORROW'S ADJUSTMENTS:
□ _________________________________________________
□ _________________________________________________
□ _________________________________________________
EMOTIONAL STATE TODAY:
□ Calm & focused (optimal)
□ Anxious/rushed (need to work on patience)
□ Overconfident (dial back position size)
□ Fearful (review winning trades to build confidence)
═══════════════════════════════════════════════════════════════
```
---
## 🚀 YOUR FIRST LIVE TRADE WALKTHROUGH
**Step-by-Step for New York Session (Most Common):**
```
⏰ 9:15 AM ET - PREPARATION
□ Load SNIPER ORB on YM 5-minute chart
□ Select "New York" session in indicator settings
□ Verify VWAP is showing (gold line)
□ Check economic calendar (any big news at 9:30?)
□ Prepare mentally: "I will wait for 30min ORB to complete"
⏰ 9:30 AM ET - SESSION OPENS
□ Watch 3 ORBs begin forming:
• Blue lines (5min) will lock in at 9:35 AM
• Cyan lines (15min) will lock in at 9:45 AM
• Purple lines (30min) will lock in at 10:00 AM
□ Observe VWAP anchoring at 9:30 AM candle
□ DO NOT TRADE YET - just observe
⏰ 9:35 AM - 5MIN ORB COMPLETE
□ Note 5min high/low (blue lines locked)
□ Check info table: "5m Range = XX points"
□ If 5min ORB breaks early, note direction but DON'T ENTER
⏰ 9:45 AM - 15MIN ORB COMPLETE
□ Note 15min high/low (cyan lines locked)
□ Compare to 5min ORB: Aligned? Expanding?
□ Still waiting... patience pays
⏰ 10:00 AM - 30MIN ORB COMPLETE (TARGETS APPEAR!)
□ Purple lines locked (30m high/low)
□ Green/red dashed target lines appear automatically
□ Info table shows "Status: ✓ Complete"
□ NOW you can trade breakouts
⏰ 10:00 AM - 11:30 AM - TRADING WINDOW
□ Wait for price to break purple line (30m ORB high or low)
□ Confirm:
1. All 3 ORBs broken in same direction?
2. VWAP confirming (below=bullish, above=bearish)?
3. Volume spike visible?
4. YM SNIPER GOD MODE signal? (if using)
□ If all YES → ENTER TRADE:
• Market order at breakout close
• Stop at 30m ORB opposite boundary
• Targets at green/red dashed lines
⏰ TARGET MANAGEMENT
□ Price hits first target (1x) → Take 50% off, move stop to BE
□ Price hits second target (2x) → Take 30% off, trail stop
□ Price hits third target (3x) → Take 15% off, let 5% run
⏰ 12:00 PM - LUNCH (AVOID TRADING)
□ Volume dies down
□ ORBs become less relevant
□ Take a break, review morning trades
⏰ 1:00 PM - 3:00 PM - AFTERNOON SESSION
□ ORBs still valid but less reliable
□ Consider waiting for Power Hour (3:00-4:00 PM)
⏰ 5:00 PM - SESSION END
□ All ORB lines disappear automatically
□ VWAP disappears automatically
□ Chart cleans itself - ready for tomorrow
□ Fill out daily journal
```
---
## 🏆 WINNING MINDSET AFFIRMATIONS
Read these BEFORE each trading session:
```
"I trade ORBs, not chaos. Structure gives me edge."
"3 high-quality trades beat 20 mediocre ones."
"The 30min ORB is my anchor. I wait for it. Every. Single. Time."
"When all 3 ORBs align, institutions are unified. I follow."
"VWAP is my institutional compass. I respect its guidance."
"3 strikes and I'm out. Discipline > Ego."
"I am a SNIPER, not a machine gunner. Precision wins."
"My edge is patience. Let the ORBs complete."
"I don't predict. I react to proven structure."
"One perfect setup is worth waiting all morning."
```
---
## 📞 TROUBLESHOOTING
**"ORB lines not showing on chart!"**
→ Check timeframe: Must be 1min-30min (not daily/weekly)
→ Verify session time: Must be during London (3AM-9:30AM) or NY (9:30AM-5PM)
→ Check indicator status: Should say "⏳ Forming" or "✓ Complete" in table
**"Targets not appearing!"**
→ 30min ORB must be complete (10:00 AM NY / 3:30 AM London)
→ Check "Number of Targets" setting (must be ≥1)
→ Verify "Target % of 30min Range" is set (default 50%)
**"VWAP disappeared!"**
→ Normal behavior: VWAP auto-deletes at session end (5PM NY / 9:30AM London)
→ Toggle "Show Anchored VWAP" OFF then ON to reset
→ Check if you're viewing chart outside session hours
**"All 3 ORBs look the same!"**
→ This is actually GOOD - means tight alignment (high-probability setup)
→ If they're diverging wildly (>100pts difference), that's a skip signal
**"Info table blocking my view!"**
→ Info table is in top-right corner by default
→ Drag it to a different position (TradingView allows moving)
→ Or minimize it by clicking the small arrow
**"Colors are hard to see on my chart!"**
→ Go to indicator settings:
• "5min ORB", "15min ORB", "30min ORB" color pickers
• "Upside Targets", "Downside Targets" color pickers
• Recommended: Use contrasting colors vs your chart background
---
## 📚 ADVANCED INTEGRATION TECHNIQUES
### **Combining with Market Profile**
```
• Use Volume Profile to identify Value Area High (VAH) and Low (VAL)
• If 30min ORB aligns with VAH/VAL → extra confluence
• POC (Point of Control) acts similar to VWAP
```
### **Combining with Cumulative Delta**
```
• Check if delta is positive on 30min ORB high break (bullish confirmation)
• Negative delta on low break confirms bearish institutional flow
• Your YM SNIPER already tracks this - use together!
```
### **Combining with Options Flow**
```
• Large call buying near 30min ORB high? Institutions positioning for breakout
• Large put buying near 30min ORB low? Smart money hedging/shorting
• Tools: Unusual Whales, Cheddar Flow, OptionStrat
```
---
## 🎯 FINAL PRE-LIVE CHECKLIST
**DO NOT GO LIVE UNTIL ALL CHECKED:**
```
□ Practiced on TradingView Replay for 2+ weeks
□ Can identify all 5 setups by pattern recognition
□ Understand why targets come from 30min ORB only
□ Know difference between 5min/15min/30min roles
□ Risk management rules memorized (position sizing, 3-strike)
□ YM Ultimate SNIPER v8.1 loaded (optional but recommended)
□ All 5 TradingView alerts configured
□ Broker platform tested with demo account
□ Stop/target orders can be placed in <10 seconds
□ Daily journal template prepared
□ Emotional state: calm, patient, focused
□ Account size: Minimum $10,000 recommended
□ Understand auto-disappear behavior (ORBs delete at session end)
□ Know NOT to trade before 30min ORB complete
□ Comfortable with looking at chart and seeing 6+ lines (3 ORBs + targets)
IF ALL CHECKED → YOU'RE READY TO SNIPE! 🎯
IF ANY UNCHECKED → KEEP PRACTICING, DON'T RUSH
```
---
## 💎 THE CORE PRINCIPLE
```
╔═══════════════════════════════════════════════════════════╗
║ ║
║ "The ORB doesn't predict the market. ║
║ The ORB reveals where institutions are positioned. ║
║ ║
║ When you see all 3 ORBs align and break, ║
║ you're not guessing direction— ║
║ you're following the billion-dollar order flow." ║
║ ║
║ THAT'S YOUR EDGE. ║
║ ║
╚═══════════════════════════════════════════════════════════╝
```
**🎯 Good luck, stay patient, and happy sniping! 🎯**
═══════════════════════════════════════════════════════════════════
END OF SNIPER ORB TRADING CHEAT SHEET v1.0
═══════════════════════════════════════════════════════════════════

SNIPER ORB# 🎯 SNIPER ORB TRADING CHEAT SHEET
## Quick Reference Guide for Live Trading
---
## 📊 VISUAL IDENTIFICATION GUIDE
```
═══════════════════════════════════════════════════════════════════
YOUR CHART AT A GLANCE
═══════════════════════════════════════════════════════════════════
🔵 BRIGHT BLUE BOX (5min) → Fastest ORB, early warning signals
🔷 CYAN BOX (15min) → Mid-term institutional reference
🟣 PURPLE BOX (30min) → PRIMARY TRADING RANGE (your base)
🟢 GREEN DASHED LINES → Upside profit targets (long)
🔴 RED DASHED LINES → Downside profit targets (short)
🟡 GOLD LINE (VWAP) → Institutional fair value anchor
═══════════════════════════════════════════════════════════════════
```
---
## ⏰ SESSION TIMING MATRIX
| Session | Start Time | ORB Complete | Breakout Window | End Time |
|---------|-----------|--------------|-----------------|----------|
| **London Open** | 3:00 AM ET | 3:30 AM ET | 3:30-5:00 AM | 9:30 AM ET |
| **New York Open** | 9:30 AM ET | 10:00 AM ET | 10:00-11:30 AM | 5:00 PM ET |
**💡 GOLDEN RULE**: Wait for 30min ORB to **complete** before taking breakout trades!
---
## 🎯 THE 5 HIGH-PROBABILITY SETUPS
### **SETUP #1: CLEAN BREAKOUT** ⭐⭐⭐⭐⭐
```
CONDITIONS:
✅ 30min ORB complete (10:00 AM for NY / 3:30 AM for London)
✅ Price breaks ABOVE purple high (bullish) or BELOW purple low (bearish)
✅ VWAP confirms direction:
• Long: VWAP below price
• Short: VWAP above price
✅ Volume spike on breakout candle
ENTRY: Breakout candle close
STOP: Inside 30min ORB (opposite side)
TARGET 1: First green/red target (0.5x range)
TARGET 2: Second target (1x range)
TARGET 3: Third target (1.5x range)
WIN RATE: 65-75% | R:R = 1:2 minimum
```
---
### **SETUP #2: FALSE BREAKOUT REVERSAL** ⭐⭐⭐⭐⭐
```
CONDITIONS:
✅ Price breaks purple high/low initially
✅ Fails to hold (wick reversal or immediate rejection)
✅ Re-enters 30min ORB zone
✅ VWAP acts as rejection point
✅ Breaks opposite side of 30min ORB
ENTRY: When price breaks opposite ORB boundary
STOP: Original false breakout high/low
TARGET 1: VWAP (quick scalp)
TARGET 2: First opposite target line
WIN RATE: 70-80% | R:R = 1:3+ (trapped traders exit)
NOTES: Most profitable setup - institutions hunting stops
```
---
### **SETUP #3: TRIPLE ORB COMPRESSION** ⭐⭐⭐⭐
```
CONDITIONS:
✅ All 3 ORBs tightly aligned (5min, 15min, 30min overlap)
✅ Range < 0.5% of price (very tight)
✅ VWAP sitting in middle of compression
✅ Multiple candles consolidating inside
ENTRY: Simultaneous break of ALL 3 ORBs
STOP: Middle of compression zone
TARGET: 2x-3x normal targets (explosive move)
WIN RATE: 60-70% | R:R = 1:4+ (volatility expansion)
NOTES: Low volume → high volume shift = institutional play
```
---
### **SETUP #4: VWAP RETEST CONTINUATION** ⭐⭐⭐⭐
```
CONDITIONS:
✅ 30min ORB already broken (trend established)
✅ Price pulls back to VWAP
✅ VWAP acts as dynamic support/resistance
✅ Rejection candle forms at VWAP
ENTRY: Candle closes back in trend direction from VWAP
STOP: 10-15 points beyond VWAP
TARGET: Next target line (1x, 1.5x, 2x)
WIN RATE: 70-75% | R:R = 1:2
NOTES: Safest continuation entry, institutions defending VWAP
```
---
### **SETUP #5: OPENING RANGE FADE** ⭐⭐⭐
```
CONDITIONS:
✅ Price stuck inside 30min ORB for 1+ hours post-formation
✅ Multiple failed attempts to break high or low
✅ VWAP in dead center (neutral)
✅ Decreasing volume
ENTRY: Sell at purple high, buy at purple low (range bound)
STOP: Outside ORB by 20 points
TARGET: Opposite ORB boundary + VWAP
WIN RATE: 55-65% | R:R = 1:1.5
NOTES: Use on slow/choppy days only, exit if breakout starts
```
---
## 🛡️ RISK MANAGEMENT RULES
### **Position Sizing Matrix**
```
Account Size: $50,000 example
Risk Per Trade: 1-2% max
ORB Range | Stop Distance | Position Size (1% risk) | YM Contracts
-------------|---------------|-------------------------|-------------
50 points | 50 points | $500 risk | 1 contract
100 points | 100 points | $500 risk | 1 contract
150 points | 150 points | $500 risk | 1 contract
200 points | 200 points | $500 risk | 1 contract
Formula: Risk $ ÷ (Stop Distance × $5 per point) = Contracts
```
### **The 3-Strike Rule**
```
✅ Strike 1: Full position size
❌ Stop hit → Strike 2: Half position size
❌ Stop hit → Strike 3: 1/4 position size
❌ Stop hit → DONE for the session
```
### **Profit Taking Strategy**
```
TARGET 1 (0.5x): Take 50% off, move stop to breakeven
TARGET 2 (1x): Take 30% off, trail stop 20 points
TARGET 3 (1.5x): Take 15% off, let 5% run to 2x-3x
```
---
## ⚠️ DO NOT TRADE IF...
```
🚫 30min ORB incomplete (wait until 10:00 AM NY / 3:30 AM London)
🚫 ORB range < 30 points YM (too tight, likely fake breakout)
🚫 ORB range > 300 points YM (too wide, unpredictable)
🚫 Major news release within 30 minutes
🚫 You've hit 3 losses in the session (walk away)
🚫 Price whipsawing violently (wait for structure)
🚫 You're tired, emotional, or distracted
```
---
## 🔍 PRE-MARKET CHECKLIST
**Every Morning Before Trading:**
```
□ Check economic calendar (avoid high-impact news)
□ Identify previous day's high/low (macro context)
□ Note overnight price action (gap up/down?)
□ Load SNIPER ORB on 1min or 5min chart
□ Select active session (London or New York)
□ Set TradingView alerts for ORB breakouts
□ Prepare stop/target orders in advance
□ Review yesterday's ORB ranges (context)
```
---
## 🎨 INDICATOR SETTINGS QUICK REFERENCE
### **Default Configuration (Recommended)**
```
Session: New York
Number of Targets: 3
Target % Increment: 50% (gives 0.5x, 1x, 1.5x)
Show VWAP: ON
VWAP Line Width: 2
ORB Line Width: 2
Target Line Width: 1
```
### **Aggressive Day Trading Setup**
```
Session: New York
Number of Targets: 5
Target % Increment: 30% (tighter targets)
Show VWAP: ON
```
### **Conservative Swing Setup**
```
Session: New York
Number of Targets: 2
Target % Increment: 75% (wider targets)
Show VWAP: ON
```
---
## 📈 OPTIMAL TIMEFRAME BY STYLE
| Trading Style | Recommended TF | Why? |
|--------------|----------------|------|
| **Scalper** | 1-minute | See every tick, 5-15 min holds |
| **Day Trader** | 5-minute | Balanced view, 30-90 min holds |
| **Swing Trader** | 15-minute | Less noise, 2-4 hour holds |
**💡 PRO TIP**: Use 5min chart for entries, but watch 1min for precise timing!
---
## 🧠 PATTERN RECOGNITION QUICK GUIDE
### **Bullish ORB Patterns**
```
1. "Staircase" → Price respects each target as new support
2. "Rocket Launch" → Clean break through all targets no pullback
3. "VWAP Bounce" → Pullback to VWAP, then continuation higher
4. "Triple Compression" → All ORBs converge then explosive breakout
```
### **Bearish ORB Patterns**
```
1. "Waterfall" → Price cascades through all downside targets
2. "Failed High" → Breaks top, immediately reverses to bottom
3. "VWAP Rejection" → Hits VWAP from above, hard rejection down
4. "Slow Bleed" → Gradual drift lower, respecting each target
```
### **Neutral/Chop Patterns**
```
1. "Ping Pong" → Price bouncing between ORB high/low repeatedly
2. "Flat VWAP" → VWAP horizontal, price hugging it (no trade)
3. "Wide Range" → ORB > 300 points, too much uncertainty
4. "Gap Confusion" → Opens far outside all ORBs, wait for reset
```
---
## 📊 CONFLUENCE SCORING SYSTEM
**Rate Each Trade 1-10 Before Entry:**
```
Breakout confirmed (30min ORB): +2 points
VWAP alignment: +2 points
Volume spike on breakout: +1 point
All 3 ORBs align: +1 point
Clean candle close beyond ORB: +1 point
Your YM SNIPER GOD MODE signal: +2 points
Time: 10:00-11:30 AM ET window: +1 point
SCORING:
9-10 points = SNIPER SETUP (maximum size)
7-8 points = GOOD TRADE (standard size)
5-6 points = MARGINAL (half size or skip)
< 5 points = NO TRADE (wait for better)
```
---
## 🎯 INTEGRATION WITH YM ULTIMATE SNIPER v8.1
**The Perfect Confluence:**
```
STEP 1: SNIPER ORB identifies the STRUCTURE
→ 30min ORB defines "Zones That Matter"
→ VWAP shows institutional bias
→ Targets define profit zones
STEP 2: YM ULTIMATE SNIPER triggers the ENTRY
→ Wait for GOD MODE signal at ORB boundary
→ 6-gate system confirms institutional pressure
→ Score ≥9.0, fat body ≥70%, delta dominance ≥70%
STEP 3: Execute with PRECISION
→ ORB break + GOD MODE = highest probability
→ Enter only when BOTH systems align
→ This is TRUE "sniper" trading
```
---
## 💡 COMMON MISTAKES TO AVOID
```
❌ Entering BEFORE 30min ORB completes
✅ Wait until 10:00 AM (NY) or 3:30 AM (London)
❌ Ignoring VWAP position
✅ Always check: is VWAP confirming your directional bias?
❌ Chasing breakouts after 50+ point move
✅ Wait for pullback to VWAP or first target
❌ Trading during lunch (12-1 PM ET)
✅ Volume dies, false signals increase
❌ Using same target % in all conditions
✅ Adjust: 30-40% in chop, 50-75% in trends
❌ Forgetting to move stop to breakeven at Target 1
✅ NEVER give back a winning trade
❌ Overtrading on slow days
✅ Some days only have 1-2 clean setups, that's okay!
❌ Not respecting the 3-strike rule
✅ 3 losses = done, come back tomorrow
```
---
## 📱 MOBILE TRADING SETUP
**TradingView Mobile App:**
```
1. Save SNIPER ORB as "Default Layout"
2. Enable push notifications for alerts
3. Set bracket orders (stop + targets) in advance
4. Keep phone charged during trading hours
5. Have broker app ready for quick execution
```
---
## 🔔 ALERT CONFIGURATION
**Essential Alerts to Set:**
```
1. "30min ORB Complete"
→ Time-based: 10:00 AM ET (NY) / 3:30 AM ET (London)
2. "ORB Breakout Up"
→ Built-in: Price > 30min ORB high
3. "ORB Breakout Down"
→ Built-in: Price < 30min ORB low
4. "VWAP Touch"
→ Custom: Price crosses VWAP line
5. "Target 1 Hit"
→ Price level: First green/red target line
```
---
## 🎓 DAILY REVIEW TEMPLATE
**After Each Trading Session:**
```
Date: __________ Session: London / New York
Total Setups Identified: ____
Trades Taken: ____
Win Rate: ____%
P&L: $______
Best Trade:
- Setup type: _________________
- Entry: ______ Exit: ______
- What went right: _________________
Worst Trade:
- Setup type: _________________
- Entry: ______ Exit: ______
- What went wrong: _________________
Tomorrow's Adjustments:
□ _________________________________
□ _________________________________
□ _________________________________
```
---
## 🚀 QUICK START: YOUR FIRST TRADE
**5-Minute Walkthrough:**
```
1. ADD TO CHART (9:25 AM ET)
→ Load SNIPER ORB indicator
→ Select "New York" session
→ Set targets: 3 levels, 50%
2. WAIT (9:30-10:00 AM)
→ Watch 30min ORB form (purple box)
→ Note VWAP position
→ Identify if price trending or ranging
3. PREPARE (10:00 AM)
→ 30min ORB complete!
→ Measure range (info table shows points)
→ Set alerts for breakout
4. EXECUTE (10:00-11:30 AM)
→ Breakout signal fires
→ Check VWAP alignment
→ Check YM SNIPER confluence
→ Enter trade if 7+ confluence points
5. MANAGE
→ Target 1: Take 50%, move stop to BE
→ Target 2: Take 30%, trail stop
→ Target 3: Let remainder run
6. REPEAT
→ Maximum 3 trades per session
→ Stop after 3 losses
```
---
## 🏆 WINNING TRADER MINDSET
```
"I don't need to trade every ORB breakout.
I only need the HIGH-PROBABILITY setups.
3-5 trades per day is enough.
90%+ win rate on those 3-5 trades = success.
Patience + Precision = Profitability"
```
---
## 📞 TROUBLESHOOTING
**Indicator Not Showing?**
- Check max_boxes/max_lines limits in code
- Verify you're on 1min-30min timeframe
- Ensure TradingView session is 9:30-17:00 ET
**ORBs Look Wrong?**
- Verify timezone: should be "America/New_York"
- Check if market has DST adjustment today
- Confirm broker chart time matches indicator
**VWAP Disappeared?**
- Toggle "Show Anchored VWAP" in settings
- Check if session ended (auto-disappears at 5 PM)
- Verify you're not in pre-market hours
**Targets Too Close/Far?**
- Adjust "Target % Increment" setting
- 30% = tighter, 75% = wider
- Default 50% works for most conditions
---
## 🎯 FINAL CHECKLIST BEFORE GOING LIVE
```
□ Backtested on replay mode for 2+ weeks
□ Understand all 5 setup types
□ Risk management rules memorized
□ YM Ultimate SNIPER v8.1 loaded on same chart
□ TradingView alerts configured
□ Stop/target calculator ready
□ Trading journal template prepared
□ Emotional state: calm and focused
□ Sufficient account size (minimum $10k recommended)
□ Broker platform tested and ready
IF ALL CHECKED → YOU'RE READY TO SNIPE! 🎯
```
---
## 📚 ADVANCED RESOURCES
**Combine SNIPER ORB with:**
- Cumulative Volume Delta (CVD) for confirmation
- Footprint charts for order flow at ORB boundaries
- Market profile for volume-at-price context
- Options flow for institutional positioning
- Economic calendar for high-volatility avoidance
**Study Material:**
- Mark Fisher "The Logical Trader" (ORB bible)
- SMB Capital YouTube (institutional ORB strategies)
- Your own YM Ultimate SNIPER documentation
- Price action at previous session ORBs (historical analysis)
---
**💎 REMEMBER: Quality over quantity. Sniper precision over shotgun spray.**
**🎯 Good luck, and happy sniping! 🎯**
═══════════════════════════════════════════════════════════════════
END OF SNIPER ORB TRADING CHEAT SHEET
═══════════════════════════════════════════════════════════════════


ALT Risk Metric StrategyHere's a professional write-up for your ALT Risk Strategy script:
ALT/BTC Risk Strategy - Multi-Crypto DCA with Bitcoin Correlation Analysis
Overview
This strategy uses Bitcoin correlation as a risk indicator to time entries and exits for altcoins. By analyzing how your chosen altcoin performs relative to Bitcoin, the strategy identifies optimal accumulation periods (when alt/BTC is oversold) and profit-taking opportunities (when alt/BTC is overbought). Perfect for traders who want to outperform Bitcoin by strategically timing altcoin positions.
Key Innovation: Why Alt/BTC Matters
Most traders focus solely on USD price, but Alt/BTC ratios reveal true altcoin strength:
When Alt/BTC is low → Altcoin is undervalued relative to Bitcoin (buy opportunity)
When Alt/BTC is high → Altcoin has outperformed Bitcoin (take profits)
This approach captures the rotation between BTC and alts that drives crypto cycles
Key Features
📊 Advanced Technical Analysis
RSI (60% weight): Primary momentum indicator on weekly timeframe
Long-term MA Deviation (35% weight): Measures distance from 150-period baseline
MACD (5% weight): Minor confirmation signal
EMA Smoothing: Filters noise while maintaining responsiveness
All calculations performed on Alt/BTC pairs for superior market timing
💰 3-Tier DCA System
Level 1 (Risk ≤ 70): Conservative entry, base allocation
Level 2 (Risk ≤ 50): Increased allocation, strong opportunity
Level 3 (Risk ≤ 30): Maximum allocation, extreme undervaluation
Continuous buying: Executes every bar while below threshold for true DCA behavior
Cumulative sizing: L3 triggers = L1 + L2 + L3 amounts combined
📈 Smart Profit Management
Sequential selling: Must complete L1 before L2, L2 before L3
Percentage-based exits: Sell portions of position, not fixed amounts
Auto-reset on re-entry: New buy signals reset sell progression
Prevents premature full exits during volatile conditions
🤖 3Commas Automation
Pre-configured JSON webhooks for Custom Signal Bots
Multi-exchange support: Binance, Coinbase, Kraken, Bitfinex, Bybit
Flexible quote currency: USD, USDT, or BUSD
Dynamic order sizing: Automatically adjusts to your tier thresholds
Full webhook documentation compliance
🎨 Multi-Asset Support
Pre-configured for popular altcoins:
ETH (Ethereum)
SOL (Solana)
ADA (Cardano)
LINK (Chainlink)
UNI (Uniswap)
XRP (Ripple)
DOGE
RENDER
Custom option for any other crypto
How It Works
Risk Metric Calculation (0-100 scale):
Fetches weekly Alt/BTC price data for stability
Calculates RSI, MACD, and deviation from 150-period MA
Normalizes MACD to 0-100 range using 500-bar lookback
Combines weighted components: (MACD × 0.05) + (RSI × 0.60) + (Deviation × 0.35)
Applies 5-period EMA smoothing for cleaner signals
Color-Coded Risk Zones:
Green (0-30): Extreme buying opportunity - Alt heavily oversold vs BTC
Lime/Yellow (30-70): Accumulation range - favorable risk/reward
Orange (70-85): Caution zone - consider taking initial profits
Red/Maroon (85-100+): Euphoria zone - aggressive profit-taking
Entry Logic:
Buys execute every candle when risk is below threshold
As risk decreases, position sizing automatically scales up
Example: If risk drops from 60→25, you'll be buying at L1 rate until it hits 50, then L2 rate, then L3 rate
Exit Logic:
Sells only trigger when in profit AND risk exceeds thresholds
Sequential execution ensures partial profit-taking
If new buy signal occurs before all sells complete, sell levels reset to L1
Configuration Guide
Choosing Your Altcoin:
Select crypto from dropdown (or use CUSTOM for unlisted coins)
Pick your exchange
Choose quote currency (USD, USDT, BUSD)
Risk Metric Tuning:
Long Term MA (default 150): Higher = more extreme signals, Lower = more frequent
RSI Length (default 10): Lower = more volatile, Higher = smoother
Smoothing (default 5): Increase for less noise, decrease for faster reaction
Buy Settings (Aggressive DCA Example):
L1 Threshold: 70 | Amount: $5
L2 Threshold: 50 | Amount: $6
L3 Threshold: 30 | Amount: $7
Total L3 buy = $18 per candle when deeply oversold
Sell Settings (Balanced Exit Example):
L1: 70 threshold, 25% position
L2: 85 threshold, 35% position
L3: 100 threshold, 40% position (final exit)
3Commas Setup
Bot Configuration:
Create Custom Signal Bot in 3Commas
Set trading pair to your altcoin/USD (e.g., ETH/USD, SOL/USDT)
Order size: Select "Send in webhook, quote" to use strategy's dollar amounts
Copy Bot UUID and Secret Token
Script Configuration:
Paste credentials into 3Commas section inputs
Check "Enable 3Commas Alerts"
Save and apply to chart
TradingView Alert:
Create Alert → Condition: "alert() function calls only"
Webhook URL: api.3commas.io
Enable "Webhook URL" checkbox
Expiration: Open-ended
Strategy Advantages
✅ Outperform Bitcoin: Designed specifically to beat BTC by timing alt rotations
✅ Capture Alt Seasons: Automatically accumulates when alts lag, sells when they pump
✅ Risk-Adjusted Sizing: Buys more when cheaper (better risk/reward)
✅ Emotional Discipline: Systematic approach removes fear and FOMO
✅ Multi-Asset: Run same strategy across multiple altcoins simultaneously
✅ Proven Indicators: Combines RSI, MACD, and MA deviation - battle-tested tools
Backtesting Insights
Optimal Timeframes:
Daily chart: Best for backtesting and signal generation
Weekly data is fetched internally regardless of display timeframe
Historical Performance Characteristics:
Accumulates heavily during bear markets and BTC dominance periods
Captures explosive altcoin rallies when BTC stagnates
Sequential selling preserves capital during extended downtrends
Works best on established altcoins with multi-year history
Risk Considerations:
Requires capital reserves for extended accumulation periods
Some altcoins may never recover if fundamentals deteriorate
Past correlation patterns may not predict future performance
Always size positions according to personal risk tolerance
Visual Interface
Indicator Panel Displays:
Dynamic color line: Green→Lime→Yellow→Orange→Red as risk increases
Horizontal threshold lines: Dashed lines mark your buy/sell levels
Entry/Exit labels: Green labels for buys, Orange/Red/Maroon for sells
Real-time risk value: Numerical display on price scale
Customization:
All threshold lines are adjustable via inputs
Color scheme clearly differentiates buy zones (green spectrum) from sell zones (red spectrum)
Line weights emphasize most extreme thresholds (L3 buy and L3 sell)
Strategy Philosophy
This strategy is built on the principle that altcoins move in cycles relative to Bitcoin. During Bitcoin rallies, alts often bleed against BTC (high sell, accumulate). When Bitcoin consolidates, alts pump (take profits). By measuring risk on the Alt/BTC chart instead of USD price, we time these rotations with precision.
The 3-tier system ensures you're always averaging in at better prices and scaling out at better prices, maximizing your Bitcoin-denominated returns.
Advanced Tips
Multi-Bot Strategy:
Run this on 5-10 different altcoins simultaneously to:
Diversify correlation risk
Capture whichever alt is pumping
Smooth equity curve through rotation
Pairing with BTC Strategy:
Use alongside the BTC DCA Risk Strategy for complete portfolio coverage:
BTC strategy for core holdings
ALT strategies for alpha generation
Rebalance between them based on BTC dominance
Threshold Calibration:
Check 2-3 years of historical data for your chosen alt
Note where risk metric sat during major bottoms (set buy thresholds)
Note where it peaked during euphoria (set sell thresholds)
Adjust for your risk tolerance and holding period
Credits
Strategy Development & 3Commas Integration: Claude AI (Anthropic)
Technical Analysis Framework: RSI, MACD, Moving Average theory
Implementation: pommesUNDwurst
Disclaimer
This strategy is for educational purposes only. Cryptocurrency trading involves substantial risk of loss. Altcoins are especially volatile and many fail completely. The strategy assumes liquid markets and reliable Alt/BTC price data. Always do your own research, understand the fundamentals of any asset you trade, and never risk more than you can afford to lose. Past performance does not guarantee future results. The authors are not financial advisors and assume no liability for trading decisions.
Additional Warning: Using leverage or trading illiquid altcoins amplifies risk significantly. This strategy is designed for spot trading of established cryptocurrencies with deep liquidity.
Tags: Altcoin, Alt/BTC, DCA, Risk Metric, Dollar Cost Averaging, 3Commas, ETH, SOL, Crypto Rotation, Bitcoin Correlation, Automated Trading, Alt Season
Feel free to modify any sections to better match your style or add specific backtesting results you've observed! 🚀Claude is AI and can make mistakes. Please double-check responses. Sonnet 4.5

3D Globe - World Stock MarketsA real-time 3D rotating globe visualization showing 19 major stock exchanges worldwide with their current trading status.
█ OVERVIEW
This indicator displays an interactive 3D Earth globe that rotates in sync with the sun (sun-synchronous rotation), providing an intuitive view of which markets are currently in daylight/trading hours. Each stock exchange is plotted at its geographic location with color-coded status indicators.
█ FEATURES
- 3D Globe Rendering
- Spherical projection with proper visibility culling (hidden side not drawn)
- 27 country/region polygons derived from Natural Earth 110m data
- Optional latitude/longitude grid (meridians every 20°, parallels every 20°)
- Sun-synchronous auto-rotation: the globe rotates 15° per hour to follow real-world daylight
- 19 Stock Exchanges Tracked
NYSE, NASDAQ, TSX (Toronto), BMV (Mexico), B3 (São Paulo), LSE (London), EURONEXT (Paris), XETRA (Frankfurt), SIX (Zurich), MOEX (Moscow), TADAWUL (Riyadh), JSE (Johannesburg), NSE (Mumbai), SSE (Shanghai), HKEX (Hong Kong), TSE (Tokyo), KRX (Seoul), SGX (Singapore), ASX (Sydney)
- Real-Time Market Table (10 columns)
- Status indicator (● open / ○ closed)
- Exchange name and country with flag
- Local time with seconds (HH:MM:SS)
- Opening time
- Time to open (for closed markets)
- Time since open (for open markets)
- Time to close (for open markets)
- Index name (S&P500, FTSE, DAX, CAC40, N225, HSI, etc.)
- Daily % change with color coding
█ HOW IT WORKS
The globe uses standard 3D mathematics:
1. Geographic coordinates (lat/lon) are converted to 3D Cartesian points on a unit sphere
2. Rotation matrices are applied for X-axis tilt and Y-axis rotation (sun position)
3. Points are projected onto 2D screen space
4. Visibility culling hides points on the far side of the globe (z < 0)
Performance optimization: The globe redraws only when the minute changes, while the market table updates every tick for accurate second-by-second timing.
█ SETTINGS
Globe Group:
- Globe Size: Adjustable radius (15-60)
- Show Grid: Toggle latitude/longitude lines
- Fill Continents: Toggle solid land fill vs outline only
Style Group:
- Background, Ocean, Land, Land Border, Grid colors
- Open/Closed market indicator colors
- Globe border color
Table Group:
- Position: Left or Right side
- Show/Hide market table
█ DATA SOURCES
- Geographic data: Simplified polygons derived from Natural Earth (public domain)
- Market hours: Standard trading sessions (does not account for holidays)
- Index data: Real-time from TradingView (TVC, MOEX, TADAWUL, NSE, SSE, ASX providers)
█ LIMITATIONS
- Market hours are based on regular sessions only (no pre/post market, no holiday calendar)
- UTC offsets are fixed (no automatic DST adjustment)
- Some index symbols may not be available in all regions
█ USE CASES
- Quick visual overview of global market activity
- Identifying trading opportunities across time zones
- Understanding market session overlaps
- Educational tool for learning about world markets
Open-source under Mozilla Public License 2.0.

猛の掟・初動完成版//@version=5
indicator("猛の掟・初動スクリーナー_完成版", overlay=true)
// =============================
// 入力パラメータ
// =============================
emaLenShort = input.int(5, "短期EMA", minval=1)
emaLenMid = input.int(13, "中期EMA", minval=1)
emaLenLong = input.int(26, "長期EMA", minval=1)
macdFastLen = input.int(12, "MACD Fast", minval=1)
macdSlowLen = input.int(26, "MACD Slow", minval=1)
macdSignalLen = input.int(9, "MACD Signal", minval=1)
macdZeroTh = input.float(0.2, "MACDゼロライン近辺とみなす許容値", step=0.05)
volMaLen = input.int(5, "出来高平均日数", minval=1)
volMinRatio = input.float(1.3, "出来高倍率(初動判定しきい値)", step=0.1)
volStrongRatio = input.float(1.5, "出来高倍率(本物/三点シグナル用)", step=0.1)
highLookback = input.int(60, "直近高値の参照本数", minval=10)
pullbackMin = input.float(5.0, "押し目最小 ", step=0.5)
pullbackMax = input.float(15.0, "押し目最大 ", step=0.5)
breakLookback = input.int(15, "レジブレ後とみなす本数", minval=1)
wickBodyMult = input.float(2.0, "ピンバー:下ヒゲが実体の何倍以上か", step=0.5)
// ★ シグナル表示 ON/OFF
showMou = input.bool(true, "猛シグナルを表示")
showKaku = input.bool(true, "確シグナルを表示")
// =============================
// 基本指標計算
// =============================
emaShort = ta.ema(close, emaLenShort)
emaMid = ta.ema(close, emaLenMid)
emaLong = ta.ema(close, emaLenLong)
= ta.macd(close, macdFastLen, macdSlowLen, macdSignalLen)
volMa = ta.sma(volume, volMaLen)
volRatio = volMa > 0 ? volume / volMa : 0.0
recentHigh = ta.highest(high, highLookback)
prevHigh = ta.highest(high , highLookback)
pullbackPct = recentHigh > 0 ? (recentHigh - close) / recentHigh * 100.0 : 0.0
// ローソク足
body = math.abs(close - open)
upperWick = high - math.max(open, close)
lowerWick = math.min(open, close) - low
// =============================
// A:トレンド条件
// =============================
emaUp = emaShort > emaShort and emaMid > emaMid and emaLong > emaLong
goldenOrder = emaShort > emaMid and emaMid > emaLong
aboveEma2 = close > emaLong and close > emaLong
trendOK = emaUp and goldenOrder and aboveEma2
// =============================
// B:MACD条件
// =============================
macdGC = ta.crossover(macdLine, macdSignal)
macdNearZero = math.abs(macdLine) <= macdZeroTh
macdUp = macdLine > macdLine
macdOK = macdGC and macdNearZero and macdUp
// =============================
// C:出来高条件
// =============================
volInitOK = volRatio >= volMinRatio // 8条件用
volStrongOK = volRatio >= volStrongRatio // 三点シグナル用
volumeOK = volInitOK
// =============================
// D:ローソク足パターン
// =============================
isBullPinbar = lowerWick > wickBodyMult * body and lowerWick > upperWick and close >= open
isBullEngulf = close > open and open < close and close > open
isBigBullCross = close > emaShort and close > emaMid and open < emaShort and open < emaMid and close > open
candleOK = isBullPinbar or isBullEngulf or isBigBullCross
// =============================
// E:価格帯(押し目&レジブレ)
// =============================
pullbackOK = pullbackPct >= pullbackMin and pullbackPct <= pullbackMax
isBreakout = close > prevHigh and close <= prevHigh
barsSinceBreak = ta.barssince(isBreakout)
afterBreakZone = barsSinceBreak >= 0 and barsSinceBreak <= breakLookback
afterBreakPullbackOK = afterBreakZone and pullbackOK and close > emaShort
priceOK = pullbackOK and afterBreakPullbackOK
// =============================
// 8条件の統合
// =============================
allRulesOK = trendOK and macdOK and volumeOK and candleOK and priceOK
// =============================
// 最終三点シグナル
// =============================
longLowerWick = lowerWick > wickBodyMult * body and lowerWick > upperWick
macdGCAboveZero = ta.crossover(macdLine, macdSignal) and macdLine > 0
volumeSpike = volStrongOK
finalThreeSignal = longLowerWick and macdGCAboveZero and volumeSpike
buyConfirmed = allRulesOK and finalThreeSignal
// =============================
// 描画
// =============================
plot(emaShort, color=color.new(color.yellow, 0), title="EMA 短期(5)")
plot(emaMid, color=color.new(color.orange, 0), title="EMA 中期(13)")
plot(emaLong, color=color.new(color.blue, 0), title="EMA 長期(26)")
// シグナル表示(ON/OFF付き)
plotshape(showMou and allRulesOK, title="猛の掟 8条件クリア候補", location=location.belowbar, color=color.new(color.lime, 0), text="猛")
plotshape(showKaku and buyConfirmed, title="猛の掟 最終三点シグナル確定", location=location.belowbar, color=color.new(color.yellow, 0), text="確")
// =============================
// アラート条件
// =============================
alertcondition(allRulesOK, title="猛の掟 8条件クリア候補", message="猛の掟 8条件クリア候補シグナル発生")
alertcondition(buyConfirmed, title="猛の掟 最終三点シグナル確定", message="猛の掟 最終三点シグナル=買い確定")

GOLDEN RSI (70-50-30)The fluctuation range has been expanded. Theoriginal author only set it between 40 and 60, but arange of 30 to 70 would be more reasonableAdditionally, a 50 median line has been added withinthe fluctuation range

Bitcoin Multibook v1.0 [Apollo Algo]Bitcoin Multibook v1.0 by Apollo Algo is an advanced market depth and order flow visualization tool that brings professional-grade multi-exchange order book analysis to TradingView. Inspired by Bookmap's multibook functionality and built upon LucF's original single "Tape" indicator concept, this tool aggregates real-time trading data from multiple Bitcoin exchanges into a unified tape display.
Credits & Attribution
This indicator is an evolution of the original "Tape" indicator created by LucF (TradingView: @LucF). The multibook enhancement and Bitcoin-specific optimizations were developed by Apollo Algo to provide traders with institutional-grade market microstructure visibility across major Bitcoin trading venues.
Purpose & Philosophy
Bitcoin leads the entire cryptocurrency market. By monitoring order flow across the primary Bitcoin exchanges simultaneously, traders gain crucial insights into:
Cross-exchange arbitrage opportunities
Institutional order flow patterns
Market maker positioning
True market sentiment beyond single-exchange data
Key Features
📊 Multi-Exchange Data Aggregation
Real-time tape from 3 major exchanges:
Binance (BTCUSDT)
Coinbase (BTCUSD)
Kraken (BTCUSD)
Customizable source inputs for any trading pair
Synchronized price and volume tracking
Exchange name identification in tape display
📈 Advanced Tape Display
Dynamic tape visualization with configurable line quantity (0-50 lines)
Directional flow indicators (+/- symbols for price changes)
Exchange identification for each trade
Volume precision control (0-16 decimal places)
Flexible positioning (9 screen positions available)
Real-time only operation for accurate order flow
🎯 Volume Delta Analysis
Real-time cumulative volume delta calculation
Divergence detection (price vs. volume direction)
Colored visual feedback for market sentiment
Total session delta displayed in footer
Cross-exchange delta aggregation
🚨 Smart Alert System
Marker 1: Volume Delta Bumps (⬆⬇)
Triggers on consecutive volume delta increases
Identifies momentum acceleration points
Filters out divergent movements
Marker 2: Volume Delta Thresholds (⇑⇓)
Fires when delta exceeds user-defined thresholds
Catches significant order imbalances
Excludes divergence conditions
Marker 3: Large Volume Detection (⤊⤋)
Highlights unusually large individual trades
Spots potential institutional activity
Direction-specific triggers
Configure Data Sources
Adjust exchange pairs if needed (e.g., for altcoin analysis)
Leave blank to disable specific exchanges
Use format: EXCHANGE:SYMBOL
Customize Display
Set tape line quantity based on screen size
Position the table for optimal visibility
Choose color scheme (text or background)
Adjust text size for readability
Configure Alerts
Enable desired markers (1, 2, or 3)
Set volume thresholds appropriate for your timeframe
Choose direction (Longs, Shorts, or Both)
Create TradingView alerts on marker signals
Trading Applications
Scalping (1-5 min)
Monitor tape speed for momentum shifts
Watch for cross-exchange divergences
Track large volume clusters
Use Marker 1 for quick momentum trades
Day Trading (5-60 min)
Identify accumulation/distribution phases
Spot institutional positioning
Confirm breakout validity with volume delta
Use Marker 2 for significant imbalances
Swing Trading (1H+)
Analyze volume delta trends
Detect smart money rotation
Time entries with order flow confirmation
Use Marker 3 for institutional footprints
Advanced Techniques
Cross-Exchange Arbitrage Detection
When price disparities appear between exchanges:
Immediate Opportunity: Price differences > 0.1%
Bot Activity: Rapid convergence patterns
Liquidity Vacuum: One exchange leading others
Divergence Trading Strategies
Volume delta diverging from price direction:
Absorption: Strong hands entering (price down, delta up)
Distribution: Smart money exiting (price up, delta down)
Reversal Setup: Sustained divergence over multiple bars
Institutional Footprint Recognition
Large volume characteristics:
Simultaneous Spikes: Same timestamp across exchanges
TWAP Patterns: Consistent volume over time
Iceberg Orders: Repeated same-size trades
Pine Script v6 Enhancements
Type Safety Improvements
Strict boolean type handling
Explicit type declarations
Enhanced error checking
Performance Optimizations
Improved request.security() function
Better memory management with arrays
Optimized table rendering
Modern Syntax Updates
indicator() instead of study()
Namespaced math functions (math.round())
Typed input functions (input.int(), input.float())
Performance Considerations
System Requirements
Real-time Data: Essential for tape operation
Multiple Security Calls: May impact performance
Array Operations: Memory intensive with high line counts
Table Rendering: CPU usage increases with tape size
Optimization Tips
Reduce tape lines for better performance
Increase volume filter to reduce noise
Disable unused markers
Use text-only coloring for faster rendering

Absorption RatioThe Hidden Connections Between Markets
Financial markets are not isolated islands. When panic spreads, seemingly unrelated assets suddenly begin moving in lockstep. Stocks, bonds, commodities, and currencies that normally provide diversification benefits start falling together. This phenomenon, where correlations spike during crises, has devastated portfolios throughout history. The Absorption Ratio provides a quantitative measure of this hidden fragility.
The concept emerged from research at State Street Associates, where Mark Kritzman, Yuanzhen Li, Sebastien Page, and Roberto Rigobon developed a novel application of principal component analysis to measure systemic risk. Their 2011 paper in the Journal of Portfolio Management demonstrated that when markets become tightly coupled, the variance explained by the first few principal components increases dramatically. This concentration of variance signals elevated systemic risk.
What the Absorption Ratio Measures
Principal component analysis, or PCA, is a statistical technique that identifies the underlying factors driving a set of variables. When applied to asset returns, the first principal component typically captures broad market movements. The second might capture sector rotations or risk-on/risk-off dynamics. Additional components capture increasingly idiosyncratic patterns.
The Absorption Ratio measures the fraction of total variance absorbed or explained by a fixed number of principal components. In the original research, Kritzman and colleagues used the first fifth of the eigenvectors. When this fraction is high, it means a small number of factors are driving most of the market movements. Assets are moving together, and diversification provides less protection than usual.
Consider an analogy: imagine a room full of people having independent conversations. Each person speaks at different times about different topics. The total "variance" of sound in the room comes from many independent sources. Now imagine a fire alarm goes off. Suddenly everyone is talking about the same thing, moving in the same direction. The variance is now dominated by a single factor. The Absorption Ratio captures this transition from diverse, independent behavior to unified, correlated movement.
The Implementation Approach
TradingView does not support matrix algebra required for true principal component analysis. This implementation uses a closely related proxy: the average absolute correlation across a universe of major asset classes. This approach captures the same underlying phenomenon because when assets are highly correlated, the first principal component explains more variance by mathematical necessity.
The asset universe includes eight ETFs representing major investable categories: SPY and QQQ for large cap US equities, IWM for small caps, EFA for developed international markets, EEM for emerging markets, TLT for long-term treasuries, GLD for gold, and USO for oil. This selection provides exposure to equities across geographies and market caps, plus traditional diversifying assets.
From eight assets, there are twenty-eight unique pairwise correlations. The indicator calculates each using a rolling window, takes the absolute value to measure coupling strength regardless of direction, and averages across all pairs. This average correlation is then transformed to match the typical range of published Absorption Ratio values.
The transformation maps zero average correlation to an AR of 0.50 and perfect correlation to an AR of 1.00. This scaling aligns with empirical observations that the AR typically fluctuates between 0.60 and 0.95 in practice.
Interpreting the Regimes
The indicator classifies systemic risk into four regimes based on AR levels.
The Extreme regime occurs when the AR exceeds 0.90. At this level, nearly all asset classes are moving together. Diversification has largely failed. Historically, this regime has coincided with major market dislocations: the 2008 financial crisis, the 2020 COVID crash, and significant correction periods. Portfolios constructed under normal correlation assumptions will experience larger drawdowns than expected.
The High regime, between 0.80 and 0.90, indicates elevated systemic risk. Correlations across asset classes are above normal. This often occurs during the build-up to stress events or during volatile periods where fear is spreading but has not reached panic levels. Risk management should be more conservative.
The Normal regime covers AR values between 0.60 and 0.80. This represents typical market conditions where some correlation exists between assets but diversification still provides meaningful benefits. Standard portfolio construction assumptions are reasonable.
The Low regime, below 0.60, indicates that assets are behaving relatively independently. Diversification is working well. Idiosyncratic factors dominate returns rather than systematic risk. This environment is favorable for active management and security selection strategies.
The Relationship to Portfolio Construction
The implications for portfolio management are significant. Modern portfolio theory assumes correlations are stable and uses historical estimates to construct efficient portfolios. The Absorption Ratio reveals that this assumption is violated precisely when it matters most.
When AR is elevated, the effective number of independent bets in a diversified portfolio shrinks. A portfolio holding stocks, bonds, commodities, and real estate might behave as if it holds only one or two positions during high AR periods. Position sizing based on normal correlation estimates will underestimate portfolio risk.
Conversely, when AR is low, true diversification opportunities expand. The same nominal portfolio provides more independent return streams. Risk can be deployed more aggressively while maintaining the same effective exposure.
Component Analysis
The indicator separately tracks equity correlations and cross-asset correlations. These components tell different stories about market structure.
Equity correlations measure coupling within the stock market. High equity correlation indicates broad risk-on or risk-off behavior where all stocks move together. This is common during both rallies and selloffs driven by macroeconomic factors. Stock pickers face headwinds when equity correlations are elevated because individual company fundamentals matter less than market beta.
Cross-asset correlations measure coupling between different asset classes. When stocks, bonds, and commodities start moving together, traditional hedges fail. The classic 60/40 stock/bond portfolio, for example, assumes negative or low correlation between equities and treasuries. When cross-asset correlation spikes, this assumption breaks down.
During the 2022 market environment, for instance, both stocks and bonds fell significantly as inflation and rate hikes affected all assets simultaneously. High cross-asset correlation warned that the usual defensive allocations would not provide their expected protection.
Mean Reversion Characteristics
Like most risk metrics, the Absorption Ratio tends to mean-revert over time. Extremely high AR readings eventually normalize as panic subsides and assets return to more independent behavior. Extremely low readings tend to rise as some level of systematic risk always reasserts itself.
The indicator tracks AR in statistical terms by calculating its Z-score relative to the trailing distribution. When AR reaches extreme Z-scores, the probability of normalization increases. This creates potential opportunities for strategies that bet on mean reversion in systemic risk.
A buy signal triggers when AR recovers from extremely elevated levels, suggesting the worst of the correlation spike may be over. A sell signal triggers when AR rises from unusually low levels, warning that complacency about diversification benefits may be excessive.
Momentum and Trend
The rate of change in AR carries information beyond the absolute level. Rapidly rising AR suggests correlations are increasing and systemic risk is building. Even if AR has not yet reached the high regime, acceleration in coupling should prompt increased vigilance.
Falling AR momentum indicates normalizing conditions. Correlations are decreasing and assets are returning to more independent behavior. This often occurs in the recovery phase following stress events.
Practical Application
For asset allocators, the AR provides guidance on how much diversification benefit to expect from a given allocation. During high AR periods, reducing overall portfolio risk makes sense because the usual diversifiers provide less protection. During low AR periods, standard or even aggressive allocations are more appropriate.
For risk managers, the AR serves as an early warning indicator. Rising AR often precedes large market moves and volatility spikes. Tightening risk limits before correlations reach extreme levels can protect capital.
For systematic traders, the AR provides a regime filter. Mean reversion strategies may work better during high AR periods when panics create overshooting. Momentum strategies may work better during low AR periods when trends can develop independently across assets.
Limitations and Considerations
The proxy methodology introduces some approximation error relative to true PCA-based AR calculations. The asset universe, while representative, does not include all possible diversifiers. Correlation estimates are inherently backward-looking and can change rapidly.
The transformation from average correlation to AR scale is calibrated to match typical published ranges but is not mathematically equivalent to the eigenvalue ratio. Users should interpret levels directionally rather than as precise measurements.
Correlation regimes can persist longer than expected. Mean reversion signals indicate elevated probability of normalization but do not guarantee timing. High AR can remain elevated throughout extended crisis periods.
References
Kritzman, M., Li, Y., Page, S., and Rigobon, R. (2011). Principal Components as a Measure of Systemic Risk. Journal of Portfolio Management, 37(4), 112-126.
Kritzman, M., and Li, Y. (2010). Skulls, Financial Turbulence, and Risk Management. Financial Analysts Journal, 66(5), 30-41.
Billio, M., Getmansky, M., Lo, A., and Pelizzon, L. (2012). Econometric Measures of Connectedness and Systemic Risk in the Finance and Insurance Sectors. Journal of Financial Economics, 104(3), 535-559.

猛の掟・初動スクリーナー_完成版//@version=5
indicator("猛の掟・初動スクリーナー_完成版", overlay=true)
// =============================
// 入力パラメータ
// =============================
emaLenShort = input.int(5, "短期EMA", minval=1)
emaLenMid = input.int(13, "中期EMA", minval=1)
emaLenLong = input.int(26, "長期EMA", minval=1)
macdFastLen = input.int(12, "MACD Fast", minval=1)
macdSlowLen = input.int(26, "MACD Slow", minval=1)
macdSignalLen = input.int(9, "MACD Signal", minval=1)
macdZeroTh = input.float(0.2, "MACDゼロライン近辺とみなす許容値", step=0.05)
volMaLen = input.int(5, "出来高平均日数", minval=1)
volMinRatio = input.float(1.3, "出来高倍率(初動判定しきい値)", step=0.1)
volStrongRatio = input.float(1.5, "出来高倍率(本物/三点シグナル用)", step=0.1)
highLookback = input.int(60, "直近高値の参照本数", minval=10)
pullbackMin = input.float(5.0, "押し目最小 ", step=0.5)
pullbackMax = input.float(15.0, "押し目最大 ", step=0.5)
breakLookback = input.int(15, "レジブレ後とみなす本数", minval=1)
wickBodyMult = input.float(2.0, "ピンバー:下ヒゲが実体の何倍以上か", step=0.5)
// ★ シグナル表示 ON/OFF
showMou = input.bool(true, "猛シグナルを表示")
showKaku = input.bool(true, "確シグナルを表示")
// =============================
// 基本指標計算
// =============================
emaShort = ta.ema(close, emaLenShort)
emaMid = ta.ema(close, emaLenMid)
emaLong = ta.ema(close, emaLenLong)
= ta.macd(close, macdFastLen, macdSlowLen, macdSignalLen)
volMa = ta.sma(volume, volMaLen)
volRatio = volMa > 0 ? volume / volMa : 0.0
recentHigh = ta.highest(high, highLookback)
prevHigh = ta.highest(high , highLookback)
pullbackPct = recentHigh > 0 ? (recentHigh - close) / recentHigh * 100.0 : 0.0
// ローソク足
body = math.abs(close - open)
upperWick = high - math.max(open, close)
lowerWick = math.min(open, close) - low
// =============================
// A:トレンド条件
// =============================
emaUp = emaShort > emaShort and emaMid > emaMid and emaLong > emaLong
goldenOrder = emaShort > emaMid and emaMid > emaLong
aboveEma2 = close > emaLong and close > emaLong
trendOK = emaUp and goldenOrder and aboveEma2
// =============================
// B:MACD条件
// =============================
macdGC = ta.crossover(macdLine, macdSignal)
macdNearZero = math.abs(macdLine) <= macdZeroTh
macdUp = macdLine > macdLine
macdOK = macdGC and macdNearZero and macdUp
// =============================
// C:出来高条件
// =============================
volInitOK = volRatio >= volMinRatio // 8条件用
volStrongOK = volRatio >= volStrongRatio // 三点シグナル用
volumeOK = volInitOK
// =============================
// D:ローソク足パターン
// =============================
isBullPinbar = lowerWick > wickBodyMult * body and lowerWick > upperWick and close >= open
isBullEngulf = close > open and open < close and close > open
isBigBullCross = close > emaShort and close > emaMid and open < emaShort and open < emaMid and close > open
candleOK = isBullPinbar or isBullEngulf or isBigBullCross
// =============================
// E:価格帯(押し目&レジブレ)
// =============================
pullbackOK = pullbackPct >= pullbackMin and pullbackPct <= pullbackMax
isBreakout = close > prevHigh and close <= prevHigh
barsSinceBreak = ta.barssince(isBreakout)
afterBreakZone = barsSinceBreak >= 0 and barsSinceBreak <= breakLookback
afterBreakPullbackOK = afterBreakZone and pullbackOK and close > emaShort
priceOK = pullbackOK and afterBreakPullbackOK
// =============================
// 8条件の統合
// =============================
allRulesOK = trendOK and macdOK and volumeOK and candleOK and priceOK
// =============================
// 最終三点シグナル
// =============================
longLowerWick = lowerWick > wickBodyMult * body and lowerWick > upperWick
macdGCAboveZero = ta.crossover(macdLine, macdSignal) and macdLine > 0
volumeSpike = volStrongOK
finalThreeSignal = longLowerWick and macdGCAboveZero and volumeSpike
buyConfirmed = allRulesOK and finalThreeSignal
// =============================
// 描画
// =============================
plot(emaShort, color=color.new(color.yellow, 0), title="EMA 短期(5)")
plot(emaMid, color=color.new(color.orange, 0), title="EMA 中期(13)")
plot(emaLong, color=color.new(color.blue, 0), title="EMA 長期(26)")
// シグナル表示(ON/OFF付き)
plotshape(showMou and allRulesOK, title="猛の掟 8条件クリア候補", location=location.belowbar, color=color.new(color.lime, 0), text="猛")
plotshape(showKaku and buyConfirmed, title="猛の掟 最終三点シグナル確定", location=location.belowbar, color=color.new(color.yellow, 0), text="確")
// =============================
// アラート条件
// =============================
alertcondition(allRulesOK, title="猛の掟 8条件クリア候補", message="猛の掟 8条件クリア候補シグナル発生")
alertcondition(buyConfirmed, title="猛の掟 最終三点シグナル確定", message="猛の掟 最終三点シグナル=買い確定")

P_Multi-ORB & Session Breakers// WHAT THIS SCRIPT DOES:
// 1. Opening Range Breakout (ORB):
// - Calculates High/Low of the first 5 mins (9:30-9:35 AM EST).
// - Calculates High/Low of the first 60 mins (9:30-10:30 AM EST).
// - Draws infinite lines for breakout levels.
//
// 2. Session Liquidity Breakers:
// - Tracks High/Low of ASIA & LONDON sessions.
// - Alerts and labels when subsequent sessions break these levels.
//
// HOW TO USE:
// - Optimized for 5m or 15m charts on NQ/ES.
// - This version is colored for WHITE/LIGHT background charts.

CRR - GANAEMAs on the chart (visual trend)
EMA 15 (white), 30 (yellow), 200 (red).
2️⃣ DASH Engine 1m–5m–15m (+ 1H and 1D)
For each TF (1m, 5m, 15m) it calculates a bull/bear score using:
EMA structure (15, 30, 50, 100, 200).
MACD.
RSI.
Relationship with EMA 30 and VWAP.
FVG in favor.
ATR change (volatility **increasing**).
From this it derives:
t1 (1m), t2 (5m), t3 (15m),
t4 (1H) and t5 (1D) (only for EMA200).
It detects:
ALL BULL → “BULLISH - BUYS ONLY”.
ALL BEAR → “BEARISH - SELLS ONLY”.
Otherwise → “NEUTRAL / MIXED”.
In addition:
Calculates BULL TF vs BEAR TF (%) between 1m–5m–15m.
Displays a visual bar 🐂🟩 vs 🐻🟥.
3️⃣ GOLD News (manual)
Special bar that says:
Neutral
BUY (positive)
SELL (negative)
Paints the HUD with color according to the news you select.
4️⃣ NO RETRACEMENT Alerts (beast mode 💣)
Very strict conditions using the 5 TFs:
BUY NO RETRACEMENT if:
4 or more TFs in bull mode (bullTF_all >= 4),
1m ultra bull (EMA bull, RSI>60, MACD bull, high volume, price above EMA15 and VWAP, FVG ≥ 0).
SELL NO RETRACEMENT is the same but bearish.
Creates alerts:
CRR BUY NO RETRACEMENT
CRR SELL NO RETRACEMENT
5️⃣ PRO LITE Patterns: Double Top / Double Bottom
Detects double tops and double bottoms with:
Minimum bar distance.
Tolerance in %. Optional filters:
MACD, RSI, ATR (volatility), volume, FVG.
If everything aligns:
Plots SELL at double top.
Plots BUY at double bottom.
6️⃣ TOP Indicators Block (SMI + WaveTrend + Supertrend)
SMI (momentum), WaveTrend, and Supertrend:
Counts which are in bull mode and which are in bear mode.
Displays:
TOP IND: BULLS XX% | BEARS YY%.
7️⃣ Integrated Internal SMC Module
Structure HH, LH, HL, LL.
BMS (break of structure) and ChoCH (change of character).
Filter with ATR + volume + MACD + gaps.
Internal Fibonacci of the last range (38.2, 50, 61.8).
Dotted yellow lines of the current range (swing high/low).
🧠 In short:
It's your command center for XAUUSD:
Global mode (buy only / sell only / mixed),
% of timeframes favoring bulls/bears,
gold news,
no-lag alerts,
filtered double top/bottom,
TOP indicators,
and complete SMC (structure + BMS/ChoCH + Fibonacci + range)...
all integrated into a single CRAZY RAY RAY HUD
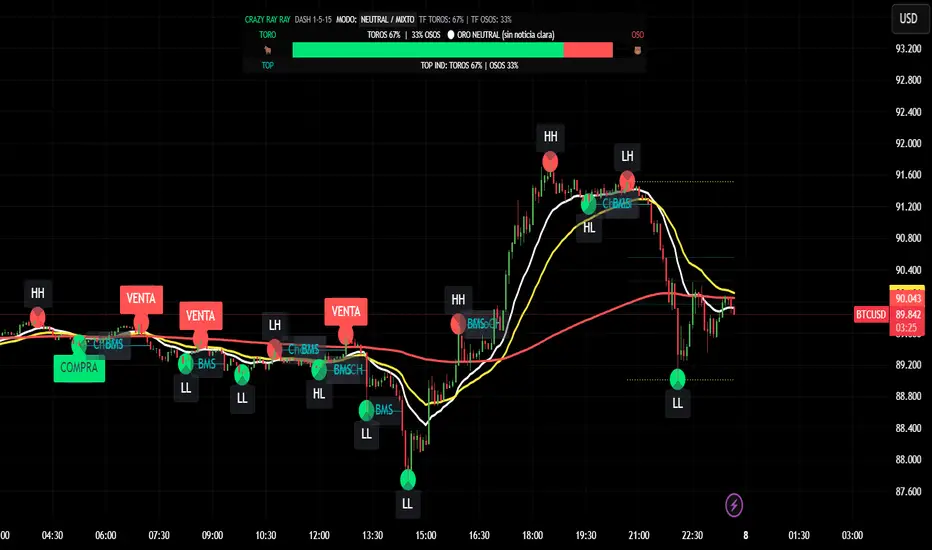
Trend Gazer: Unified ICT Trading System with Signals# Trend Gazer User Guide (English)
## 📖 Table of Contents
1. (#about-this-indicator)
2. (#quick-start-guide-3-steps)
3. (#detailed-usage)
4. (#settings-customization)
5. (#why-combine-multiple-features)
6. (#faq)
---
## About This Indicator
**Trend Gazer** is an integrated trading system designed to read institutional order flow like professional traders.
### 🎯 3 Problems This Indicator Solves
#### ❌ Problem 1: Too Many Indicators = Information Overload
```
Normal: RSI + MACD + Moving Average + Bollinger Bands... → Cluttered chart
Solution: All integrated into ONE indicator → Clean & Clear
```
#### ❌ Problem 2: Single Indicators Give False Signals
```
Normal: Enter based on RSI alone → Frequent stop-outs
Solution: Structure × Zone × Momentum multi-angle confirmation → Higher win rate
```
#### ❌ Problem 3: Unclear Entry Timing
```
Normal: Know the trend but don't know WHERE to enter
Solution: LS Bounce Signal shows EXACT entry points
```
---
## Quick Start Guide (3 Steps)
### 🚀 STEP 1: Confirm Trend Direction
**Look for CHoCH (Change of Character)**
```
📍 (1.CHoCH) label = Uptrend starting
📍 (a.CHoCH) label = Downtrend starting
```
**Important**: Wait for CHoCH! No direction without it.
---
### 🎯 STEP 2: Find Entry Points
**Wait for LS Bounce Signal (green/red labels)**
```
🟢 "Long@ HL only" label → LONG (buy) candidate
🔴 "Short@ LH only" label → SHORT (sell) candidate
```
**Label text color meaning**:
- **White text**: Clean trend (high confidence)
- **Yellow text**: Trend transition (moderate caution)
---
### 🛡️ STEP 3: Final Confirmation with Bar Color
**Bar color shows market state**
```
🔴 Red bar: BUY zone (buying is favored)
🟢 Green bar: SELL zone (selling is favored)
⚪ White bar: Neutral (wait and see)
```
---
## Detailed Usage
### 📊 Understanding the Chart
#### 1. Labels (Market Structure Changes)
```
(1.CHoCH) / (a.CHoCH) : Trend reversal
(2.SiMS) / (b.SiMS) : Momentum confirmation
(3.BoMS) / (c.BoMS) : Trend continuation
```
#### 2. Boxes (Institutional Order Zones)
```
📦 Blue boxes: Bullish OB (buy orders accumulated)
📦 Red boxes: Bearish OB (sell orders accumulated)
📦 Black transparent boxes: Liquidity Sweep
```
**How to use Order Blocks**:
- Function as support/resistance
- Signals within OB have higher reliability
- Use for stop-loss placement
#### 3. Lines (Trends and Support/Resistance)
```
━━━ Red lines: EMA20, EMA50, EMA100 (short to mid-term trends)
━━━ Blue lines: 60min NPR/BB bands (support/resistance)
```
#### 4. Bar Colors (Filter 6)
```
Bar color = Real-time market state
🔴 Red: Buying is favored
🟢 Green: Selling is favored
⚪ White: Neutral
```
---
### 🎯 Practical Trading Flow
#### 📍 Preparation Phase
```
1. Open chart (recommended: 5min or 15min)
2. Add Trend Gazer to chart
3. Start in observation mode (don't enter yet)
```
#### 📍 Entry Decision
```
✅ CHoCH confirms direction → Uptrend starting
✅ LS Bounce Signal "Long@ HL only" appears
→ Entry point candidate
✅ Bar turns red → Market supports buying
→ Entry decision 🎯
✅ Place stop below nearest Order Block (blue box)
```
#### 📍 Exit Decision
```
🔴 Opposite LS Bounce Signal "Short@ LH only" appears
→ Consider taking profit
🔴 Bar turns green
→ Potential trend reversal, review position
🔴 Stop loss hit
→ Exit with loss
```
---
### 💡 Tips for Higher Win Rate
#### ✅ DO's
```
1. Enter AFTER CHoCH appears
2. Prioritize white-text LS Bounce Signals
3. Check higher timeframe (1H or Daily) trend
4. Emphasize signals within Order Blocks
5. Use bar color as final confirmation
```
#### ❌ DON'Ts
```
1. Enter before CHoCH → No clear direction
2. Enter only on yellow text → Unstable transition period
3. Ignore bar color → Trading against market state
4. Don't check Order Blocks → Unclear support/resistance
5. Enter same direction consecutively → Overtrading
```
---
## Settings Customization
### 🔧 How to Open Settings
```
1. Right-click on indicator name on chart
2. Select "Settings..."
3. Settings panel opens
```
---
### 📋 Recommended Setting Profiles
#### 🔰 Beginner Settings (Simple)
**Goal**: Reduce noise, show only important signals
```
【FILTERS】
✅ Bonus Filter: ON
✅ Filter 6 (OB/BB/NPR Zone Filter): ON
❌ Direction Filter: OFF
❌ Liquidation Reversal Filter: OFF
❌ ICT Market Structure Filter: OFF
❌ EMA Trend Filter: OFF
❌ OB/FVG Filter 1: OFF
❌ OB/FVG Filter 2: OFF
【SIGNALS】
✅ Signal 0 (Bonus): ON
✅ Signal 1 (VWC Change): ON
✅ Signal 2 (Liq Rev): ON
❌ Signal 3 (LS): OFF (complex alone)
❌ Signal 4 (LS Break): OFF
❌ Signal 5 (OB+LS NPR): OFF
❌ Signal 6 (OB+LS EMA): OFF
【LS BOUNCE SIGNAL】
✅ Exclude EMA50 from touch detection: OFF
❌ Only show when EMA fills are mixed: OFF
```
**What happens with this setup**:
- Only Bonus (black background) signals display
- LS Bounce Signals clearly visible
- Noisy signals filtered out
---
#### 💪 Intermediate Settings (Balanced)
**Goal**: Enable key filters for better accuracy
```
【FILTERS】
✅ Bonus Filter: ON
✅ Filter 6 (OB/BB/NPR Zone Filter): ON
✅ ICT Market Structure Filter: ON
❌ Direction Filter: OFF
❌ Liquidation Reversal Filter: OFF
❌ EMA Trend Filter: OFF
❌ OB/FVG Filter 1: OFF
❌ OB/FVG Filter 2: OFF
【SIGNALS】
✅ Signal 0 (Bonus): ON
✅ Signal 1 (VWC Change): ON
✅ Signal 2 (Liq Rev): ON
✅ Signal 3 (LS): ON
❌ Signal 4 (LS Break): OFF
❌ Signal 5 (OB+LS NPR): OFF
❌ Signal 6 (OB+LS EMA): OFF
【LS BOUNCE SIGNAL】
✅ Exclude EMA50 from touch detection: OFF
❌ Only show when EMA fills are mixed: OFF
```
**What happens with this setup**:
- Signals only after CHoCH (trend confirmed)
- Filter 6 changes bar colors
- Liquidity Sweeps also displayed
---
#### 🚀 Advanced Settings (Full Utilization)
**Goal**: Master all features
```
【FILTERS】
✅ Bonus Filter: ON
✅ Filter 6 (OB/BB/NPR Zone Filter): ON
✅ ICT Market Structure Filter: ON
✅ Direction Filter: ON
✅ EMA Trend Filter: ON
❌ Liquidation Reversal Filter: OFF (optional)
✅ OB/FVG Filter 1: ON
✅ OB/FVG Filter 2: ON
【SIGNALS】
✅ All ON
【LS BOUNCE SIGNAL】
✅ Exclude EMA50 from touch detection: ON (reduce EMA50 noise)
✅ Only show when EMA fills are mixed: ON (show only transition zones)
```
**What happens with this setup**:
- Fewer signals (precision-focused)
- Multiple confirmations greatly reduce false signals
- Only signals confirmed by trend, momentum, and zones
---
### 🎨 Display Customization
#### Change Label Size
```
【BUY/SELL SIGNAL APPEARANCE】
→ "BUY/SELL Label Size"
→ Choose from: tiny / small / normal / large / huge
Recommended: small (default)
```
#### Order Block Display Settings
```
【ORDER BLOCK (OB) SETTINGS】
✅ Show Current TF OB: Current timeframe OB
✅ Show 1min OB: 1-minute OB
✅ Show 5min OB: 5-minute OB
✅ Show 15min OB: 15-minute OB
Recommended: Only 15min OB ON (simple)
```
#### Liquidity Sweep Display
```
【LIQUIDITY SWEEPS SETTINGS】
→ "Sweep Length": Sensitivity (small=frequent, large=selective)
→ "Sweep Option": Standard / Maximum
Recommended: Length=40, Option=Standard
```
#### NPR/BB Bands Display
```
【NPR (NON-REPAINT STDEV) SETTINGS】
✅ Display 60min NPR Bands: 60-minute support/resistance
❌ Display Current TF NPR Bands: Current timeframe (optional)
Recommended: Only 60min ON
```
---
### ⚙️ Advanced Settings
#### Fine-tune Filter 6
```
【FINAL FILTERS】
→ "Enable Filter 6 (OB/BB/NPR Zone Filter)"
When ON:
- Bars color-coded red/green/white
- Behavior at OB, NPR/BB touches controlled
```
#### LS Bounce Signal Adjustments
```
【LS BOUNCE SIGNAL】
→ "Exclude EMA50 from touch detection"
OFF: Detect NPR/BB/EMA50 (all 3)
ON: Detect NPR/BB only (exclude EMA50)
→ "Only show when EMA fills are mixed"
OFF: Show all LS Bounce Signals
ON: Show only transition zone signals (yellow text)
```
#### MTF (Multi-Timeframe) Control
```
【ORDER BLOCK (OB) SETTINGS】
→ "Disable MTF on 1hr+ Charts"
ON: Disable MTF on 1H+ (save memory)
OFF: MTF enabled on all timeframes
Recommended: ON (unnecessary on larger timeframes)
```
---
### 🎯 Purpose-Based Configuration Guide
#### 🔍 Goal 1: Reduce Signal Count
```
✅ Bonus Filter: ON
✅ ICT Market Structure Filter: ON
✅ Filter 6: ON
✅ All Signals OFF, only Signal 0 ON
```
#### 🔍 Goal 2: Get More Signals
```
❌ All Filters OFF
✅ All Signals ON
```
#### 🔍 Goal 3: Trend Following Only
```
✅ ICT Market Structure Filter: ON
✅ Direction Filter: ON
✅ EMA Trend Filter: ON
```
#### 🔍 Goal 4: Counter-Trend Trading
```
✅ LS Bounce Signal: ON
✅ Filter 6: ON
❌ ICT Market Structure Filter: OFF
```
#### 🔍 Goal 5: Day Trading (5-15min charts)
```
✅ Show 15min OB: ON
✅ Display 60min NPR Bands: ON
✅ LS Bounce Signal: ON
❌ Show 1min/5min OB: OFF
```
#### 🔍 Goal 6: Scalping (1-5min charts)
```
✅ Show 5min OB: ON
✅ Show 15min OB: ON
✅ Display 60min NPR Bands: ON
✅ All Signals: ON
```
---
### 💾 Saving and Loading Settings
#### Save Settings
```
1. Click "..." in top-right of Settings screen
2. Select "Save as default"
→ Same settings auto-applied next time
```
#### Reset Settings
```
1. Click "..." in top-right of Settings screen
2. Select "Reset settings"
→ Return to default settings
```
---
## Why Combine Multiple Features?
### 🎯 Problem: Single Indicator Limitations
Common trader problems:
```
❌ RSI alone → Trade against trend, lose
❌ Moving Average alone → Late entry timing
❌ Support/Resistance alone → Caught by false breakouts
```
**Markets are complex**. One angle isn't enough.
---
### 💡 Solution: Multi-Angle Integrated Approach
#### 1️⃣ Structure × Zone × Momentum
```
📐 Structure (ICT CHoCH)
→ "Which direction is likely?"
📦 Zone (OB/NPR/BB)
→ "Where will price react?"
💨 Momentum (EMA/VWC)
→ "Is there momentum now?"
```
**When all 3 align = Highest win-rate timing**
---
#### 2️⃣ Multi-Timeframe Analysis
```
Big picture: Confirm Daily direction
Medium-term: Check 1H Order Blocks
Short-term: Time entry on 5min
```
**Short-term entries aligned with higher timeframes = Better win rate**
---
#### 3️⃣ Understanding Liquidity
```
🎣 Institutional strategy:
1. Intentionally move price opposite to stop out retail
2. Then, move in real direction
💡 Liquidity Sweep = Visualize this "trap"
→ Read institutional order flow
```
---
### 🧠 Integration Examples
#### Case 1: RSI Alone vs Integrated System
**Scenario**: RSI at 30 (oversold)
```
❌ RSI-only decision:
→ "Buy!"
→ But downtrend continues, loss 😢
✅ Trend Gazer:
CHoCH check → Still downtrend ❌
Order Block → In Bearish OB ❌
LS Bounce → SHORT signal only ❌
→ Skip or SHORT
→ Avoid loss ✅
```
**Result**: Multiple filters block wrong entry
---
#### Case 2: LS Bounce Signal 2-Stage Logic
**Scenario**: Price touches 60min NPR lower band
```
🔍 Traditional method:
Touched → Buy!
→ But price continues down 😢
✅ Trend Gazer:
Stage 1: NPR touch + red bar → Flag ON
Stage 2: EMA20 crosses above EMA50 → Confirm bounce
→ Now "Long@ HL only" displays
→ Entry → Success ✅
```
**Result**: Not just "touch" but "touch + bounce confirmation" improves accuracy
---
### 🎓 Progressive Learning Design
This indicator is designed for **beginners to advanced**:
```
📖 Beginner (Month 1):
Use only CHoCH + LS Bounce Signal
→ Learn trend and entry points
📖 Intermediate (Months 2-3):
Add Order Block + Bar Color
→ Learn support/resistance and filtering
📖 Advanced (Month 6+):
Master all features
→ Read institutional order flow
```
**Ultimate goal**: Indicator becomes confirmation tool. Your market sense becomes primary.
---
### 🔬 Technical Advantages
#### 1. Non-Repaint STDEV (NPR)
```
Normal Bollinger Bands:
→ Past data changes (repaints)
→ Inaccurate backtesting
NPR:
→ Past data doesn't change (non-repaint)
→ Reliable verification possible
```
#### 2. 2-Stage Signal Logic
```
Traditional: Condition met → Immediate signal
→ Many false signals
Trend Gazer: Condition1 → Flag ON → Condition2 → Signal
→ Confirmation step improves accuracy
```
#### 3. Alternating Filter
```
Problem: Same-direction signals spam
→ Overtrading
Solution: LONG → SHORT → LONG alternating only
→ Prevent unnecessary entries
```
---
### 💎 Conclusion: Why Integration?
```
Single indicator = "Partial truth"
Integrated system = "3D market perspective"
```
**Markets are multifaceted**. One angle isn't enough.
Trend Gazer **integrates multiple screens pros watch simultaneously into ONE**,
allowing beginners to read charts with institutional perspective.
---
## FAQ
### ❓ Q1: Which timeframe is best?
**A**: Depends on trading style
```
Scalping: 1min ~ 5min
Day Trading: 5min ~ 15min
Swing: 1H ~ 4H
```
**Important**: LS Bounce Signal only works on 30min and below.
---
### ❓ Q2: Too many signals, confused
**A**: Enable filters
```
【Recommended Settings】
✅ Bonus Filter: ON
✅ Filter 6: ON
✅ ICT Market Structure Filter: ON
→ Show only Signal 0
```
This significantly reduces signal count.
---
### ❓ Q3: No CHoCH appearing, what to do?
**A**: Wait or check higher timeframe
```
Method 1: Wait for CHoCH (recommended)
Method 2: Check higher timeframe (e.g., Daily) for trend
Method 3: Disable ICT Filter (not recommended)
```
**When trend is unclear, sitting out is also strategy**.
---
### ❓ Q4: LS Bounce Signal not appearing
**A**: Checkpoints
```
1. Are you on 30min or below chart?
→ Doesn't show on 1H+
2. Are NPR/BB bands displayed?
→ Check Settings "Display 60min NPR Bands"
3. Is EMA50 excluded?
→ If "Exclude EMA50" is ON, EMA50 signals won't show
```
---
### ❓ Q5: Bar color not changing?
**A**: Check Filter 6
```
Settings → FINAL FILTERS
→ Confirm "Enable Filter 6 (OB/BB/NPR Zone Filter)" is ON
If ON but still not changing:
→ Current price may be outside OB/NPR/BB zones
```
---
### ❓ Q6: Too many Order Blocks, hard to see
**A**: Narrow down displayed OBs
```
Settings → ORDER BLOCK (OB) SETTINGS
Recommended:
❌ Show Current TF OB: OFF
❌ Show 1min OB: OFF
❌ Show 5min OB: OFF
✅ Show 15min OB: ON (only this)
```
---
### ❓ Q7: How to improve win rate?
**A**: Thorough multiple confirmations
```
Checklist:
✅ CHoCH appeared
✅ LS Bounce Signal (white text)
✅ Bar color matches (red bar=LONG, green bar=SHORT)
✅ Signal within Order Block
✅ Aligns with higher timeframe trend
Enter ONLY when all align
```
---
### ❓ Q8: Want to practice on demo
**A**: Recommended practice method
```
Week 1: Observation only
→ Watch signals and chart movement
→ Resist entering
Weeks 2-3: Keep records
→ Screenshot when signal appears
→ Record subsequent movement
Week 4+: Start demo trading
→ Start with small amounts
→ Continue keeping records
```
---
### ❓ Q9: Are there alert features?
**A**: Yes, multiple alerts available
```
Setup method:
1. Right-click indicator on chart
2. Select "Add Alert..."
3. Choose from:
- ANY ALERT: BUY/SELL Signals
- BUY ONLY ALERT
- SELL ONLY ALERT
- MS UP / MS DOWN
- BAR COLOR: RED / LIME
- LS BOUNCE: LONG / SHORT Signal
```
---
### ❓ Q10: Works on other markets?
**A**: Yes, works on all markets
```
✅ Cryptocurrency (BTC, ETH, etc.)
✅ Forex (EUR/USD, USD/JPY, etc.)
✅ Stocks (individual stocks, indices)
✅ Futures (oil, gold, etc.)
```
Works on any market with price and volume data.
---
## 📋 Disclaimer
### ⚠️ Important Notice
This indicator is for **educational and informational purposes only**.
```
❌ NOT investment advice
❌ Does NOT guarantee profits
❌ Past results do NOT guarantee future performance
```
### Risk Warning
```
⚠️ Trading involves substantial risk
⚠️ Only trade with funds you can afford to lose
⚠️ Practice extensively on demo account before live trading
⚠️ Make your own informed decisions and act at your own risk
```
---
## 📞 Support
### Feedback & Questions
Feel free to ask questions in TradingView comments section.
### Bug Reports
Please report with specific details (timeframe, symbol, screenshots).
---
**Author**: rasukaru666
**License**: Mozilla Public License 2.0
**Last Updated**: December 2025
**Version**: Latest
---
**Thank you for using Trend Gazer!**
**Happy Trading! 📈**
---------------

VV Moving Average Convergence Divergence # VMACDv3 - Volume-Weighted MACD with A/D Divergence Detection
## Overview
**VMACDv3** (Volume-Weighted Moving Average Convergence Divergence Version 3) is a momentum indicator that applies volume-weighting to traditional MACD calculations on price, while using the Accumulation/Distribution (A/D) line for divergence detection. This hybrid approach combines volume-weighted price momentum with volume distribution analysis for comprehensive market insight.
## Key Features
- **Volume-Weighted Price MACD**: Traditional MACD calculation on price but weighted by volume for earlier signals
- **A/D Divergence Detection**: Identifies when A/D trend diverges from MACD momentum
- **Volume Strength Filtering**: Distinguishes high-volume confirmations from low-volume noise
- **Color-Coded Histogram**: 4-color system showing momentum direction and volume strength
- **Real-Time Alerts**: Background colors and alert conditions for bullish/bearish divergences
## Difference from ACCDv3
| Aspect | VMACDv3 | ACCDv3 |
|--------|---------|---------|
| **MACD Input** | **Price (Close)** | **A/D Line** |
| **Volume Weighting** | Applied to price | Applied to A/D line |
| **Primary Signal** | Volume-weighted price momentum | Volume distribution momentum |
| **Use Case** | Price momentum with volume confirmation | Volume flow and accumulation/distribution |
| **Sensitivity** | More responsive to price changes | More responsive to volume patterns |
| **Best For** | Trend following, breakouts | Volume analysis, smart money tracking |
**Key Insight**: VMACDv3 shows *where price is going* with volume weight, while ACCDv3 shows *where volume is accumulating/distributing*.
## Components
### 1. Volume-Weighted MACD on Price
Unlike standard MACD that uses simple price EMAs, VMACDv3 weights each price by its corresponding volume:
```
Fast Line = EMA(Price × Volume, 12) / EMA(Volume, 12)
Slow Line = EMA(Price × Volume, 26) / EMA(Volume, 26)
MACD = Fast Line - Slow Line
```
**Benefits of Volume Weighting**:
- High-volume price movements have greater impact
- Filters out low-volume noise and false moves
- Provides earlier trend change signals
- Better reflects institutional activity
### 2. Accumulation/Distribution (A/D) Line
Used for divergence detection, measuring buying/selling pressure:
```
A/D = Σ ((2 × Close - Low - High) / (High - Low)) × Volume
```
- **Rising A/D**: Accumulation (buying pressure)
- **Falling A/D**: Distribution (selling pressure)
- **Doji Handling**: When High = Low, contribution is zero
### 3. Signal Lines
- **MACD Line** (Blue, #2962FF): The fast-slow difference showing momentum
- **Signal Line** (Orange, #FF6D00): EMA or SMA smoothing of MACD
- **Zero Line**: Reference for bullish (above) vs bearish (below) bias
### 4. Histogram Color System
The histogram uses 4 distinct colors based on **direction** and **volume strength**:
| Condition | Color | Meaning |
|-----------|-------|---------|
| Rising + High Volume | **Dark Green** (#1B5E20) | Strong bullish momentum with volume confirmation |
| Rising + Low Volume | **Light Teal** (#26A69A) | Bullish momentum but weak volume (less reliable) |
| Falling + High Volume | **Dark Red** (#B71C1C) | Strong bearish momentum with volume confirmation |
| Falling + Low Volume | **Light Pink** (#FFCDD2) | Bearish momentum but weak volume (less reliable) |
Additional shading:
- **Light Cyan** (#B2DFDB): Positive but not rising (momentum stalling)
- **Bright Red** (#FF5252): Negative and accelerating down
### 5. Divergence Detection
VMACDv3 compares A/D trend against volume-weighted price MACD:
#### Bullish Divergence (Green Background)
- **Condition**: A/D is trending up BUT MACD is negative and trending down
- **Interpretation**: Volume is accumulating while price momentum appears weak
- **Signal**: Smart money accumulation, potential bullish reversal
- **Action**: Look for long entries, especially at support levels
#### Bearish Divergence (Red Background)
- **Condition**: A/D is trending down BUT MACD is positive and trending up
- **Interpretation**: Volume is distributing while price momentum appears strong
- **Signal**: Smart money distribution, potential bearish reversal
- **Action**: Consider exits, avoid new longs, watch for breakdown
## Parameters
| Parameter | Default | Range | Description |
|-----------|---------|-------|-------------|
| **Source** | Close | OHLC/HLC3/etc | Price source for MACD calculation |
| **Fast Length** | 12 | 1-50 | Period for fast EMA (shorter = more sensitive) |
| **Slow Length** | 26 | 1-100 | Period for slow EMA (longer = smoother) |
| **Signal Smoothing** | 9 | 1-50 | Period for signal line (MACD smoothing) |
| **Signal Line MA Type** | EMA | SMA/EMA | Moving average type for signal calculation |
| **Volume MA Length** | 20 | 5-100 | Period for volume average (strength filter) |
## Usage Guide
### Reading the Indicator
1. **MACD Lines (Blue & Orange)**
- **Blue Line (MACD)**: Volume-weighted price momentum
- **Orange Line (Signal)**: Smoothed trend of MACD
- **Crossovers**: Blue crosses above orange = bullish, below = bearish
- **Distance**: Wider gap = stronger momentum
- **Zero Line Position**: Above = bullish bias, below = bearish bias
2. **Histogram Colors**
- **Dark Green (#1B5E20)**: Strong bullish move with high volume - **most reliable buy signal**
- **Light Teal (#26A69A)**: Bullish but low volume - wait for confirmation
- **Dark Red (#B71C1C)**: Strong bearish move with high volume - **most reliable sell signal**
- **Light Pink (#FFCDD2)**: Bearish but low volume - may be temporary dip
3. **Background Divergence Alerts**
- **Green Background**: A/D accumulating while price weak - potential bottom
- **Red Background**: A/D distributing while price strong - potential top
- Most powerful at key support/resistance levels
### Trading Strategies
#### Strategy 1: Volume-Confirmed Trend Following
1. Wait for MACD to cross above zero line
2. Look for **dark green** histogram bars (high volume confirmation)
3. Enter long on second consecutive dark green bar
4. Hold while histogram remains green
5. Exit when histogram turns light green or red appears
6. Set stop below recent swing low
**Example**:
```
Price: 26,400 → 26,450 (rising)
MACD: -50 → +20 (crosses zero)
Histogram: Light teal → Dark green → Dark green
Volume: 50k → 75k → 90k (increasing)
```
#### Strategy 2: Divergence Reversal Trading
1. Identify divergence background (green = bullish, red = bearish)
2. Confirm with price structure (support/resistance, chart patterns)
3. Wait for MACD to cross signal line in divergence direction
4. Enter on first **dark colored** histogram bar after divergence
5. Set stop beyond divergence area
6. Target previous swing high/low
**Example - Bullish Divergence**:
```
Price: Making lower lows (26,350 → 26,300 → 26,250)
A/D: Rising (accumulation)
MACD: Below zero but starting to curve up
Background: Green shading appears
Entry: MACD crosses signal line + dark green bar
Stop: Below 26,230
Target: 26,450 (previous high)
```
#### Strategy 3: Momentum Scalping
1. Trade only in direction of MACD zero line (above = long, below = short)
2. Enter on dark colored bars only
3. Exit on first light colored bar or opposite color
4. Quick in and out (1-5 minute holds)
5. Tight stops (0.2-0.5% depending on instrument)
#### Strategy 4: Histogram Pattern Trading
**V-Bottom Reversal (Bullish)**:
- Red histogram bars start rising (becoming less negative)
- Forms "V" shape at the bottom
- Transitions to light red → light teal → **dark green**
- Entry: First dark green bar
- Signal: Momentum reversal with volume
**Λ-Top Reversal (Bearish)**:
- Green histogram bars start falling (becoming less positive)
- Forms inverted "V" at the top
- Transitions to light green → light pink → **dark red**
- Entry: First dark red bar
- Signal: Momentum exhaustion with volume
### Multi-Timeframe Analysis
**Recommended Approach**:
1. **Higher Timeframe (15m/1h)**: Identify overall trend direction
2. **Trading Timeframe (5m)**: Time entries using VMACDv3 signals
3. **Lower Timeframe (1m)**: Fine-tune entry prices
**Example Setup**:
```
15-minute: MACD above zero (bullish bias)
5-minute: Dark green histogram appears after pullback
1-minute: Enter on break of recent high with volume
```
### Volume Strength Interpretation
The volume filter compares current volume to 20-period average:
- **Volume > Average**: Dark colors (green/red) - high confidence signals
- **Volume < Average**: Light colors (teal/pink) - lower confidence signals
**Trading Rules**:
- ✓ **Aggressive**: Take all dark colored signals
- ✓ **Conservative**: Only take dark colors that follow 2+ light colors of same type
- ✗ **Avoid**: Trading light colored signals during high volatility
- ✗ **Avoid**: Ignoring volume context during news events
## Technical Details
### Volume-Weighted Calculation
```pine
// Volume-weighted fast EMA
fast_ma = ta.ema(src * volume, fast_length) / ta.ema(volume, fast_length)
// Volume-weighted slow EMA
slow_ma = ta.ema(src * volume, slow_length) / ta.ema(volume, slow_length)
// MACD is the difference
macd = fast_ma - slow_ma
// Signal line smoothing
signal = ta.ema(macd, signal_length) // or ta.sma() if SMA selected
// Histogram
hist = macd - signal
```
### Divergence Detection Logic
```pine
// A/D trending up if above its 5-period SMA
ad_trend = ad > ta.sma(ad, 5)
// MACD trending up if above zero
macd_trend = macd > 0
// Divergence when trends oppose each other
divergence = ad_trend != macd_trend
// Specific conditions for alerts
bullish_divergence = ad_trend and not macd_trend and macd < 0
bearish_divergence = not ad_trend and macd_trend and macd > 0
```
### Histogram Coloring Logic
```pine
hist_color = (hist >= 0
? (hist < hist
? (vol_strength ? #1B5E20 : #26A69A) // Rising: dark/light green
: #B2DFDB) // Positive but falling: cyan
: (hist < hist
? (vol_strength ? #B71C1C : #FFCDD2) // Rising (less negative): dark/light red
: #FF5252)) // Falling more: bright red
```
## Alerts
Built-in alert conditions for divergence detection:
### Bullish Divergence Alert
- **Trigger**: A/D trending up, MACD negative and trending down
- **Message**: "Bullish Divergence: A/D trending up but MACD trending down"
- **Use Case**: Potential reversal or continuation after pullback
- **Action**: Look for long entry setups
### Bearish Divergence Alert
- **Trigger**: A/D trending down, MACD positive and trending up
- **Message**: "Bearish Divergence: A/D trending down but MACD trending up"
- **Use Case**: Potential top or trend reversal
- **Action**: Consider exits or short entries
### Setting Up Alerts
1. Click "Create Alert" in TradingView
2. Condition: Select "VMACDv3"
3. Choose alert type: "Bullish Divergence" or "Bearish Divergence"
4. Configure: Email, SMS, webhook, or popup
5. Set frequency: "Once Per Bar Close" recommended
## Comparison Tables
### VMACDv3 vs Standard MACD
| Feature | Standard MACD | VMACDv3 |
|---------|---------------|---------|
| **Price Weighting** | Equal weight all bars | Volume-weighted |
| **Sensitivity** | Fixed | Adaptive to volume |
| **False Signals** | More during low volume | Fewer (volume filter) |
| **Divergence** | Price vs MACD | A/D vs MACD |
| **Volume Analysis** | None | Built-in |
| **Color System** | 2 colors | 4+ colors |
| **Best For** | Simple trend following | Volume-confirmed trading |
### VMACDv3 vs ACCDv3
| Aspect | VMACDv3 | ACCDv3 |
|--------|---------|--------|
| **Focus** | Price momentum | Volume distribution |
| **Reactivity** | Faster to price moves | Faster to volume shifts |
| **Best Markets** | Trending, breakouts | Accumulation/distribution phases |
| **Signal Type** | Where price + volume going | Where smart money positioning |
| **Divergence Meaning** | Volume vs price disagreement | A/D vs momentum disagreement |
| **Use Together?** | ✓ Yes, complementary | ✓ Yes, different perspectives |
## Example Trading Scenarios
### Scenario 1: Strong Bullish Breakout
```
Time: 9:30 AM (market open)
Price: Breaks above 26,400 resistance
MACD: Crosses above zero line
Histogram: Dark green bars (#1B5E20)
Volume: 2x average (150k vs 75k avg)
A/D: Rising (no divergence)
Action: Enter long at 26,405
Stop: 26,380 (below breakout)
Target 1: 26,450 (risk:reward 1:2)
Target 2: 26,500 (risk:reward 1:4)
Result: High probability setup with volume confirmation
```
### Scenario 2: False Breakout (Avoided)
```
Time: 2:30 PM (slow period)
Price: Breaks above 26,400 resistance
MACD: Slightly positive
Histogram: Light teal bars (#26A69A)
Volume: 0.5x average (40k vs 75k avg)
A/D: Flat/declining
Action: Avoid trade
Reason: Low volume, no conviction, potential false breakout
Outcome: Price reverses back below 26,400 within 10 minutes
Saved: Avoided losing trade due to volume filter
```
### Scenario 3: Bullish Divergence Bottom
```
Time: 11:00 AM
Price: Making lower lows (26,350 → 26,300 → 26,280)
MACD: Below zero but curving upward
Histogram: Red bars getting shorter (V-bottom forming)
Background: Green shading (divergence alert)
A/D: Rising despite price falling
Volume: Increasing on down bars
Setup:
1. Divergence appears at 26,280 (green background)
2. Wait for MACD to cross signal line
3. First dark green bar appears at 26,290
4. Enter long: 26,295 (next bar open)
5. Stop: 26,265 (below divergence low)
6. Target: 26,350 (previous swing high)
Result: +55 points (30 point risk, 1.8:1 reward)
Key: Divergence + volume confirmation = high probability reversal
```
### Scenario 4: Bearish Divergence Top
```
Time: 1:45 PM
Price: Making higher highs (26,500 → 26,520 → 26,540)
MACD: Positive but flattening
Histogram: Green bars getting shorter (Λ-top forming)
Background: Red shading (bearish divergence)
A/D: Declining despite rising price
Volume: Decreasing on up bars
Setup:
1. Bearish divergence at 26,540 (red background)
2. MACD crosses below signal line
3. First dark red bar appears at 26,535
4. Enter short: 26,530
5. Stop: 26,555 (above divergence high)
6. Target: 26,475 (support level)
Result: +55 points (25 point risk, 2.2:1 reward)
Key: Distribution while price rising = smart money exiting
```
### Scenario 5: V-Bottom Reversal
```
Downtrend in progress
MACD: Deep below zero (-150)
Histogram: Series of dark red bars
Pattern Development:
Bar 1: Dark red, hist = -80, falling
Bar 2: Dark red, hist = -95, falling
Bar 3: Dark red, hist = -100, falling (extreme)
Bar 4: Light pink, hist = -98, rising!
Bar 5: Light pink, hist = -90, rising
Bar 6: Light teal, hist = -75, rising (crosses to positive momentum)
Bar 7: Dark green, hist = -55, rising + volume
Action: Enter long on Bar 7
Reason: V-bottom confirmed with volume
Stop: Below Bar 3 low
Target: Zero line on histogram (mean reversion)
```
## Best Practices
### Entry Rules
✓ **Wait for dark colors**: High-volume confirmation is key
✓ **Confirm divergences**: Use with price support/resistance
✓ **Trade with zero line**: Long above, short below for best odds
✓ **Multiple timeframes**: Align 1m, 5m, 15m signals
✓ **Watch for patterns**: V-bottoms and Λ-tops are reliable
### Exit Rules
✓ **Partial profits**: Take 50% at first target
✓ **Trail stops**: Use histogram color changes
✓ **Respect signals**: Exit on opposite dark color
✓ **Time stops**: Close positions before major news
✓ **End of day**: Square up before close
### Avoid
✗ **Don't chase light colors**: Low volume = low confidence
✗ **Don't ignore divergence**: Early warning system
✗ **Don't overtrade**: Wait for clear setups
✗ **Don't fight the trend**: Zero line dictates bias
✗ **Don't skip stops**: Always use risk management
## Risk Management
### Position Sizing
- **Dark green/red signals**: 1-2% account risk
- **Light signals**: 0.5% account risk or skip
- **Divergence plays**: 1% account risk (higher uncertainty)
- **Multiple confirmations**: Up to 2% account risk
### Stop Loss Placement
- **Trend trades**: Below/above recent swing (20-30 points typical)
- **Breakout trades**: Below/above breakout level (15-25 points)
- **Divergence trades**: Beyond divergence extreme (25-40 points)
- **Scalp trades**: Tight stops at 10-15 points
### Profit Targets
- **Minimum**: 1.5:1 reward to risk ratio
- **Scalps**: 15-25 points (quick in/out)
- **Swing**: 50-100 points (hold through pullbacks)
- **Runners**: Trail with histogram color changes
## Timeframe Recommendations
| Timeframe | Trading Style | Typical Hold | Advantages | Challenges |
|-----------|---------------|--------------|------------|------------|
| **1-minute** | Scalping | 1-5 minutes | Fast profits, many setups | Noisy, high false signals |
| **5-minute** | Intraday | 15-60 minutes | Balance of speed/clarity | Still requires quick decisions |
| **15-minute** | Swing | 1-4 hours | Clearer trends, less noise | Fewer opportunities |
| **1-hour** | Position | 4-24 hours | Strong signals, less monitoring | Wider stops required |
**Recommendation**: Start with 5-minute for best balance of signal quality and opportunity frequency.
## Combining with Other Indicators
### VMACDv3 + ACCDv3
- **Use**: Confirm volume flow with price momentum
- **Signal**: Both showing dark green = highest conviction long
- **Divergence**: VMACDv3 bullish + ACCDv3 bearish = examine price action
### VMACDv3 + RSI
- **Use**: Overbought/oversold with momentum confirmation
- **Signal**: RSI < 30 + dark green VMACD = strong reversal
- **Caution**: RSI > 70 + light green VMACD = potential false breakout
### VMACDv3 + Elder Impulse
- **Use**: Bar coloring + histogram confirmation
- **Signal**: Green Elder bars + dark green VMACD = aligned momentum
- **Exit**: Blue Elder bars + light colors = momentum stalling
## Limitations
- **Requires volume data**: Will not work on instruments without volume feed
- **Lagging indicator**: MACD inherently follows price (2-3 bar delay)
- **Consolidation noise**: Generates false signals in tight ranges
- **Gap handling**: Large gaps can distort volume-weighted values
- **Not standalone**: Should combine with price action and support/resistance
## Troubleshooting
**Problem**: Too many light colored signals
**Solution**: Increase Volume MA Length to 30-40 for stricter filtering
**Problem**: Missing entries due to waiting for dark colors
**Solution**: Lower Volume MA Length to 10-15 for more signals (accept lower quality)
**Problem**: Divergences not appearing
**Solution**: Verify volume data available; check if A/D line is calculating
**Problem**: Histogram colors not changing
**Solution**: Ensure real-time data feed; refresh indicator
## Version History
- **v3**: Removed traditional MACD, using volume-weighted MACD on price with A/D divergence
- **v2**: Added A/D divergence detection, volume strength filtering, enhanced histogram colors
- **v1**: Basic volume-weighted MACD on price
## Related Indicators
**Companion Tools**:
- **ACCDv3**: Volume-weighted MACD on A/D line (distribution focus)
- **RSIv2**: RSI with A/D divergence detection
- **DMI**: Directional Movement Index with A/D divergence
- **Elder Impulse**: Bar coloring system using volume-weighted MACD
**Use Together**: VMACDv3 (momentum) + ACCDv3 (distribution) + Elder Impulse (bar colors) = complete volume-based trading system
---
*This indicator is for educational purposes. Past performance does not guarantee future results. Always practice proper risk management and never risk more than you can afford to lose.*
