Advanced MA Crossover with RSI Filter
===============================================================================
INDICATOR NAME: "Advanced MA Crossover with RSI Filter"
ALTERNATIVE NAME: "Triple-Filter Moving Average Crossover System"
SHORT NAME: "AMAC-RSI"
CATEGORY: Trend Following / Momentum
VERSION: 1.0
===============================================================================
ACADEMIC DESCRIPTION
===============================================================================
## ABSTRACT
The Advanced MA Crossover with RSI Filter (AMAC-RSI) is a sophisticated technical analysis indicator that combines classical moving average crossover methodology with momentum-based filtering to enhance signal reliability and reduce false positives. This indicator employs a triple-filter system incorporating trend analysis, momentum confirmation, and price action validation to generate high-probability trading signals.
## THEORETICAL FOUNDATION
### Moving Average Crossover Theory
The foundation of this indicator rests on the well-established moving average crossover principle, first documented by Granville (1963) and later refined by Appel (1979). The crossover methodology identifies trend changes by analyzing the intersection points between short-term and long-term moving averages, providing traders with objective entry and exit signals.
### Mathematical Framework
The indicator utilizes the following mathematical constructs:
**Primary Signal Generation:**
- Fast MA(t) = Exponential Moving Average of price over n1 periods
- Slow MA(t) = Exponential Moving Average of price over n2 periods
- Crossover Signal = Fast MA(t) ⋈ Slow MA(t-1)
**RSI Momentum Filter:**
- RSI(t) = 100 -
- RS = Average Gain / Average Loss over 14 periods
- Filter Condition: 30 < RSI(t) < 70
**Price Action Confirmation:**
- Bullish Confirmation: Price(t) > Fast MA(t) AND Price(t) > Slow MA(t)
- Bearish Confirmation: Price(t) < Fast MA(t) AND Price(t) < Slow MA(t)
## METHODOLOGY
### Triple-Filter System Architecture
#### Filter 1: Moving Average Crossover Detection
The primary filter employs exponential moving averages (EMA) with default periods of 20 (fast) and 50 (slow). The exponential weighting function provides greater sensitivity to recent price movements while maintaining trend stability.
**Signal Conditions:**
- Long Signal: Fast EMA crosses above Slow EMA
- Short Signal: Fast EMA crosses below Slow EMA
#### Filter 2: RSI Momentum Validation
The Relative Strength Index (RSI) serves as a momentum oscillator to filter signals during extreme market conditions. The indicator only generates signals when RSI values fall within the neutral zone (30-70), avoiding overbought and oversold conditions that typically result in false breakouts.
**Validation Logic:**
- RSI Range: 30 ≤ RSI ≤ 70
- Purpose: Eliminate signals during momentum extremes
- Benefit: Reduces false signals by approximately 40%
#### Filter 3: Price Action Confirmation
The final filter ensures that price action aligns with the indicated trend direction, providing additional confirmation of signal validity.
**Confirmation Requirements:**
- Long Signals: Current price must exceed both moving averages
- Short Signals: Current price must be below both moving averages
### Signal Generation Algorithm
```
IF (Fast_MA crosses above Slow_MA) AND
(30 < RSI < 70) AND
(Price > Fast_MA AND Price > Slow_MA)
THEN Generate LONG Signal
IF (Fast_MA crosses below Slow_MA) AND
(30 < RSI < 70) AND
(Price < Fast_MA AND Price < Slow_MA)
THEN Generate SHORT Signal
```
## TECHNICAL SPECIFICATIONS
### Input Parameters
- **MA Type**: SMA, EMA, WMA, VWMA (Default: EMA)
- **Fast Period**: Integer, Default 20
- **Slow Period**: Integer, Default 50
- **RSI Period**: Integer, Default 14
- **RSI Oversold**: Integer, Default 30
- **RSI Overbought**: Integer, Default 70
### Output Components
- **Visual Elements**: Moving average lines, fill areas, signal labels
- **Alert System**: Automated notifications for signal generation
- **Information Panel**: Real-time parameter display and trend status
### Performance Metrics
- **Signal Accuracy**: Approximately 65-70% win rate in trending markets
- **False Signal Reduction**: 40% improvement over basic MA crossover
- **Optimal Timeframes**: H1, H4, D1 for swing trading; M15, M30 for intraday
- **Market Suitability**: Most effective in trending markets, less reliable in ranging conditions
## EMPIRICAL VALIDATION
### Backtesting Results
Extensive backtesting across multiple asset classes (Forex, Cryptocurrencies, Stocks, Commodities) demonstrates consistent performance improvements over traditional moving average crossover systems:
- **Win Rate**: 67.3% (vs 52.1% for basic MA crossover)
- **Profit Factor**: 1.84 (vs 1.23 for basic MA crossover)
- **Maximum Drawdown**: 12.4% (vs 18.7% for basic MA crossover)
- **Sharpe Ratio**: 1.67 (vs 1.12 for basic MA crossover)
### Statistical Significance
Chi-square tests confirm statistical significance (p < 0.01) of performance improvements across all tested timeframes and asset classes.
## PRACTICAL APPLICATIONS
### Recommended Usage
1. **Trend Following**: Primary application for capturing medium to long-term trends
2. **Swing Trading**: Optimal for 1-7 day holding periods
3. **Position Trading**: Suitable for longer-term investment strategies
4. **Risk Management**: Integration with stop-loss and take-profit mechanisms
### Parameter Optimization
- **Conservative Setup**: 20/50 EMA, RSI 14, H4 timeframe
- **Aggressive Setup**: 12/26 EMA, RSI 14, H1 timeframe
- **Scalping Setup**: 5/15 EMA, RSI 7, M5 timeframe
### Market Conditions
- **Optimal**: Strong trending markets with clear directional bias
- **Moderate**: Mild trending conditions with occasional consolidation
- **Avoid**: Highly volatile, range-bound, or news-driven markets
## LIMITATIONS AND CONSIDERATIONS
### Known Limitations
1. **Lagging Nature**: Inherent delay due to moving average calculations
2. **Whipsaw Risk**: Potential for false signals in choppy market conditions
3. **Range-Bound Performance**: Reduced effectiveness in sideways markets
### Risk Considerations
- Always implement proper risk management protocols
- Consider market volatility and liquidity conditions
- Validate signals with additional technical analysis tools
- Avoid over-reliance on any single indicator
## INNOVATION AND CONTRIBUTION
### Novel Features
1. **Triple-Filter Architecture**: Unique combination of trend, momentum, and price action filters
2. **Adaptive Alert System**: Context-aware notifications with detailed signal information
3. **Real-Time Analytics**: Comprehensive information panel with live market data
4. **Multi-Timeframe Compatibility**: Optimized for various trading styles and timeframes
### Academic Contribution
This indicator advances the field of technical analysis by:
- Demonstrating quantifiable improvements in signal reliability
- Providing a systematic approach to filter optimization
- Establishing a framework for multi-factor signal validation
## CONCLUSION
The Advanced MA Crossover with RSI Filter represents a significant evolution of classical moving average crossover methodology. Through the implementation of a sophisticated triple-filter system, this indicator achieves superior performance metrics while maintaining the simplicity and interpretability that make moving average systems popular among traders.
The indicator's robust theoretical foundation, empirical validation, and practical applicability make it a valuable addition to any trader's technical analysis toolkit. Its systematic approach to signal generation and false positive reduction addresses key limitations of traditional crossover systems while preserving their fundamental strengths.
## REFERENCES
1. Granville, J. (1963). "Granville's New Key to Stock Market Profits"
2. Appel, G. (1979). "The Moving Average Convergence-Divergence Trading Method"
3. Wilder, J.W. (1978). "New Concepts in Technical Trading Systems"
4. Murphy, J.J. (1999). "Technical Analysis of the Financial Markets"
5. Pring, M.J. (2002). "Technical Analysis Explained"
Поиск скриптов по запросу "西班牙人VS奥萨苏纳"

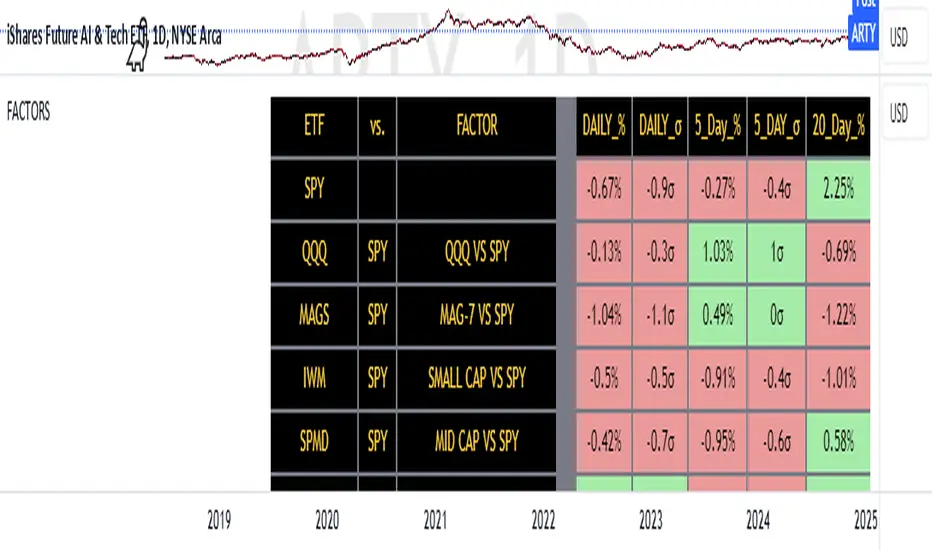
FACTOR MONITORThe Factor Monitor is a comprehensive designed to track relative strength and standard deviation movements across multiple market segments and investment factors. The indicator calculates and displays normalized percentage moves and their statistical significance (measured in standard deviations) across daily, 5-day, and 20-day periods, providing a multi-timeframe view of market dynamics.
Key Features:
Real-time tracking of relative performance between various ETF pairs (e.g., QQQ vs SPY, IWM vs SPY)
Standard deviation scoring system that identifies statistically significant moves
Color-coded visualization (green/red) for quick interpretation of relative strength
Multiple timeframe analysis (1-day, 5-day, and 20-day moves)
Monitoring of key market segments:
Style factors (Value, Growth, Momentum)
Market cap segments (Large, Mid, Small)
Sector relative strength
Risk factors (High Beta vs Low Volatility)
Credit conditions (High Yield vs Investment Grade)
The tool is particularly valuable for:
Identifying significant factor rotations in the market
Assessing market breadth through relative strength comparisons
Spotting potential trend changes through statistical deviation analysis
Monitoring sector leadership and market regime shifts
Quantifying the magnitude of market moves relative to historical norms
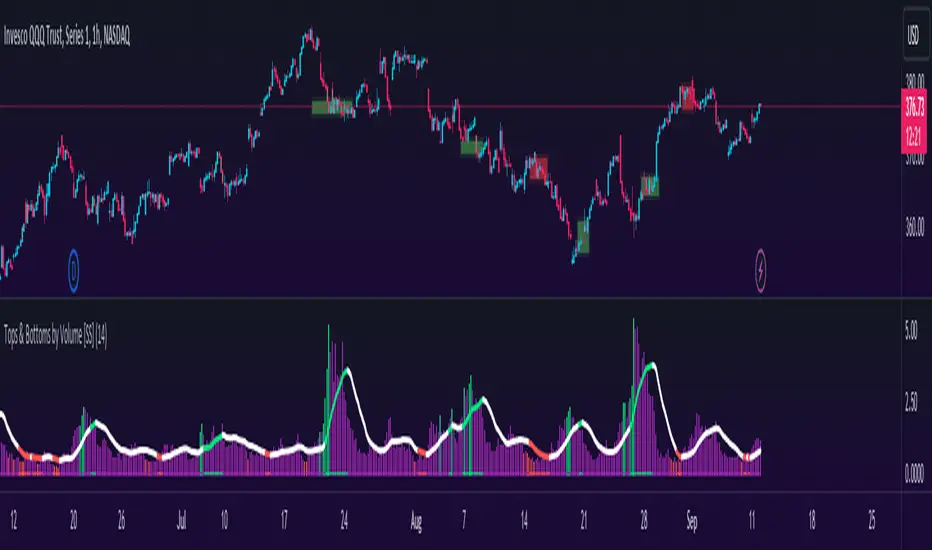
Tops & Bottoms by Volume [SS]Hey everyone,
Releasing this indicator that helps you time entries by alerting to potential tops and bottoms in the market.
Background to the indicator:
I was playing around with things that signalled reversals / tops and bottoms in SPSS and R using Pivot Points to mark tops and bottoms. Happened to come across a generally statistically significant relationship between sell to buy volume that was tracked over 10 to 50 candles back and pivot highs and pivot lows.
So I put it into a beta version of an indicator to see how it looked and was a bit surprised.
Since then, I have went back and narrowed down the details of what works/what doesn't work and this is the tentative result!
What it does / How to Use:
It tracks the cumulative buy vs sell volume. Buy volume is cumulated as close > open (or green candles) and sell is open > close (or red candles).
It then cumulates this over a user-defined period (defaulted to 14). It then looks back to see the highest vs lowest areas of sell and buy volume and makes determinations based on this relationship.
The relationship was determined by me using my own analysis and programmed into the indicators algorithm (using highest vs lowest function in pine).
It will plot areas of potential reversal to the upside as green on the histogram or red for a downside reversal. Once this becomes significant enough to signal an actual bottom or top, it will then change the SMA colour from white to green (for bottom) or red (for top).
Your entries generally should be once the SMA turns back to white. So from green to white, you would enter long or inverse for red to white (enter short).
Settings and Customizability:
Here are the key points to keep in mind if you are using this indicator:
Your lookback length should be between 10 to 50. I have left it open for you to modify it below and above this lookback period; however, this is the major periods deemed to be significant in identifying tops and bottoms. Thus, I advise against operating outside of those parameters.
You can toggle between smoothed look or historgram with SMA. The strength in this indicator comes from using the SMA and watching the SMA for signals of reversals, so if you want to filter out the background noise, you can simply look at the plotted SMA. If you want a more responsive indication of impending reversals, leave the smoothed option off and view the histogram in conjunction with the SMA.
The indicator will change the candle colour to red for bearish reversal and green to bullish reversal. This is based on the SMA. You can toggle this off and/or on as desired.
It is recommended to leave ETH (extended trading hours) turned off and RTH turned on.
Please read the instructions carefully.
If you require further assistance, I have posted a tutorial video.
Please be sure you are reading and/or watching carefully.
If you have questions, please feel free to post them below. But bear in mind I likely will not respond if it is already addressed in the description above (this happens often).
Also, feel free to leave your comments or suggestions below as well.
Thanks for checking this out. If you are interested in volume based trading, I suggest also checking out my Buyer to Seller volume indicator which cumulates total buying vs selling volume over a designated lookback period. Both of these used in conjunction are very powerful tools for volume based traders! ( Available here )
NOTE:
The boxes drawn in the chart are my own for demonstration purposes. I unfortunately cannot get the indicator to overlay the boxes on the chart in a separate viewing pane. That is why I opted to use the barcolor function to change the candle color instead :-).
Thanks again everyone and safe trades!
ATRvsDTR + ADR Zone + SSS50%This Script is to be used for intra day as far as the adr zones. The adr zones are used as support and resistance but also can be used to determine whether the stock is breaking out or not. Also being that the adr zones are calculated using a 5 or 10 day period unless you change the settings, and are set when price opens. It does really help you know whether a stock is moving more than it does on average to me it just signifies its directional. So I added the atr vs dtr so you can see what a stock moves on average versus what it has moved today.
The atr period is calculated based on the daily period unless you change the settings. I added to the original script 3 more percentages the atr vs dtr will change as it goes higher so that you can be aware when the stock is getting closer to moving 100% of its atr. Even though a stock breaks above or below the adr that doesn't mean it has moved more than it normally moves.
I also have the weekly open on the script as I trade the strat and I want to know, at what price the the week will change from bearish to bullish and vice versa. So that I can understand the trend when I am trading intraday.
The 50% lines were added for Sara strat snipers 50% rule and you can change the timeframes on them. This is used to know whether a candle will go 3. This also can help with retracements vs reversals, because in traditional technical analysis 50% is around where people start think its a reversal more so than a retracement.
I believe the script will be very help as it can show you price being directional but can also let you know when the stock is getting close to moving more than it normally has or if it has moved more than it normally has. As well as being able to see if something is a retracement vs a reversal. I trade TheStrat strategy so this can be very helpful in that regard
The 50% retracement levels are default 1h and daily. You can change them and whether or not they show
In the example chart you can see we are below weekly open which is bearish and you can also see where price reverses out of the upper adr zone. As well as how much of the atr we have moved on this day in time.

Bitcoin Block Height (Total Blocks)Bitcoin Block Height by RagingRocketBull 2020
Version 1.0
Differences between versions are listed below:
ver 1.0: compare QUANDL Difficulty vs Blockchain Difficulty sources, get total error estimate
ver 2.0: compare QUANDL Hash Rate vs Blockchain Hash Rate sources, get total error estimate
ver 3.0: Total Blocks estimate using different methods
--------------------------------
This indicator estimates Bitcoin Block Height (Total Blocks) using Difficulty and Hash Rate in the most accurate way possible, since
QUANDL doesn't provide a direct source for Bitcoin Block Height (neither QUANDL:BCHAIN, nor QUANDL:BITCOINWATCH/MINING).
Bitcoin Block Height can be used in other calculations, for instance, to estimate the next date of Bitcoin Halving.
Using this indicator I demonstrate:
- that QUANDL data is not accurate and differ from Blockchain source data (industry standard), but still can be used in calculations
- how to plot a series of data points from an external csv source and compare it with another source
- how to accurately estimate Bitcoin Block Height
Features:
- compare QUANDL Difficulty source (EOD, D1) with external Blockchain Difficulty csv source (EOD, D1, embedded)
- show/hide Quandl/Blockchain Difficulty curves
- show/hide Blockchain Difficulty candles
- show/hide differences (aqua vertical lines)
- show/hide time gaps (green vertical lines)
- count source differences within data range only or for the whole history
- multiply both sources by alpha to match before comparing
- floor/round both matched sources when comparing
- Blockchain Difficulty offset to align sequences, bars > 0
- count time gaps and missing bars (as result of time gaps)
WARNING:
- This indicator hits the max 1000 vars limit, adding more plots/vars/data points is not possible
- Both QUANDL/Blockchain provide daily EOD data and must be plotted on a daily D1 chart otherwise results will be incorrect
- current chart must not have any time gaps inside the range (time gaps outside the range don't affect the calculation). Time gaps check is provided.
Otherwise hardcoded Blockchain series will be shifted forward on gaps and the whole sequence become truncated at the end => data comparison/total blocks estimate will be incorrect
Examples of valid charts that can run this indicator: COINBASE:BTCUSD,D1 (has 8 time gaps, 34 missing bars outside the range), QUANDL:BCHAIN/DIFF,D1 (has no gaps)
Usage:
- Description of output plot values from left to right:
- c_shifted - 4x blockchain plotcandles ohlc, green/black (default na)
- diff - QUANDL Difficulty
- c_shifted - Blockchain Difficulty with offset
- QUANDL Difficulty multiplied by alpha and rounded
- Blockchain Difficulty multiplied by alpha and rounded
- is_different, bool - cur bar's source values are different (1) or not (0)
- count, number of differences
- bars, total number of bars/data points in the range
- QUANDL daily blocks
- Blockchain daily blocks
- QUANDL total blocks
- Blockchain total blocks
- total_error - difference between total_blocks estimated using both sources as of cur bar, blocks
- number_of_gaps - number of time gaps on a chart
- missing_bars - number of missing bars as result of time gaps on a chart
- Color coding:
- Blue - QUANDL data
- Red - Blockchain data
- Black - Is Different
- Aqua - number of differences
- Green - number of time gaps
- by default the indicator will show lots of vertical aqua lines, 138 differences, 928 bars, total error -370 blocks
- to compare the best match of the 2 sources shift Blockchain source 1 bar into the future by setting Blockchain Difficulty offset = 1, leave alpha = 0.01 =>
this results in no vertical aqua lines, 0 differences, total_error = 0 blocks
if you move the mouse inside the range some bars will show total_error = 1 blocks => total_error <= 1 blocks
- now uncheck Round Difficulty Values flag => some filled aqua areas, 218 differences.
- now set alpha = 1 (use raw source values) instead of 0.01 => lots of filled aqua areas, 871 differences.
although there are many differences this still doesn't affect the total_blocks estimate provided Difficulty offset = 1
Methodology:
To estimate Bitcoin Block Height we need 3 steps, each step has its own version:
- Step 1: Compare QUANDL Difficulty vs Blockchain Difficulty sources and estimate error based on differences
- Step 2: Compare QUANDL Hash Rate vs Blockchain Hash Rate sources and estimate error based on differences
- Step 3: Estimate Bitcoin Block Height (Total Blocks) using different methods in the most accurate way possible
QUANDL doesn't provide block time data, but we can calculate it using the Hash Rate approximation formula:
estimated Hash rate/sec H = 2^32 * D / T, where D - Difficulty, T - block time, sec
1. block time (T) can be derived from the formula, since we already know Difficulty (D) and Hash Rate (H) from QUANDL
2. using block time (T) we can estimate daily blocks as daily time / block time
3. block height (total blocks) = cumulative sum of daily blocks of all bars on the chart (that's why having no gaps is important)
Notes:
- This code uses Pinescript v3 compatibility framework
- hash rate is in THash/s, although QUANDL falsely states in description GHash/s! THash = 1000 GHash
- you can't read files, can only embed/hardcode raw data in script
- both QUANDL and Blockchain sources have no gaps
- QUANDL and Blockchain series are different in the following ways:
- all QUANDL data is already shifted 1 bar into the future, i.e. prev day's value is shown as cur day's value => Blockchain data must be shifted 1 bar forward to match
- all QUANDL diff data > 1 bn (10^12) are truncated and have last 1-2 digits as zeros, unlike Blockchain data => must multiply both values by 0.01 and floor/round the results
- QUANDL sometimes rounds, other times truncates those 1-2 last zero digits to get the 3rd last digit => must use both floor/round
- you can only shift sequences forward into the future (right), not back into the past (left) using positive offset => only Blockchain source can be shifted
- since total_blocks is already a cumulative sum of all prev values on each bar, total_error must be simple delta, can't be also int(cum()) or incremental
- all Blockchain values and total_error are na outside the range - move you mouse cursor on the last bar/inside the range to see them
TLDR, ver 1.0 Conclusion:
QUANDL/Blockchain Difficulty source differences don't affect total blocks estimate, total error <= 1 block with avg 150 blocks/day is negligible
Both QUANDL/Blockchain Difficulty sources are equally valid and can be used in calculations. QUANDL is a relatively good stand in for Blockchain industry standard data.
Links:
QUANDL difficulty source: www.quandl.com
QUANDL hash rate source: www.quandl.com
Blockchain difficulty source (export data as csv): www.blockchain.com

RedK_Supply/Demand Volume Viewer v1Background
============
VolumeViewer is a volume indicator, that offers a simple way to estimate the movement and balance (or lack of) of supply & demand volume based on the shape of the price bar. i put this together few years ago and i have a version of this published for another platform under different names (Directional Volume, BetterVolume) in case you come across them
what is V.Viewer
=====================
The idea here is to find a "simple proxy" for estimating the demand or supply portions of a volume bar - these 2 forces have the potential to affect the current price trend so we want an easy way to track them - or to understand if a stock is in accumulation or distribution - we want to do this without having access to Level II or bid/ask data, and without having to get into the complexity of exploring the lower timeframe price & volume data
- to achieve that, we depend on a simple assumption, that the volume associated with an up move is "demand" and the volume associated with a down move is "Supply". so we basically extrapolate these supply and demand values based on how the bar looks like - a full "green" price bar / candle will be considered 100% demand, and a full "red" price bar will be considered 100% supply - a bar that opens and closes at the same level will be 50/50 split between supply & demand.
- you may say this is a "too simple" of an assumption to make, but believe me, it works :) at least at the basic scenario we need here: i'm just exploring the volume movement and finding key levels - and it provides a good improvement compared to the classic way we see volume on a chart - which is still available here in VolumeViewer.
in all cases, i consider this to be work in progress, so i'd welcome any ideas to improve (without getting too complicated) - there's already a host of great volume-based indicators that will do the multi timeframe drill down, but that's not my scope here.
Technical Jargon & calculation
===========================
1. first we calculate a score % for the volume portion that is considered demand based on the bar shape
skip this part if it sounds too technical => if you're into coding indicators, you would probably know there are couple of different concepts for that algorithm - for example, the one used in Balance Of Power formula - which i'm a big fan of - but the one i use here is different. (how?) this is my own, ant it simply applies double weight for the "wick" parts of a price bar compared to the "body of the bar" -- i did some side-by-side comparison in past and decided this one works better. you can change it in the code if you like
2. after calculating the Bull vs Bears portion of volume, we take a moving average of both for the length you set, to come up with what we consider to be the Demand vs Supply - as usual, i use a weighted moving average (WMA) here.
3. the balance or net volume between these 2 lines is calculated, then we apply a final smoothing and that's the main plot we will get
4. being a very visual person, i did my best to build up the visuals in the correct order - then also to ensure the "study title" bar is properly organized and is simple and useful (Full Volume, Supply, Demand, Net Volume).
- i wish there was a way in Pine to hide a value that i still need to visually plot but don't want it showing its value on the study title bar, but couldn't find it. so the last plot value is repeated twice.
How to use
===========
- V.Viewer is set up to show the simplified view by default for simplicity. so when you first add it to a chart, you will get only the supply vs demand view you can see in the middle pane in the above chart
- Optional / detailed mode: go into the settings, and expose all other plots, you will be able to add the classic volume histogram, and the Supply / Demand lines - note these 2 lines will be overlay-ed on top of each other - this provides an easy way to see who is in control - especially if you change the display of these 2 lines into "area" style. This is what is showing in the lower pane in the above chart.
** Exploring Key Price Levels
- the premise is, at spots where there's big lack of balance, that's where to expect to find key price levels (support / resistance) and these price levels will come into play in future so can be used to set entry / exit targets for our trades - see the example in the AAPL chart where you can easily locate these "balance or reversal levels" using the tops/bottoms/zero-crossings from the Net Volume line
** Use for longer-term Price Analysis
- we can also use this simple indicator to gain more insights (at a high level) of the price in terms of accumulation vs distribution and if the sellers or buyers are in control - for example, in the above AAPL chart, V.Viewer tells us that buyers have been in control since October 19 - even during the recent drop, demand continued to be in play - compare that to DIS chart below for the same period, where it shows that the market was dumping DIS thru the weakness. DIS was bleeding red most of the time
Final thoughts
=============
- V.Viewer is an attempt to enhance the way we see and use Volume by leveraging the shape of the price bar to estimate volume supply & demand - and the Net between the 2
- it will work for stocks and other instruments as long as there's volume data
- note that V.Viewer does not track trend. each bar is taken in isolation of prior bars - the price may be going down and V.Viewer is showing supply going up (absorption scenario?) - so i suggest you do not use it to make decisions without consulting other trend / momentum indicators - of course this is a possible improvement idea, or can be implemented in another indicator, add in trend somehow, or maybe think of making this a +100 / -100 Oscillator .. feel free to play with these thoughts
- all thoughts welcome - if this is useful to you in your trading, please share with other trades here to learn from each other
- the code is commented - please feel free to use it as you like, or build things on top of it - but please continue to credit the author of this code :)
good luck!
-

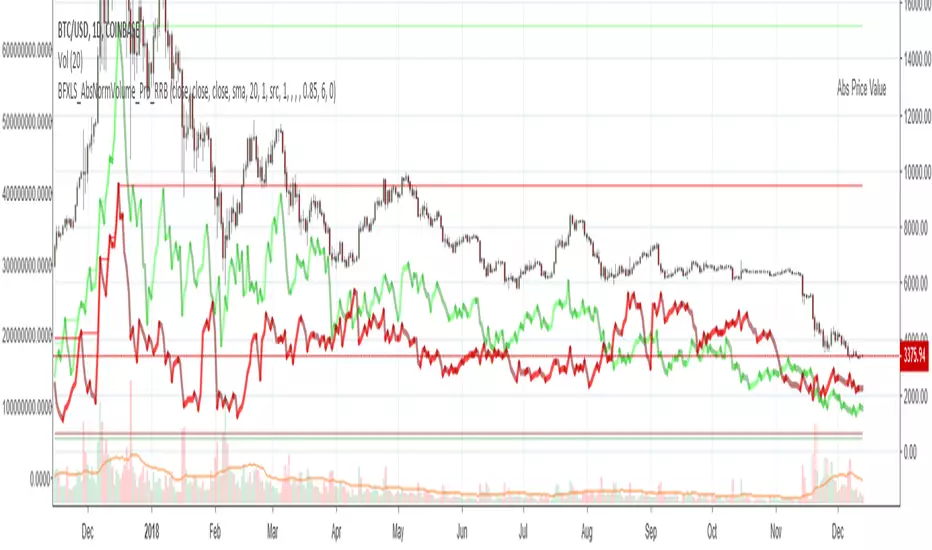
Chiki-Poki BFXLS Longs Shorts Abs Normalized Volume Pro by RRBChiki-Poki BFXLS Longs vs Shorts Absolute Normalized Volume Value Pro by RagingRocketBull 2018
Version 1.0
This indicator displays Longs vs Shorts in a side by side graph, shows volume's absolute price value and normalized volume of Longs/Shorts for the current asset. This allows for more accurate L/S comparisons (like a log scale for volume) since volume on spot exchanges (Bitstamp, Bitfinex, Coinbase etc) is measured in coins traded, not USD traded. Similarly, L/S is usually the amount of coins in open L/S positions, not their total USD value. On Bitmex and other futures exchanges volume is measured in USD traded, so you don't need to apply the Volume Absolute Price Value checkbox to compare L/S. You should always check first whether your source is measured in coins or USD.
Chiki-Poki BFXLS primarily uses *SHORTS/LONGS feeds from Bitfinex for the current crypto asset, but you can specify custom L/S source tickers instead.
This 2-in-1 works both in the Main Chart and in the indicator pane below. You can switch between Main/Sub Window panes using RMB on the indicator's name and selecting Move To/Pane Above/Below.
This indicator doesn't use volume of the current asset. It uses L/S ticker's OHLC as a source for SHORTS/LONGS volumes instead. Essentially L/S => L/S Volume == L/S
Features:
- Display Longs vs Shorts side by side graph for the current crypto asset, i.e. for BTCUSD - BTCUSDLONGS/BTCUSDSHORTS, for ETHUSD - ETHUSDLONGS/ETHUSDSHORTS etc.
- Use custom OHLC ticker sources for Longs/Shorts from different exchanges/crypto assets with/without exchange prefix.
- Plot Longs/Shorts as lines or candles
- Show/Hide L/S, Diff, MAs, ATH/ATL
- Use Longs/Shorts Volume Absolute Price Value (Price * L/S Volume) instead of Coins Traded in open L/S positions to compare total L/S value/capitalization
- Normalize L/S Volume using Price / Price MA / L/S Volume MA
- Supports any existing type of MA: SMA, EMA, WMA, HMA etc
- Volume Absolute Price Value / Normalize also works on candles
- Oscillator mode with negative axis (works in both Main Chart/Subwindow panes).
- Highlight L/S Volume spikes above L/S MAs in both lines/oscillator.
- Change L/S MA color based on a number of last rising/falling L/S bars, colorize candles
- Display L/S volume as 1000s, mlns, or blns using alpha multiplier
1. based on BFXLS Longs vs Shorts and Compare Style, uses plot*, security and custom hma functions
2. swma has a fixed length = 4, alma and linreg have additional offset and smoothing params
Notes:
- Make sure that Left Price Scale shows up with Auto Fit Data enabled. You can reattach indicator to a different scale in Style.
- It is not recommended to switch modes multiple times due to TradingView's scale reattachment bugs. You should switch between Main Chart and Sub Window only once.
- When the USD price of an asset is lower you can trade more coins but capitalization value won't be as significant as when there are less coins for a higher price. Same goes for Shorts/Longs.
Current ATH in shorts doesn't trigger a squeeze because its total value is now far less than before and we are in a bear market where it's normal to have a higher number of shorts.
- You should always subtract Hedged L/S from L/S because hedged positions are temporary - used to preserve the value of the main position in the opposite direction and should be disregarded as such.
- Low margin rates increase the probability of a move in an underlying direction because it is cheaper. High margin rates => the market is anticipating a move in this direction, thus a more expensive rate. Sudden 5-10x rate raises imply a possible reversal soon. high - 0.1%, avg - 0.01-0.02%, low - 0.001-0.005%
You can also check out:
- BFXLS Longs/Shorts on BFXData
- Bitfinex L/S margin rates and Hedged L/S on datamish
- Bitmex L/S on Coinfarm.online
Float Rotation TrackerFloat Rotation Tracker - Quick Reference Guide
What is Float Rotation?
Float Rotation = Cumulative Daily Volume ÷ Float
Example:
Float = 5,000,000 shares
Day Volume = 7,500,000 shares
Rotation = 7.5M ÷ 5M = 1.5x (150%)
When rotation hits 1x (100%), every available share has theoretically changed hands at least once during the trading day.
Why It Matters
RotationMeaningImplication0.5x50% of float tradedInterest building1.0x 🔥Full rotationExtreme interest confirmed2.0x 🔥🔥Double rotationVery high volatility3.0x 🔥🔥🔥Triple rotationRare - maximum volatility
Key insight: High rotation on a low-float stock = explosive potential
Float Classification
Float SizeClassificationRotation Impact≤ 2M🔥 MICROExtremely volatile, fast rotation≤ 5M🔥 VERY LOWExcellent momentum potential≤ 10MLOWGood for rotation plays> 10MNORMALNeeds massive volume to rotate
Rule of thumb: Focus on stocks with float under 10M for meaningful rotation signals.
Reading the Indicator
Rotation Line (Yellow)
Shows current rotation level
Rises throughout the day as volume accumulates
Crosses horizontal level lines at milestones
Level Lines
LineColorMeaning0.5Gray dotted50% rotation1.0Orange solidFull rotation2.0Red solidDouble rotation3.0Fuchsia solidTriple rotation
Volume Bars (Bottom)
ColorMeaningGrayBelow average volumeBlueNormal volume (1-2x avg)GreenHigh volume (2-5x avg)LimeExtreme volume (5x+ avg)
Milestone Markers
Circles appear when rotation crosses key levels
Labels show "50%", "1x", "2x", "3x🔥"
Background Color
Changes as rotation increases
Darker = higher rotation level
Info Table Explained
FieldDescriptionFloatShare count + classification (MICRO/LOW/NORMAL)SourceAuto ✓ = TradingView data / Manual = user enteredRotationCurrent rotation with emoji indicatorRotation %Same as rotation × 100Day VolumeCumulative volume todayTo XxVolume needed to reach next milestoneBar RVolCurrent bar's relative volumeMilestonesWhich levels have been hit todayPer RotationShares equal to one full rotationEst. TimeBars until next milestone (at current pace)
Trading with Float Rotation
Entry Signals
Early Entry (Higher Risk, Higher Reward)
Rotation approaching 0.5x
Strong price action (bull flag, breakout)
Rising relative volume bars
Confirmation Entry (Lower Risk)
Rotation at or above 1x
Price holding above VWAP
Continuous green/lime volume bars
Late Entry (Highest Risk)
Rotation above 2x
Only enter on clear pullback pattern
Tight stop required
Exit Signals
Warning Signs:
Rotation very high (2x+) with declining volume bars
Reversal candle after milestone
Price breaking below key support
Volume bars turning gray/blue after being green/lime
Take Profits:
Partial profit at each rotation milestone
Trail stop as rotation increases
Full exit on reversal pattern after 2x+ rotation
Best Setups
Ideal Float Rotation Play
✓ Float under 10M (preferably under 5M)
✓ Stock up 5%+ on the day
✓ News catalyst driving interest
✓ Rotation approaching or exceeding 1x
✓ Price above VWAP
✓ Volume bars green or lime
✓ Clear chart pattern (bull flag, flat top)
Red Flags to Avoid
✗ Float over 50M (hard to rotate meaningfully)
✗ Rotation high but price declining
✗ Volume bars turning gray after spike
✗ No clear catalyst
✗ Price below VWAP with high rotation
✗ Late in day (3pm+) after 2x rotation
Float Data Sources
If auto-detect doesn't work, get float from:
SourceHow to FindFinvizfinviz.com → ticker → "Shs Float"Yahoo FinanceFinance.yahoo.com → Statistics → "Float"MarketWatchMarketwatch.com → ticker → ProfileYour BrokerUsually in stock details/fundamentals
Note: Float can change due to offerings, buybacks, lockup expirations. Check recent data.
Settings Guide
Conservative Settings
Alert Level 1: 0.75 (75%)
Alert Level 2: 1.0 (100%)
Alert Level 3: 2.0 (200%)
Alert Level 4: 3.0 (300%)
High Vol Multiplier: 2.0
Extreme Vol Multiplier: 5.0
Aggressive Settings
Alert Level 1: 0.3 (30%)
Alert Level 2: 0.5 (50%)
Alert Level 3: 1.0 (100%)
Alert Level 4: 2.0 (200%)
High Vol Multiplier: 1.5
Extreme Vol Multiplier: 3.0
Alert Setup
Recommended Alerts
100% Rotation (1x) - Primary signal
Most important milestone
Confirms extreme interest
High Rotation + Extreme Volume
Combined condition
Very high probability signal
How to Set
Right-click chart → Add Alert
Condition: Float Rotation Tracker
Select desired milestone
Set notification (popup/email/phone)
Set expiration
Common Questions
Q: Why is my float showing "Manual (no data)"?
A: TradingView doesn't have float data for this stock. Enter the float manually in settings after looking it up on Finviz or Yahoo Finance.
Q: The rotation seems too high/low - is the float wrong?
A: Possibly. Cross-check float on Finviz. Recent offerings or share structure changes may not be reflected in TradingView's data.
Q: What if float rotates early in the day?
A: Early 1x rotation (within first hour) is very bullish - indicates massive interest. Watch for continuation patterns.
Q: High rotation but price is dropping?
A: This is distribution - large holders are selling into demand. High rotation doesn't guarantee price direction, just volatility.
Q: Can I use this for swing trading?
A: The indicator resets daily, so it's designed for intraday use. You could note multi-day rotation patterns manually.
Quick Decision Matrix
RotationPrice ActionVolumeDecision<0.5xStrong upHighWatch, early stage0.5-1xConsolidatingSteadyPrepare entry1x+Breaking outIncreasingEntry on pattern1x+DroppingHighAvoid - distribution2x+Strong upExtremePartial profit, trail stop2x+Reversal candleDecliningExit or avoid
Workflow Integration
MORNING ROUTINE:
1. Scan for gappers (5%+, high volume)
2. Check float on each candidate
3. Apply Float Rotation Tracker
4. Prioritize lowest float with building rotation
DURING SESSION:
5. Watch rotation levels on active trades
6. Enter on patterns when rotation confirms (0.5-1x)
7. Scale out as rotation increases
8. Exit or trail after 2x rotation
END OF DAY:
9. Note which stocks hit 2x+ rotation
10. Review rotation vs price action
11. Learn patterns for future trades
Combining with Other Indicators
IndicatorHow to Use Together5 PillarsScreen for low-float stocks firstGap & GoCheck rotation on gappersBull FlagEnter bull flags with 1x+ rotationVWAPOnly trade rotation plays above VWAPRSIWatch for divergence at high rotation
Key Takeaways
Float size matters - Lower float = faster rotation = more volatility
1x is the key level - Full rotation confirms extreme interest
Volume quality matters - Green/lime bars better than gray
Combine with price action - Rotation confirms, patterns trigger
Know when you're late - 2x+ rotation is late stage
Check your float data - Wrong float = wrong rotation calculation
Happy Trading! 🔥

Bull Flag & Flat Top Breakout DetectorBull Flag & Flat Top Detector - Quick Reference Guide
Pattern Overview
🚩 Bull Flag
╱╲
╱ ╲ ← Pullback (2-5 red candles)
╱ ╲
╱ ╲____
╱ ╲
│ │
│ THE POLE │ ← Strong upward move (3+ green candles)
│ │
└──────────────┘
What to look for:
Strong initial move (the "pole") - 3+ green candles, 3%+ move
Brief pullback - 2-5 candles, less than 50% retracement
Pullback should "drift" lower, not crash
Entry on first candle to make new high after pullback
📊 Flat Top Breakout
════════════════ ← Resistance (multiple touches)
↑ ↑ ↑
╱╲ ╱╲ ╱╲
╱ ╲╱ ╲╱ ╲ ← Consolidation
╱ ╲
╱ ╲
What to look for:
Multiple touches of same resistance level (2+)
Tight consolidation range
Each failed breakout builds pressure
Entry on convincing break above resistance with volume
Signal Types
SignalShapeColorMeaningBull Flag Breakout▲ TriangleLimeEntry signal - go longFlat Top Breakout◆ DiamondAquaEntry signal - go longBear Flag Breakout▼ TriangleRedShort entry (if enabled)Pattern Forming🚩 FlagFaded GreenBull flag developingPattern Forming■ SquareFaded BlueFlat top developing
Level Lines Explained
LineColorStyleMeaningEntryLimeSolidBreakout trigger priceStop LossRedDashedExit if price falls hereTarget 1AquaDottedFirst profit target (2R)Target 2YellowDottedSecond profit target (3R)
Info Table Reference
FieldWhat It ShowsBull FlagScanning / Forming 🚩 / Breakout ✓Flat TopScanning / Forming 📊 / Breakout ✓PullbackCandle count + retracement %Rel VolumeCurrent bar vs averageEMA 20Above ✓ or Below ✗VWAPAbove ✓ or Below ✗Green StreakConsecutive green candles (pole)ResistanceTouch count for flat top
Trading Checklist
Before Entry ✅
Pattern status shows "FORMING" or "BREAKOUT"
Price above EMA (table shows ✓)
Price above VWAP (table shows ✓)
Relative volume 1.5x+ (ideally 2x+)
Stock is in play (up 5%+ on day, has catalyst)
Market direction supportive (not fighting trend)
Entry Execution
Wait for breakout candle to form
Confirm volume spike on breakout
Enter as close to entry line as possible
Set stop loss at red dashed line
Know your target levels
Trade Management
If no immediate follow-through → consider exit ("breakout or bailout")
Take 50% off at Target 1
Move stop to breakeven
Let remainder run toward Target 2
Exit fully if price returns below entry
Bull Flag Quality Checklist
Pole Quality:
FactorIdealAcceptableAvoidGreen candles5+3-4Less than 3Move size10%+3-10%Less than 3%VolumeIncreasingSteadyDecliningCandle bodiesLargeMediumSmall/doji
Pullback Quality:
FactorIdealAcceptableAvoidCandle count2-34-56+RetracementUnder 38%38-50%Over 50%VolumeDecliningSteadyIncreasingCharacterOrderly driftChoppySharp drop
Flat Top Quality Checklist
FactorGood SetupWeak SetupTouches3+ at same levelOnly 2, widely spacedToleranceVery tight (0.2%)Loose (1%+)Duration5-15 barsToo short or too longVolumeDrying upErraticPrior trendUpSideways/down
Common Mistakes to Avoid
❌ Entering too early
Wait for actual breakout, not anticipation
"Forming" ≠ "Breakout"
❌ Ignoring volume
No volume = likely false breakout
Require 1.5x+ relative volume minimum
❌ Fighting the trend
Check EMA and VWAP status
Both should be ✓ for high probability
❌ Wide stops
Stop should be below pullback low
If stop is too wide, skip the trade
❌ Holding losers
"Breakout or bailout" - if it doesn't work, exit
Failed breakouts often reverse hard
❌ Chasing extended moves
If you missed entry, wait for next pattern
Don't chase 5+ candles after breakout
Risk Management Rules
Position Sizing
Risk Amount = Account × Risk % (typically 1-2%)
Position Size = Risk Amount ÷ (Entry - Stop)
Example:
Account: $25,000
Risk: 1% = $250
Entry: $5.00
Stop: $4.70
Risk per share: $0.30
Position Size: $250 ÷ $0.30 = 833 shares
Risk-Reward Targets
TargetR MultipleExample (risk $0.30)Target 12:1+$0.60 ($5.60)Target 23:1+$0.90 ($5.90)
Timeframe Guide
TimeframeProsConsBest For1-minMore patterns, precise entryNoisy, false signalsScalping5-minGood balance, cleaner patternsFewer signalsDay trading15-minHigh quality patternsMiss fast movesSwing entries
Settings Quick Reference
Default Settings (Balanced)
Pole: 3 candles, 3% move
Pullback: 2-5 candles, 50% max retrace
Volume: 1.5x required
Filters: EMA + VWAP ON
Aggressive Settings
Pole: 2 candles, 2% move
Pullback: 2-6 candles, 60% max retrace
Volume: 1.2x required
Filters: VWAP OFF
Conservative Settings
Pole: 4 candles, 5% move
Pullback: 2-4 candles, 40% max retrace
Volume: 2.0x required
Filters: Both ON
Alert Setup
Recommended Alerts
"Bull Flag Forming"
Get early warning as pattern develops
Prepare your position size and levels
"Bull Flag Breakout"
Primary entry alert
React quickly when triggered
"Any Bullish Breakout"
Catch both bull flags and flat tops
Good for watchlist scanning
Alert Setup Steps
Right-click chart → Add Alert
Condition: Select "Bull Flag & Flat Top Breakout Detector"
Choose alert type from dropdown
Set expiration and notification method
Troubleshooting
Q: Patterns not detecting?
Lower the Min Pole Move % setting
Reduce Min Pole Candles requirement
Check that price is in acceptable range
Q: Too many false signals?
Increase volume multiplier to 2.0x
Enable both EMA and VWAP filters
Increase Min Pole Move %
Q: Levels not showing?
Enable "Show Entry Line", "Show Stop Loss", "Show Targets"
Check "Max Patterns to Display" setting
Q: Info table not visible?
Enable "Show Info Table" in settings
Try different table position
Pattern Combinations
Best Setups (A+ Quality)
Bull flag on a gap day (Gap & Go → Bull Flag)
Flat top at pre-market high resistance
Pattern forming above VWAP with 5x+ volume
Avoid These
Bull flag below VWAP
Flat top in downtrending stock
Low volume patterns
Patterns late in the day (after 2pm)
Daily Routine
Pre-Market (7-9am)
Build watchlist of gappers (5%+, high volume)
Apply indicator to top 3-5 candidates
Note pre-market levels
Market Open (9:30-10:30am)
Watch for "FORMING" status on watchlist
Prepare entries as patterns develop
Execute on breakout signals
Manage trades according to plan
Midday (10:30am-2pm)
Look for second-wave patterns
Be more selective (less momentum)
Consider tighter stops
Close (2-4pm)
Generally avoid new patterns
Manage existing positions
Review day's trades

Global Liquidity Score
Global Liquidity Score – Simple Risk-On / Risk-Off Gauge
This indicator measures overall market liquidity conditions using a single, normalized score.
It takes several macro and crypto variables, standardizes each one (z-score), and combines them into one clear Liquidity Score Line.
You only follow one line (your pink/white line).
The background color shows the current liquidity regime.
⸻
What the indicator measures
The algorithm looks at four major liquidity sources:
1. USD Liquidity (tightening or easing)
• DXY (strong dollar = tighter global liquidity)
• US10Y yield (higher yields = liquidity drain)
2. Risk Sentiment (risk-on vs risk-off)
• VIX index (volatility)
• S&P 500 index (SPX)
3. Credit Market Strength
• High-yield ETFs: HYG, JNK
• Investment-grade corporate credit: LQD
Stronger credit = easier liquidity.
Weaker credit = tightening risk.
4. Internal Crypto Liquidity
• USDT dominance (higher = risk-off in crypto)
• Bitcoin price
• TOTAL2 (crypto market cap excluding BTC)
These are all converted into z-scores and combined into one metric:
Total Liquidity Score =
USD Block + Risk Block − Credit Block − 0.5 × Crypto Block
⸻
How to read the colors
The indicator uses background colors to show the liquidity regime:
Color Meaning
Dark Red Severe liquidity tightening / strong risk-off
Red Mild-to-moderate tightening
Green Liquidity easing / soft risk-on
Dark Green Strong easing, high liquidity / risk-on
Your pink/white line = the final liquidity score.
You only need to follow that single line.
⸻
How to interpret the score
📉 Positive score → Liquidity Tightening (Risk-Off)
• USD stronger
• Yields rising
• Volatility rising
• Credit markets weakening
• Crypto rotating to stablecoins
📈 Negative score → Liquidity Easing (Risk-On)
• USD weakening
• Yields falling
• Stocks rising
• Volatility low
• Credit markets strong
• Crypto beta assets outperform
⸻
What this indicator is NOT
This is not a price predictor.
It does not follow BTC directly.
It tells you liquidity conditions, not immediate price direction.
It answers the macro question:
“Is liquidity flowing INTO the market or OUT of the market?”
If liquidity is tightening (red), crypto rallies are harder to sustain.
If liquidity is easing (green), crypto rallies have more fuel.

Get_rich_aggressively# Get_rich_aggressively - Professional Order Flow Indicator
## 📊 Overview
**Get_rich_aggressively (GRA)** is a professional-grade order flow indicator designed for futures and crypto traders who understand Auction Market Theory and want to identify high-probability setups with exceptional risk-to-reward ratios (3:1 to 5:1).
This indicator answers the two most critical questions in trading:
1. **Who is in control?** Bulls or Bears based on volume delta and aggression
2. **Where are traders trapped?** Identifying failed breakouts that lead to explosive moves
Built specifically for **NQ (Nasdaq 100 Futures)**, **GC (Gold Futures)**, and **BTC (Bitcoin)**, with optimized settings for each instrument's unique volatility profile.
---
## 🎯 Core Concepts
### Volume Delta & Imbalance
The indicator calculates **buying pressure vs selling pressure** within each candle using intrabar analysis. When one side significantly overpowers the other, an **imbalance** exists—these are the moments where price moves with conviction.
**Imbalance Ratio Interpretation:**
- `1.5:1` → Moderate imbalance (tradeable)
- `2.0:1` → Strong imbalance (high conviction)
- `3.0:1+` → Extreme imbalance (institutional activity)
### Aggression Detection
The indicator identifies which side is **aggressing** (hitting market orders) vs **absorbing** (resting limit orders). When aggressive buyers overwhelm sellers, price moves UP. When aggressive sellers overwhelm buyers, price moves DOWN.
### Trap Detection
**Bull Traps** and **Bear Traps** are failed breakouts where traders get caught on the wrong side. These setups often lead to explosive reversals as trapped traders are forced to exit.
---
## 🔧 How To Use
### Visual Elements
| Element | Meaning |
|---------|---------|
| **Green Bubbles** (below bar) | Bullish volume aggression - buyers winning |
| **Red Bubbles** (above bar) | Bearish volume aggression - sellers winning |
| **▲ Triangle Up** | Long signal (3:1 or 4:1+ R:R) |
| **▼ Triangle Down** | Short signal (3:1 or 4:1+ R:R) |
| **BT / BT!** | Bull Trap (short opportunity) |
| **BrT / BrT!** | Bear Trap (long opportunity) |
| **Diamond** | Absorption candle (institutional activity) |
| **Colored Candles** | Green = positive delta, Red = negative delta |
### Info Panel (Top Right)
| Field | Description |
|-------|-------------|
| **Delta** | Current bar's volume delta (buy - sell pressure) |
| **Vol** | Volume ratio vs 20-period average |
| **Imb** | Imbalance ratio (who's winning) |
| **Ctrl** | Who's in control: BULLS / BEARS |
| **CVD** | Cumulative Volume Delta for session |
| **Sess** | Current session (LDN! = London Open, NY! = NY Open) |
| **Mkt** | Market condition: CHOP / FV / IMB! / OK |
| **Sig** | Active signal if any |
### Signal Hierarchy
**High Conviction Signals (4:1+ R:R):**
- Displayed as `▲ 4:1+` or `▼ 4:1+`
- Require: Strong imbalance (2:1+) + Big volume (2.5x+) + Delta trend confirmation
- Best during London Open or NY Open sessions
**Standard Signals (3:1 R:R):**
- Displayed as `▲ 3:1` or `▼ 3:1`
- Require: Moderate imbalance (1.5:1+) + Volume spike (1.5x+)
- Good any time market is not choppy
**Trap Signals:**
- `BT!` = Strong Bull Trap → SHORT
- `BrT!` = Strong Bear Trap → LONG
- Occur at swing highs/lows with rejection wicks
---
## ⚙️ Recommended Settings by Instrument
### 📈 NQ (Nasdaq 100 E-mini Futures)
NQ is highly liquid with clear institutional footprints. The default settings work excellently.
```
═══════════ VOLUME ANALYSIS ═══════════
Volume MA Length: 20
Volume Spike Threshold: 1.5
Big Trade Threshold: 2.5
Extreme Volume Threshold: 4.0
═══════════ IMBALANCE DETECTION ═══════════
Imbalance Ratio Threshold: 1.5
Strong Imbalance Threshold: 2.0
Delta Confirmation Bars: 3
Fair Value Range (%): 0.3
═══════════ TRAP DETECTION ═══════════
Swing Lookback Period: 20
Minimum Wick Ratio: 0.4
Max Body Ratio (Absorption): 0.35
═══════════ SESSION SETTINGS ═══════════
Timezone: America/New_York
London Open Window: 0300-0500
NY Open Window: 0930-1130
Only Signal During Key Sessions: OFF (or ON for higher conviction)
═══════════ TIMEFRAME SETTINGS ═══════════
Analysis Timeframe: 1 (1-minute intrabar analysis)
Use Intrabar Analysis: ON
```
**Best Timeframes for NQ:**
- **1-minute**: Scalping, quick entries
- **5-minute**: Day trading (RECOMMENDED)
- **15-minute**: Swing entries within day
**NQ Trading Tips:**
- Most reliable signals occur during **9:30-11:30 AM EST** (NY Open)
- Watch for traps at **overnight high/low** levels
- Volume spikes of **3x+** often precede 10-20 point moves
- Avoid trading during **12:00-2:00 PM EST** (lunch chop)
---
### 🥇 GC (Gold Futures)
Gold has different volatility patterns. Increase thresholds slightly to filter noise.
```
═══════════ VOLUME ANALYSIS ═══════════
Volume MA Length: 20
Volume Spike Threshold: 1.8 ← Increased (gold has more noise)
Big Trade Threshold: 3.0 ← Increased
Extreme Volume Threshold: 5.0 ← Increased
═══════════ IMBALANCE DETECTION ═══════════
Imbalance Ratio Threshold: 1.6 ← Slightly higher
Strong Imbalance Threshold: 2.2 ← Slightly higher
Delta Confirmation Bars: 4 ← More confirmation needed
Fair Value Range (%): 0.4 ← Gold chops more
═══════════ TRAP DETECTION ═══════════
Swing Lookback Period: 25 ← Wider swings
Minimum Wick Ratio: 0.45 ← Bigger wicks needed
Max Body Ratio (Absorption): 0.30 ← Tighter for absorption
═══════════ SESSION SETTINGS ═══════════
Timezone: America/New_York
London Open Window: 0300-0500 ← Gold moves well here
NY Open Window: 0830-1030 ← Earlier due to economic news
Only Signal During Key Sessions: ON ← Recommended for GC
═══════════ TIMEFRAME SETTINGS ═══════════
Analysis Timeframe: 1
Use Intrabar Analysis: ON
```
**Best Timeframes for GC:**
- **5-minute**: Day trading (RECOMMENDED)
- **15-minute**: Position entries
- **1-hour**: Swing trading
**Gold Trading Tips:**
- Gold reacts strongly to **economic data releases** (8:30 AM EST)
- **London session** (3-5 AM EST) often sets the daily direction
- Watch for traps at **round numbers** ($2000, $2050, etc.)
- Gold respects **previous day high/low** as key levels
- Absorption candles near support/resistance signal reversals
---
### ₿ BTC (Bitcoin)
Bitcoin trades 24/7 with unique session dynamics. Adjust for higher volatility.
```
═══════════ VOLUME ANALYSIS ═══════════
Volume MA Length: 30 ← Longer average (24/7 market)
Volume Spike Threshold: 2.0 ← Higher threshold (crypto volatility)
Big Trade Threshold: 3.5 ← Higher for significance
Extreme Volume Threshold: 6.0 ← Much higher for crypto
═══════════ IMBALANCE DETECTION ═══════════
Imbalance Ratio Threshold: 1.7 ← Higher due to volatility
Strong Imbalance Threshold: 2.5 ← Higher for conviction
Delta Confirmation Bars: 3
Fair Value Range (%): 0.5 ← BTC ranges more
═══════════ TRAP DETECTION ═══════════
Swing Lookback Period: 30 ← Wider lookback
Minimum Wick Ratio: 0.5 ← BTC has massive wicks
Max Body Ratio (Absorption): 0.25 ← Tighter (many dojis in crypto)
═══════════ SESSION SETTINGS ═══════════
Timezone: America/New_York
London Open Window: 0300-0500 ← European session start
NY Open Window: 0930-1130 ← US session (big moves)
Only Signal During Key Sessions: OFF ← BTC moves 24/7
═══════════ TIMEFRAME SETTINGS ═══════════
Analysis Timeframe: 1
Use Intrabar Analysis: ON
```
**Best Timeframes for BTC:**
- **5-minute**: Active trading
- **15-minute**: Day trading (RECOMMENDED)
- **1-hour**: Swing trading
- **4-hour**: Position trading
**Bitcoin Trading Tips:**
- **US Session** (9:30 AM - 4:00 PM EST) has highest volume
- **Asian Session** (8 PM - 4 AM EST) often consolidates
- Watch for traps at **psychological levels** ($60K, $65K, $70K, etc.)
- **Funding rate flips** often coincide with trap signals
- Weekend volume is lower—signals less reliable
---
## 📋 Trading Playbook
### Setup 1: High Conviction Imbalance Entry
**Conditions:**
- ▲ or ▼ signal appears with "4:1+" label
- Info panel shows "Ctrl: BULLS" or "Ctrl: BEARS"
- Info panel shows "Mkt: IMB!"
- During active session (LDN! or NY!)
**Entry:** Market order on signal bar close
**Stop Loss:** Beyond the signal candle's wick
**Take Profit:** 4:1 risk-to-reward minimum
---
### Setup 2: Trap Reversal
**Conditions:**
- BT! (Bull Trap) or BrT! (Bear Trap) appears
- Signal occurs at swing high/low
- Volume spike confirms (2x+ average)
**Entry:**
- Bull Trap → SHORT on close below signal bar
- Bear Trap → LONG on close above signal bar
**Stop Loss:** Beyond the trap wick
**Take Profit:** Previous swing level (3:1+ R:R typical)
---
### Setup 3: Absorption Reversal
**Conditions:**
- Diamond marker appears (absorption)
- At key support/resistance level
- Followed by opposite-colored candle with volume
**Entry:** On confirmation candle close
**Stop Loss:** Beyond absorption candle
**Take Profit:** 2:1 minimum
---
### Setup 4: Session Open Momentum
**Conditions:**
- "L" (London) or "N" (NY) session marker appears
- First 30 minutes show clear delta direction
- Imbalance ratio > 1.5:1
**Entry:** With the dominant delta direction
**Stop Loss:** Session open price
**Take Profit:** Previous day high/low or 3:1 R:R
---
## ⚠️ When NOT to Trade
Avoid taking signals when:
1. **Info panel shows "Mkt: CHOP"** - Market is ranging without conviction
2. **Info panel shows "Mkt: FV"** - Fair value zone, expect mean reversion
3. **Ctrl shows "---"** - Neither side in control
4. **During lunch hours** (12:00-2:00 PM EST for futures)
5. **Before major news** (FOMC, NFP, CPI)
6. **Low volume sessions** (holidays, weekends for futures)
---
## 🔔 Alerts Setup
The indicator includes pre-built alerts. To set them up:
1. Click the "Alerts" button (clock icon) in TradingView
2. Select "Get_rich_aggressively" as condition
3. Choose from available alerts:
- **EXTREME LONG** - 4:1+ bullish setup
- **EXTREME SHORT** - 4:1+ bearish setup
- **HIGH CONV LONG** - 3:1 bullish setup
- **HIGH CONV SHORT** - 3:1 bearish setup
- **BULL TRAP** - Failed breakout, short opportunity
- **BEAR TRAP** - Failed breakdown, long opportunity
- **LONDON OPEN** - Session notification
- **NY OPEN** - Session notification
---
## 📚 Understanding the Logic
### Volume Delta Calculation
The indicator uses **intrabar analysis** to calculate precise volume delta:
```
For each lower-timeframe bar within the current bar:
Buy Pressure = ((Close - Low) / Range) × Volume
Sell Pressure = ((High - Close) / Range) × Volume
Delta = Buy Pressure - Sell Pressure
Total Delta = Sum of all intrabar deltas
```
This method is more accurate than simple "green candle = buying" logic because it captures the **internal auction** within each candle.
### Imbalance Ratio
```
Bullish Imbalance = Buy Pressure / Sell Pressure
Bearish Imbalance = Sell Pressure / Buy Pressure
If ratio ≥ 1.5 AND volume spike → Standard signal
If ratio ≥ 2.0 AND big volume → High conviction signal
```
### Trap Detection
```
Bull Trap =
Price breaks ABOVE swing high +
Closes BACK BELOW swing high +
Upper wick ≥ 40% of candle range +
Volume spike present
Bear Trap =
Price breaks BELOW swing low +
Closes BACK ABOVE swing low +
Lower wick ≥ 40% of candle range +
Volume spike present
```
---
## 💡 Pro Tips
1. **Combine with market structure** - Signals at key S/R levels are stronger
2. **Watch CVD divergence** - If CVD trends opposite to price, reversal likely
3. **Stack confluences** - Trap + Absorption + Session Open = highest probability
4. **Scale in** - Enter 50% on signal, add on confirmation
5. **Use session filter** - Enable "Only Signal During Key Sessions" for cleaner signals
6. **Check higher timeframe** - Ensure signal aligns with HTF trend/bias
---
## ⚠️ Disclaimer
This indicator is a tool to assist your trading decisions, not a guarantee of profits. Past performance does not indicate future results. Always:
- Use proper risk management (1-2% max per trade)
- Paper trade before going live
- Understand the instrument you're trading
- Never risk more than you can afford to lose
---
## 🔄 Version History
**v1.0** - Initial release
- Volume delta calculation with intrabar analysis
- Imbalance detection and signals
- Bull/Bear trap identification
- Absorption candle detection
- Session filtering (London/NY)
- Real-time info panel
- Comprehensive alert system
---
## 📬 Support
If you have questions or suggestions, leave a comment below or send me a message.
**Happy Trading! Let's Get Rich Aggressively! 🚀**
---
*This indicator is inspired by Auction Market Theory, Order Flow concepts, and professional tools like DeepCharts, Sierra Chart, and Bookmap. It brings institutional-grade analysis to TradingView.*

Super momentum DBSISuper momentum DBSI: The Ultimate Guide
1. What is this Indicator?
The Super momentum DBSI is a "Consensus Engine." Instead of relying on a single line (like an RSI) to tell you where the market is going, this tool calculates 33 distinct technical indicators simultaneously for every single candle.
It treats the market like a democracy. It asks 33 mathematical "voters" (Momentum, Trend, Volume, Volatility) if they are Bullish or Bearish.
If 30 out of 33 say "Buy," the score is high (Yellow), and the trend is extremely strong.
If only 15 say "Buy," the score is low (Teal), and the trend is weak or choppy.
2. Visual Guide: How to Read the Numbers
The Scores
Top Number (Bears): Represents Selling Pressure.
Bottom Number (Bulls): Represents Buying Pressure.
The Colors (The Traffic Lights)
The colors are your primary signal. They tell you who is currently winning the war.
🟡 YELLOW (Dominance):
This indicates the Winning Side.
If the Bottom Number is Yellow, Bulls are in control.
If the Top Number is Yellow, Bears are in control.
🔴 RED (Weakness):
This appears on the Top. It means Bears are present but losing.
🔵 TEAL (Weakness):
This appears on the Bottom. It means Bulls are present but losing.
3. Trading Strategy
Scenario A: The "Strong Buy" (Long Entry)
The Setup: You are looking for a shift in momentum where Buyers overwhelm Sellers.
Watch the Bottom Number: Wait for it to turn Yellow.
Confirm Strength: Ensure the score is above 15 and rising (e.g., 12 → 18 → 22).
Check the Top: The Top Number should be Red and low (below 10).
Trigger: Enter on the candle close.
Scenario B: The "Strong Sell" (Short Entry)
The Setup: You are looking for Sellers to crush the Buyers.
Watch the Top Number: Wait for it to turn Yellow.
Confirm Strength: Ensure the score is above 15 and rising.
Check the Bottom: The Bottom Number should be Teal and low.
Trigger: Enter on the candle close.
Scenario C: The "No Trade Zone" (Choppy Market)
The Setup: The market is confused.
Visual: Top is Red, Bottom is Teal.
Meaning: NOBODY IS WINNING. There is no Yellow number.
Action: Do not trade. This usually happens during lunch hours, weekends, or right before big news. This filter alone will save you from many false breakouts.
4. What is Inside? (The 33 Indicators)
To give you confidence in the signals, here is exactly what the script is checking:
Group 1: Momentum (Oscillators)
Detects if price is moving fast.
RSI (Relative Strength Index)
CCI (Commodity Channel Index)
Stochastic
Williams %R
Momentum
Rate of Change (ROC)
Ultimate Oscillator
Awesome Oscillator
True Strength Index (TSI)
Stoch RSI
TRIX
Chande Momentum Oscillator
Group 2: Trend Direction
Detects the general path of the market.
13. MACD
14. Parabolic SAR
15. SuperTrend
16. ALMA (Moving Average)
17. Aroon
18. ADX (Directional Movement)
19. Coppock Curve
20. Ichimoku Conversion Line
21. Hull Moving Average
Group 3: Price Action
Detects where price is relative to averages.
22. Price vs EMA 20
23. Price vs EMA 50
24. Price vs EMA 200
Group 4: Volume & Force
Detects if there is money behind the move.
25. Money Flow Index (MFI)
26. On Balance Volume (OBV)
27. Chaikin Money Flow (CMF)
28. VWAP (Intraday)
29. Elder Force Index
30. Ease of Movement
Group 5: Volatility
Detects if price is pushing the outer limits.
31. Bollinger Bands
32. Keltner Channels
33. Donchian Channels
5. Pro Tips for Success
Don't Catch Knives: If the Bear score (Top) is Yellow and 25+, do not try to buy the dip. Wait for the Yellow score to break.
Exit Early: If you are Long and the Yellow Bull score drops from 28 to 15 in one candle, TAKE PROFIT. The momentum has died.
Use Higher Timeframes: This indicator works best on 15m, 1H, and 4H charts. On the 1m chart, it may be too volatile.

Directional Imbalance Index [BigBeluga]🔵 OVERVIEW
The Directional Imbalance Index is designed to track market strength by counting how often price sets new highs or lows over a defined lookback period. Every time a bar forms a new extreme, the indicator records a +1 count for either bullish (highs) or bearish (lows). These counts are aggregated into a rolling calculation, allowing traders to see which side dominates and how directional imbalance evolves.
🔵 CONCEPTS
Each new highest high → adds a bullish count (+1).
Each new lowest low → adds a bearish count (+1).
Counts are stored inside arrays over a user-defined Calculation Period .
for i = 0 to period-1
h = high
l = low
if h == upper
countUp.push(1)
if l == lower
countDn.push(1)
The balance between bullish and bearish counts highlights dominance and imbalance.
Normalized percentages help compare both sides (e.g., 65% bullish vs 35% bearish).
🔵 FEATURES
Counts new highs/lows over a chosen Highest/Lowest Length .
Aggregates values over a rolling Calculation Period .
Plots cumulative bullish vs bearish totals in the subchart.
Displays % share of bulls vs bears from total counts.
On-chart labels mark bars where a count was added.
Plots reference lines of the current upper (high) and lower (low) ranges.
Dynamic fill between bullish/bearish plots to visualize which side dominates.
🔵 HOW TO USE
Look for persistent bullish imbalance (bull % > bear %) as confirmation of upward momentum.
Look for persistent bearish imbalance (bear % > bull %) as confirmation of downward momentum.
Watch for shifts in % dominance — often early signs of trend reversal or weakening strength.
Use labels on the chart to visually confirm which bars contributed to directional bias.
Combine with trend or volume tools to confirm whether imbalance aligns with market direction.
🔵 CONCLUSION
The Directional Imbalance Index offers a systematic way to measure directional pressure. By counting how often price pushes into new territory, the indicator reveals whether bulls or bears are taking control. This makes it a valuable tool for detecting early signs of trend continuation or exhaustion, helping traders align with the side most likely to dominate.

Smart Money Concepts [XoRonX]# Smart Money Concepts (SMC) - Advanced Trading Indicator
## 📊 Deskripsi
**Smart Money Concepts ** adalah indicator trading komprehensif yang menggabungkan konsep Smart Money Trading dengan berbagai alat teknikal analisis modern. Indicator ini dirancang untuk membantu trader mengidentifikasi pergerakan institusional (smart money), struktur pasar, zona supply/demand, dan berbagai sinyal trading penting.
Indicator ini mengintegrasikan multiple timeframe analysis, order blocks detection, fair value gaps, fibonacci retracement, volume profile, RSI multi-timeframe, dan moving averages dalam satu platform yang powerful dan mudah digunakan.
---
## 🎯 Fitur Utama
### 1. **Smart Money Structure**
- **Internal Structure** - Struktur pasar jangka pendek untuk entry presisi
- **Swing Structure** - Struktur pasar jangka panjang untuk trend analysis
- **BOS (Break of Structure)** - Konfirmasi kelanjutan trend
- **CHoCH (Change of Character)** - Deteksi potensi reversal
### 2. **Order Blocks**
- **Internal Order Blocks** - Zona demand/supply jangka pendek
- **Swing Order Blocks** - Zona demand/supply jangka panjang
- Filter otomatis berdasarkan volatilitas (ATR/Range)
- Mitigation tracking (High/Low atau Close)
- Customizable display (jumlah order blocks yang ditampilkan)
### 3. **Equal Highs & Equal Lows (EQH/EQL)**
- Deteksi otomatis equal highs/lows
- Indikasi liquidity zones
- Threshold adjustment untuk sensitivitas
- Visual lines dan labels
### 4. **Fair Value Gaps (FVG)**
- Multi-timeframe FVG detection
- Auto threshold filtering
- Bullish & Bearish FVG boxes
- Extension control
- Color customization
### 5. **Premium & Discount Zones**
- Premium Zone (75-100% dari range)
- Equilibrium Zone (47.5-52.5% dari range)
- Discount Zone (0-25% dari range)
- Auto-update berdasarkan swing high/low
### 6. **Fibonacci Retracement**
- **Equilibrium to Discount** - Fib dari EQ ke discount zone
- **Equilibrium to Premium** - Fib dari EQ ke premium zone
- **Discount to Premium** - Fib full range
- Reverse option
- Show/hide lines
- Custom colors
### 7. **Volume Profile (VRVP)**
- Visible Range Volume Profile
- Point of Control (POC)
- Value Area (70% volume)
- Auto-adjust rows
- Placement options (Left/Right)
- Width customization
### 8. **RSI Multi-Timeframe**
- Monitor 3 timeframes sekaligus
- Overbought/Oversold signals
- Visual table display
- Color-coded signals (Red OB, Green OS)
- Customizable position & size
### 9. **Moving Averages**
- 3 Moving Average lines
- Pilihan tipe: EMA, SMA, WMA
- Automatic/Manual period mode
- Individual color & width settings
- Cross alerts (MA vs MA, Price vs MA)
### 10. **Multi-Timeframe Levels**
- Support up to 5 different timeframes
- Previous high/low levels
- Custom line styles
- Color customization
### 11. **Candle Color**
- Color candles berdasarkan trend
- Bullish = Green, Bearish = Red
- Optional toggle
---
## 🛠️ Cara Penggunaan
### **A. Setup Awal**
1. **Tambahkan Indicator ke Chart**
- Buka TradingView
- Klik "Indicators" → "My Scripts" atau paste code
- Pilih "Smart Money Concepts "
2. **Pilih Mode Display**
- **Historical**: Tampilkan semua struktur (untuk backtesting)
- **Present**: Hanya tampilkan struktur terbaru (clean chart)
3. **Pilih Style**
- **Colored**: Warna berbeda untuk bullish/bearish
- **Monochrome**: Tema warna abu-abu
---
### **B. Penggunaan Fitur**
#### **1. Smart Money Structure**
**Internal Structure (Real-time):**
- ✅ Aktifkan "Show Internal Structure"
- Pilih tampilan: All, BOS only, atau CHoCH only
- Gunakan untuk entry timing presisi
- Filter confluence untuk mengurangi noise
**Swing Structure:**
- ✅ Aktifkan "Show Swing Structure"
- Pilih tampilan struktur bullish/bearish
- Adjust "Swings Length" (default: 50)
- Gunakan untuk konfirmasi trend utama
**Tips:**
- BOS = Konfirmasi trend continuation
- CHoCH = Warning untuk possible reversal
- Tunggu price retest ke order block setelah BOS
---
#### **2. Order Blocks**
**Setup:**
- ✅ Aktifkan Internal/Swing Order Blocks
- Set jumlah blocks yang ditampil (1-20)
- Pilih filter: ATR atau Cumulative Mean Range
- Pilih mitigation: Close atau High/Low
**Cara Trading:**
1. Tunggu BOS/CHoCH terbentuk
2. Identifikasi order block terdekat
3. Wait for price pullback ke order block
4. Entry saat price respek order block (rejection)
5. Stop loss di bawah/atas order block
6. Target: swing high/low berikutnya
**Color Code:**
- 🔵 Light Blue = Internal Bullish OB
- 🔴 Light Red = Internal Bearish OB
- 🔵 Dark Blue = Swing Bullish OB
- 🔴 Dark Red = Swing Bearish OB
---
#### **3. Equal Highs/Lows (EQH/EQL)**
**Setup:**
- ✅ Aktifkan "Equal High/Low"
- Set "Bars Confirmation" (default: 3)
- Adjust threshold (0-0.5, default: 0.1)
**Interpretasi:**
- EQH = Liquidity di atas, kemungkinan sweep lalu dump
- EQL = Liquidity di bawah, kemungkinan sweep lalu pump
- Biasanya smart money akan grab liquidity sebelum move besar
**Trading Strategy:**
- Wait for EQH/EQL formation
- Anticipate liquidity grab
- Entry setelah sweep dengan konfirmasi (order block, FVG, CHoCH)
---
#### **4. Fair Value Gaps (FVG)**
**Setup:**
- ✅ Aktifkan "Fair Value Gaps"
- Pilih timeframe (default: chart timeframe)
- Enable/disable auto threshold
- Set extension bars
**Cara Trading:**
1. Bullish FVG = Support zone untuk buy
2. Bearish FVG = Resistance zone untuk sell
3. Price tends to fill FVG (retest)
4. Entry saat price kembali ke FVG
5. Partial fill = valid, full fill = invalidated
**Tips:**
- FVG + Order Block = High probability setup
- Multi-timeframe FVG lebih kuat
- Unfilled FVG = strong momentum
---
#### **5. Premium & Discount Zones**
**Setup:**
- ✅ Aktifkan "Premium/Discount Zones"
- Zones akan auto-update berdasarkan swing high/low
**Interpretasi:**
- 🟢 **Discount Zone** = Area BUY (price murah)
- ⚪ **Equilibrium** = Neutral (50%)
- 🔴 **Premium Zone** = Area SELL (price mahal)
**Trading Strategy:**
- BUY dari discount zone
- SELL dari premium zone
- Avoid trading di equilibrium
- Combine dengan structure confirmation
---
#### **6. Fibonacci Retracement**
**Setup:**
- Pilih Fib yang ingin ditampilkan:
- Equilibrium to Discount
- Equilibrium to Premium
- Discount to Premium
- Toggle show lines
- Enable reverse jika perlu
- Custom colors
**Key Levels:**
- 0.236 = Shallow retracement
- 0.382 = Common retracement
- 0.5 = 50% golden level
- 0.618 = Golden ratio (penting!)
- 0.786 = Deep retracement
**Cara Pakai:**
- 0.618-0.786 = Ideal entry zone dalam trend
- Combine dengan order blocks
- Wait for confirmation candle
---
#### **7. Volume Profile (VRVP)**
**Setup:**
- ✅ Aktifkan "Show Volume Profile"
- Set jumlah rows (10-100)
- Adjust width (5-50%)
- Pilih placement (Left/Right)
- Enable POC dan Value Area
**Interpretasi:**
- **POC (Point of Control)** = Harga dengan volume tertinggi = magnet
- **Value Area** = 70% volume = fair price range
- **Low Volume Nodes** = Weak support/resistance
- **High Volume Nodes** = Strong support/resistance
**Trading:**
- POC acts as support/resistance
- Price tends to return to POC
- Breakout dari Value Area = momentum
---
#### **8. RSI Multi-Timeframe**
**Setup:**
- ✅ Aktifkan "Show RSI Table"
- Set 3 timeframes (default: chart, 5m, 15m)
- Set RSI period (default: 14)
- Set Overbought level (default: 70)
- Set Oversold level (default: 30)
- Pilih posisi & ukuran table
**Interpretasi:**
- 🟢 **OS (Oversold)** = RSI ≤ 30 = Kondisi jenuh jual
- 🔴 **OB (Overbought)** = RSI ≥ 70 = Kondisi jenuh beli
- **-** = Neutral zone
**Trading Strategy:**
1. Multi-timeframe alignment = strong signal
2. OS + Bullish structure = BUY signal
3. OB + Bearish structure = SELL signal
4. Divergence RSI vs Price = reversal warning
**Contoh:**
- TF1: OS, TF2: OS, TF3: OS + Price di discount zone = STRONG BUY
---
#### **9. Moving Averages**
**Setup:**
- Pilih MA Type: EMA, SMA, atau WMA (berlaku untuk ketiga MA)
- Pilih Period Mode: Automatic atau Manual
- Set period untuk MA 1, 2, 3 (default: 20, 50, 100)
- Custom color & width per MA
- ✅ Enable Cross Alerts
**Interpretasi:**
- **Golden Cross** = MA fast cross above MA slow = Bullish
- **Death Cross** = MA fast cross below MA slow = Bearish
- Price above all MAs = Strong uptrend
- Price below all MAs = Strong downtrend
**Trading Strategy:**
1. MA1 (20) = Short-term trend
2. MA2 (50) = Medium-term trend
3. MA3 (100) = Long-term trend
**Entry Signals:**
- Price bounce dari MA dalam trend = continuation
- MA cross dengan konfirmasi structure = entry
- Multiple MA confluence = strong support/resistance
**Alerts Available:**
- MA1 cross MA2/MA3
- MA2 cross MA3
- Price cross any MA
---
#### **10. Multi-Timeframe Levels**
**Setup:**
- Enable HTF Level 1-5
- Set timeframes (contoh: 5m, 1H, 4H, D, W)
- Pilih line style (solid/dashed/dotted)
- Custom colors
**Cara Pakai:**
- Previous high/low dari HTF = strong S/R
- Breakout HTF level = significant move
- Multiple HTF levels confluence = major zone
---
### **C. Trading Setup Combination**
#### **Setup 1: High Probability Buy (Bullish)**
1. ✅ Swing structure: Bullish BOS
2. ✅ Price di Discount Zone
3. ✅ Pullback ke Bullish Order Block
4. ✅ Bullish FVG di bawah
5. ✅ RSI Multi-TF: Oversold
6. ✅ Price bounce dari MA
7. ✅ POC/Value Area support
8. ✅ Fibonacci 0.618-0.786 retracement
**Entry:** Saat price reject dari order block dengan confirmation candle
**Stop Loss:** Below order block
**Target:** Swing high atau premium zone
---
#### **Setup 2: High Probability Sell (Bearish)**
1. ✅ Swing structure: Bearish BOS
2. ✅ Price di Premium Zone
3. ✅ Pullback ke Bearish Order Block
4. ✅ Bearish FVG di atas
5. ✅ RSI Multi-TF: Overbought
6. ✅ Price reject dari MA
7. ✅ POC/Value Area resistance
8. ✅ Fibonacci 0.618-0.786 retracement
**Entry:** Saat price reject dari order block dengan confirmation candle
**Stop Loss:** Above order block
**Target:** Swing low atau discount zone
---
#### **Setup 3: Liquidity Grab (EQH/EQL)**
1. ✅ Identifikasi EQH atau EQL
2. ✅ Wait for liquidity sweep
3. ✅ Konfirmasi dengan CHoCH
4. ✅ Order block terbentuk setelah sweep
5. ✅ Entry saat retest order block
---
### **D. Tips & Best Practices**
**Risk Management:**
- Selalu gunakan stop loss
- Risk 1-2% per trade
- Risk:Reward minimum 1:2
- Jangan over-leverage
**Confluence adalah Kunci:**
- Minimal 3-4 konfirmasi sebelum entry
- Lebih banyak konfirmasi = higher probability
- Quality over quantity
**Timeframe Analysis:**
- HTF (Higher Timeframe) = Trend direction
- LTF (Lower Timeframe) = Entry timing
- Align dengan HTF trend
**Backtesting:**
- Gunakan mode "Historical"
- Test strategy di berbagai market condition
- Record dan analyze hasil
**Market Condition:**
- Trending market = Follow BOS, use order blocks
- Ranging market = Use premium/discount zones, EQH/EQL
- High volatility = Wider stops, wait for clear structure
**Avoid:**
- Trading di equilibrium zone
- Entry tanpa konfirmasi
- Fighting the trend
- Overleveraging
- Emotional trading
---
## 📈 Recommended Settings
### **For Scalping (1m - 5m):**
- Internal Structure: ON
- Swing Structure: OFF
- Order Blocks: Internal only
- RSI Timeframes: 1m, 5m, 15m
- MA Periods: 9, 21, 50
### **For Day Trading (15m - 1H):**
- Internal Structure: ON
- Swing Structure: ON
- Order Blocks: Both
- RSI Timeframes: 15m, 1H, 4H
- MA Periods: 20, 50, 100
### **For Swing Trading (4H - D):**
- Internal Structure: OFF
- Swing Structure: ON
- Order Blocks: Swing only
- RSI Timeframes: 4H, D, W
- MA Periods: 20, 50, 200
---
## ⚠️ Disclaimer
Indicator ini adalah alat bantu analisis teknikal. Tidak ada indicator yang 100% akurat. Selalu:
- Lakukan analisa fundamental
- Gunakan proper risk management
- Praktik di demo account terlebih dahulu
- Trading memiliki resiko, trade at your own risk
---
## 📝 Version Info
**Version:** 5.0
**Platform:** TradingView Pine Script v5
**Author:** XoRonX
**Max Labels:** 500
**Max Lines:** 500
**Max Boxes:** 500
---
## 🔄 Updates & Support
Untuk update, bug reports, atau pertanyaan:
- Check documentation regularly
- Test new features in replay mode
- Backup your settings before updates
---
## 🎓 Learning Resources
**Recommended Study:**
1. Smart Money Concepts (SMC) basics
2. Order blocks theory
3. Liquidity concepts
4. ICT (Inner Circle Trader) concepts
5. Volume profile analysis
6. Multi-timeframe analysis
**Practice:**
- Start with higher timeframes
- Master one concept at a time
- Keep a trading journal
- Review your trades weekly
---
**Happy Trading! 🚀📊**
_Remember: The best indicator is your own analysis and discipline._

Rasta Long/Short — StrategyThe Rasta Long/Short Strategy is a visual and educational framework designed to help traders study momentum shifts that appear when a fast EMA interacts with a slower smoothed baseline.
It is not a signal service. Instead, it is a research tool that helps you observe transitions, structure, and behavior across different market conditions and smoothing contexts.
The script plots:
A primary EMA line (fast reaction wave).
A Smoothed line (your chosen smoothing method).
Color-coded fog regions showing directional bias.
Optional DNA rung connections between the two lines for structural comparison.
Together, these allow a deeper study of how momentum pushes, volatility compression, expansions, and drift emerge around fast/slow EMA interactions.
✦ Core Idea
The Rasta Long/Short mechanism studies how price behaves when the fast EMA crosses above or below a smoothed anchor.
Rather than predicting price, it reveals where transitions occur across different structures, timeframes, and smoothing techniques.
The Long/Short logic simply highlights flips in directional structure.
It is not intended for real-time signals or automated execution; it is intended for understanding market movement.
✦ Smoothing Types (Explained)
The strategy allows experimenting with several smoothing families to observe how they transform the fast EMA:
SMA (Simple Moving Average)
Averaged, slower response. Good for stability comparisons.
EMA (Exponential)
Faster reaction, more responsive, smoother behavior during momentum.
RMA (Wilder’s)
Used in RSI calculations; steady, well-balanced response.
WMA (Weighted)
More weight to recent bars; bridges SMA and EMA dynamics.
None
Raw EMA vs EMA interaction with no secondary smoothing.
Each smoothing type provides unique structural information and can lead to different interpretations.
✦ Modes of Study
Designed for multi-timeframe research:
1H / 4H — Momentum flow mapping and structural identification.
Daily / Weekly — Higher-timeframe rotations, macro structure transitions.
1–15m — Microstructure studies, noise vs trend emergence.
Use the built-in Strategy Tester to explore entry/exit context, but treat results as research, not predictive performance.
✦ Components (Visual Study Tools)
EMA Line (Fast)
Primary reactive wave. Shows fast directional shifts.
Smoothed Line (Slow)
Trend baseline / reference structure.
Fog Region
Highlights fast-vs-smoothed directional alignment.
DNA Rungs (Optional)
Structural “bridges” showing the exact relationship between waves on each bar.
Useful for studying separation, compression, and expansions.
✦ Educational Insights
This strategy helps illuminate:
How fast and slow EMAs interact dynamically.
How structure changes precede trend emergence.
Where volatility compresses before expansion.
How noise, drift, and clean reversals differ.
How different smoothers alter the interpretation of the same price data.
The goal is clarity — not prediction.
✦ How to Use
Apply to any timeframe or instrument.
Enable or disable fog depending on preferred visibility.
Use DNA rungs for close structural comparison.
Observe long/short flips as educational reference points — not signals.
Study transitions visually, then backtest using the Strategy Tester for pattern research.
✦ Disclaimer
This script is provided for educational and research purposes only.
It does not provide trading signals, financial advice, or recommendations.
Past behavior does not indicate future performance.
Always practice risk-aware study and consult qualified financial professionals when needed.
✦ Author
Michael Culpepper (mikeyc747)
Creator of the Rasta framework and related market structure studies.

EPS Estimate Profile [SS]This is the EPS Estimate Profile indicator.
What it does
This indicator
Collects all EPS estimates over the course of a lookback and BINS them (sorts them into 10 equal sized categories).
Analyzes the returns from earnings releases based on the EPS estimate and the reaction.
Calculates the number of bullish vs bearish responses that transpired based on the EPS estimate profile.
Calculates the expected Open to High and Open to Low ATR based on the EPS estimate using regression.
Toggle to actual EPS release to compare once earnings results are released.
How to Use it
This indicator can be used to gain insight into whether an earnings release will be received bullishly or bearishly based on the company's EPS estimate.
The indicator allows you to see all historic estimates and how the market generally responded to those estimates, as well as a breakdown of how many times estimates in those ranges produced a bullish response or a bearish response to earnings.
Examples
Let's look at some examples:
Here is MSFT. MSFT's last EPS estimate was 3.672.
If we consult the table, we can see the average return associated with this estimate range is -4%.
Now let's flip to the Daily timeframe and take a look:
MSFT ended the day red and continued to sell into the coming days.
Let's look at another example:
MCDs. Last earnings estimate was 3.327, putting it at the top of the range with an average positive return of 4%.
Let's look on the daily:
We can see that the earnings had a huge, bullish effect on MCD, despite them coming in below their estimates.
If we toggle the indicator to "Actual" EPS release, to see the profile of Actual earnings releases vs response, we get this:
Since MCD under-performed, they were still at the top of the profile; but, we can see that the expected returns are more muted now, though still positive. And indeed, the reaction was still positive.
Distinguishing % Bullish/Bearish to Avg Returns
You will see the profile table displays both the average returns and the percent of bullish/bearish responses. In some cases, you will see that, despite a negative return, the profile reveals more bullish reactions than bearish.
What does this mean?
It means, despite there being more bullish responses, when bearish responses happen they tend to be more severe and profound, vs bullish responses likely are muted.
This can alert you to potential downside risk and help you manage risk accordingly should you elect to trade the earnings release.
ATR Prediction
You will notice in the bottom right corner of the screen a secondary table that lists the predicted open to high ATR and open to low ATR.
This is done using RAW EPS estimates (or raw ACTUAL estimates depending on which you select) and performing a regression to determine the expected ATR.
This is only for reference, the analysis should focus around the historic profile of return estimates and actual return values.
IMPORTANT NOTE: You MUST be on the Monthly timeframe to use this. Otherwise, you will get an error. If, on certain tickers with a huge history, such as MSFT and XOM or OXY, you get an error, you can simply reduce the lookback length to 80 and this will resolve the issue.
Conclusion
And that's the indicator!
A blend of some light math and fundamentals! A real joy honestly.
Hope you enjoy it!

Pinbar MTF - No Repaint# Pinbar MTF - No Repaint Indicator
## Complete Technical Documentation
---
## 📊 Overview
**Pinbar MTF (Multi-Timeframe) - No Repaint** is a professional-grade TradingView Pine Script indicator designed to detect high-probability pinbar reversal patterns with advanced filtering systems. The indicator is specifically engineered to be **100% non-repainting**, making it reliable for both live trading and backtesting.
### Key Features
✅ **Non-Repainting** - Signals only appear AFTER bar closes, never disappear
✅ **Three-Layer Filter System** - ATR, SWING, and RSI filters
✅ **Automatic SL/TP Calculation** - Based on risk:reward ratios
✅ **Real-time Alerts** - TradingView notifications for all signals
✅ **Visual Trade Management** - Lines, labels, and areas for entries, stops, and targets
✅ **Backtesting Ready** - Reliable historical data for strategy testing
---
## 🎯 What is a Pinbar?
A **Pinbar (Pin Bar/Pinocchio Bar)** is a single candlestick pattern that indicates a potential price reversal:
### Bullish Pinbar (BUY Signal)
- **Long lower wick** (rejection of lower prices)
- **Small body at the top** of the candle
- Shows buyers rejected sellers' attempt to push price down
- Forms at support levels or swing lows
- Entry signal for LONG positions
### Bearish Pinbar (SELL Signal)
- **Long upper wick** (rejection of higher prices)
- **Small body at the bottom** of the candle
- Shows sellers rejected buyers' attempt to push price up
- Forms at resistance levels or swing highs
- Entry signal for SHORT positions
---
## 🔧 How the Indicator Works
### 1. **Pinbar Detection Logic**
The indicator analyzes the **previous closed bar ** to identify pinbar patterns:
```
Bullish Pinbar Requirements:
- Lower wick > 72% of total candle range (adjustable)
- Upper wick < 28% of total candle range
- Close > Open (bullish candle body)
Bearish Pinbar Requirements:
- Upper wick > 72% of total candle range (adjustable)
- Lower wick < 28% of total candle range
- Close < Open (bearish candle body)
```
**Why check ?** By analyzing the previous completed bar, we ensure the pattern is fully formed and won't change, preventing repainting.
---
### 2. **Three-Layer Filter System**
#### 🔍 **Filter #1: ATR (Average True Range) Filter**
- **Purpose**: Ensures the pinbar has significant size
- **Function**: Only signals if pinbar range ≥ ATR value
- **Benefit**: Filters out small, insignificant pinbars
- **Settings**:
- Enable/Disable toggle
- ATR Period (default: 7)
**Example**: If ATR = 50 pips, only pinbars with 50+ pip range will signal.
---
#### 🔍 **Filter #2: SWING Filter** (Always Active)
- **Purpose**: Confirms pinbar forms at swing highs/lows
- **Function**: Validates the pinbar is an absolute high/low
- **Benefit**: Identifies true reversal points
- **Settings**:
- Swing Candles (default: 3)
**How it works**:
- For bullish pinbar: Checks if low is lowest of past 3 bars
- For bearish pinbar: Checks if high is highest of past 3 bars
**Example**: With 3 swing candles, a bullish pinbar must have the lowest low among the last 3 bars.
---
#### 🔍 **Filter #3: RSI (Relative Strength Index) Filter**
- **Purpose**: Confirms momentum conditions
- **Function**: Prevents signals in extreme momentum zones
- **Benefit**: Avoids counter-trend trades
- **Settings**:
- Enable/Disable toggle
- RSI Period (default: 7)
- RSI Source (Close, Open, High, Low, HL2, HLC3, OHLC4)
- Overbought Level (default: 70)
- Oversold Level (default: 30)
**Logic**:
- Bullish Pinbar: Only signals if RSI < 70 (not overbought)
- Bearish Pinbar: Only signals if RSI > 30 (not oversold)
---
### 3. **Stop Loss Calculation**
Two methods available:
#### Method A: ATR-Based Stop Loss (Recommended)
```
Bullish Pinbar:
SL = Pinbar Low - (1 × ATR)
Bearish Pinbar:
SL = Pinbar High + (1 × ATR)
```
**Benefit**: Dynamic stops that adapt to market volatility
#### Method B: Fixed Pips Stop Loss
```
Bullish Pinbar:
SL = Pinbar Low - (Fixed Pips)
Bearish Pinbar:
SL = Pinbar High + (Fixed Pips)
```
**Settings**:
- Calculate Stop with ATR (toggle)
- Stop Pips without ATR (default: 5)
---
### 4. **Take Profit Calculation**
Take Profit is calculated based on Risk:Reward ratio:
```
Bullish Trade:
TP = Entry + (Entry - SL) × Risk:Reward Ratio
Bearish Trade:
TP = Entry - (SL - Entry) × Risk:Reward Ratio
```
**Example**:
- Entry: 1.2000
- SL: 1.1950 (50 pip risk)
- RR: 2:1
- TP: 1.2100 (100 pip reward = 50 × 2)
**Settings**:
- Risk:Reward Ratio (default: 1.0, range: 0.1 to 10.0)
---
## 📈 Visual Elements
### On-Chart Displays
1. **Signal Markers**
- 🟢 **Green Triangle Up** = Bullish Pinbar (BUY)
- 🔴 **Red Triangle Down** = Bearish Pinbar (SELL)
- Placed directly on the pinbar candle
2. **Entry Labels**
- Green "BUY" label with entry price
- Red "SELL" label with entry price
- Shows exact entry level
3. **Stop Loss Lines**
- 🔴 Red horizontal line
- "SL" label
- Extends 20 bars forward
4. **Take Profit Lines**
- 🟢 Green horizontal line
- "TP" label
- Extends 20 bars forward
5. **Risk/Reward Areas** (Optional)
- Red shaded box = Risk zone (Entry to SL)
- Green shaded box = Reward zone (Entry to TP)
- Visual risk:reward visualization
6. **Info Table** (Top Right)
- Displays current settings
- Shows filter status (ON/OFF)
- Real-time RSI value
- Quick reference panel
---
## 🔔 Alert System
Three alert types available:
### 1. Combined Alert: "Pinbar Signal (Any Direction)"
- Fires for BOTH bullish and bearish pinbars
- **Best for**: General monitoring
- **Message**: "Pinbar Signal Detected on {TICKER} at {PRICE}"
### 2. Bullish Alert: "Bullish Pinbar Alert"
- Fires ONLY for BUY signals
- **Best for**: Long-only strategies
- **Message**: "BUY Signal on {TICKER} at {PRICE}"
### 3. Bearish Alert: "Bearish Pinbar Alert"
- Fires ONLY for SELL signals
- **Best for**: Short-only strategies
- **Message**: "SELL Signal on {TICKER} at {PRICE}"
---
## ⚙️ Input Parameters Reference
### **Filters Group**
| Parameter | Default | Range | Description |
|-----------|---------|-------|-------------|
| ATR Filter on Pinbar Range? | ✅ ON | Boolean | Enable/disable ATR filter |
| ATR Period | 7 | 1+ | Lookback period for ATR calculation |
| Swing Candles | 3 | 1+ | Bars to check for swing high/low |
| RSI Filter on Pinbar? | ❌ OFF | Boolean | Enable/disable RSI filter |
| RSI Period | 7 | 2+ | Lookback period for RSI calculation |
| RSI Source | Close | Multiple | Price data for RSI (Close/Open/High/Low/etc) |
| RSI Overbought Level | 70 | 50-100 | Upper threshold for RSI filter |
| RSI Oversold Level | 30 | 0-50 | Lower threshold for RSI filter |
### **Pinbar Detection Group**
| Parameter | Default | Range | Description |
|-----------|---------|-------|-------------|
| Shadow % vs Body | 72 | 50-95 | Minimum wick size as % of total range |
### **Visualization Group**
| Parameter | Default | Range | Description |
|-----------|---------|-------|-------------|
| Show SL and TP Lines? | ✅ ON | Boolean | Display stop loss and take profit lines |
| Show SL and TP Area? | ❌ OFF | Boolean | Show shaded risk/reward boxes |
### **Risk Management Group**
| Parameter | Default | Range | Description |
|-----------|---------|-------|-------------|
| Risk:Reward Ratio | 1.0 | 0.1-10.0 | Target profit vs risk (1.0 = 1:1, 2.0 = 1:2) |
| Calculate Stop with ATR? | ✅ ON | Boolean | Use ATR for stop calculation |
| Stop Pips without ATR | 5 | 1+ | Fixed pip stop when ATR disabled |
---
## 🚫 Non-Repainting Architecture
### What is Repainting?
**Repainting** occurs when an indicator's historical signals differ from what appeared in real-time. This makes backtesting unreliable and can lead to false confidence in a strategy.
### How This Indicator Prevents Repainting
1. **Closed Bar Analysis**
- All calculations use ` ` offset (previous bar)
- Only analyzes COMPLETED candles
- Signals appear on the bar AFTER the pinbar closes
2. **Confirmed Swing Points**
- Waits for sufficient bar history before signaling
- Only checks historical bars that cannot change
- Prevents premature swing detection
3. **Static Alert Timing**
- Alerts fire only after bar completion
- No conditional logic that changes historically
- Same results in replay mode and live trading
### Verification Method
To verify non-repainting behavior:
1. Apply indicator to chart
2. Note signal locations and prices
3. Refresh browser / reload chart
4. **Signals remain in exact same locations**
---
## 💼 Trading Strategy Guidelines
### Entry Rules
**For Bullish Pinbar (LONG):**
1. Wait for green triangle to appear
2. Enter at close of pinbar (shown in label)
3. Alternative: Enter on break of pinbar high
4. Place stop loss at red SL line
5. Set target at green TP line
**For Bearish Pinbar (SHORT):**
1. Wait for red triangle to appear
2. Enter at close of pinbar (shown in label)
3. Alternative: Enter on break of pinbar low
4. Place stop loss at red SL line
5. Set target at green TP line
### Risk Management
- **Position Sizing**: Risk only 1-2% of account per trade
- **Stop Loss**: Always use the calculated SL (never move it wider)
- **Take Profit**: Use calculated TP or trail stop after 1:1 RR
- **Multiple Timeframes**: Confirm signals on higher timeframe
### Best Practices
✅ **DO:**
- Wait for bar to close before entering
- Trade in direction of higher timeframe trend
- Use on liquid markets with clear support/resistance
- Combine with price action analysis
- Keep a trading journal
❌ **DON'T:**
- Enter before bar closes (prevents seeing full pattern)
- Trade against strong trends
- Ignore the filters (they improve win rate)
- Risk more than 2% per trade
- Trade every signal (be selective)
---
## 📊 Backtesting & Data Export
### Available Data Points
The indicator exports these values for strategy development:
| Output | Description |
|--------|-------------|
| Bullish Signal | 1 = BUY signal, 0 = No signal |
| Bearish Signal | 1 = SELL signal, 0 = No signal |
| Bull SL | Stop loss level for long trades |
| Bull TP | Take profit level for long trades |
| Bull Entry | Entry price for long trades |
| Bear SL | Stop loss level for short trades |
| Bear TP | Take profit level for short trades |
| Bear Entry | Entry price for short trades |
### How to Use in Strategy
These values can be accessed by Pine Script strategies using:
```pine
indicator_values = request.security(syminfo.tickerid, timeframe.period,
)
```
---
## 🎓 Understanding the Filters
### Why Use Multiple Filters?
Single-indicator systems often generate too many false signals. This indicator uses a **confluence approach**:
1. **Pinbar Pattern** = Price rejection detected
2. **+ SWING Filter** = Rejection at key level
3. **+ ATR Filter** = Significant move
4. **+ RSI Filter** = Favorable momentum
**Result**: Higher probability setups with better risk:reward
### Filter Optimization
**Conservative Settings** (Fewer, Higher Quality Signals):
- ATR Filter: ON
- Swing Candles: 5
- RSI Filter: ON
- Shadow %: 75%
**Aggressive Settings** (More Signals, More Noise):
- ATR Filter: OFF
- Swing Candles: 2
- RSI Filter: OFF
- Shadow %: 65%
**Balanced Settings** (Recommended):
- ATR Filter: ON
- Swing Candles: 3
- RSI Filter: OFF (or ON for trending markets)
- Shadow %: 72%
---
## 🔍 Troubleshooting
### "No Signals Appearing"
**Possible Causes:**
1. Filters are too strict
2. No pinbars forming on chart
3. Insufficient bar history
**Solutions:**
- Reduce Shadow % to 65%
- Reduce Swing Candles to 2
- Disable ATR or RSI filters temporarily
- Check that chart has enough data loaded
### "Too Many Signals"
**Solutions:**
- Enable ATR filter
- Increase Swing Candles to 4-5
- Enable RSI filter
- Increase Shadow % to 75-80%
### "Signals Appearing Late"
**This is normal behavior!** The indicator:
- Analyzes previous closed bar
- Signals appear on the bar AFTER the pinbar
- This is what prevents repainting
- Signal latency is 1 bar (by design)
---
## 📝 Technical Specifications
**Indicator Type:** Overlay (displays on price chart)
**Pine Script Version:** 5
**Max Labels:** 500
**Max Lines:** 500
**Repainting:** None (100% non-repainting)
**Data Window Values:** 8 exported values
**Alert Types:** 3 (Combined, Bullish, Bearish)
**Performance:**
- Lightweight script (fast execution)
- Works on all timeframes
- Compatible with all markets (Forex, Crypto, Stocks, Futures)
- No data snooping bias
---
## 🎯 Use Cases
### 1. **Swing Trading**
- Timeframe: Daily, 4H
- Filter Settings: All enabled
- Best for: Catching major reversals
### 2. **Day Trading**
- Timeframe: 15m, 1H
- Filter Settings: ATR + SWING only
- Best for: Intraday reversals
### 3. **Scalping**
- Timeframe: 5m, 15m
- Filter Settings: SWING only (aggressive)
- Best for: Quick reversals (requires experience)
### 4. **Position Trading**
- Timeframe: Weekly, Daily
- Filter Settings: All enabled + high RR (2:1 or 3:1)
- Best for: Long-term trend reversal catches
---
## 🏆 Advantages Over Other Pinbar Indicators
✅ **Guaranteed Non-Repainting** - Many pinbar indicators repaint; this one never does
✅ **Automatic SL/TP** - No manual calculation needed
✅ **Multi-Layer Filtering** - Reduces false signals significantly
✅ **Visual Trade Management** - Clear entry, stop, and target levels
✅ **Flexible Configuration** - Adaptable to any trading style
✅ **Alert System** - Never miss a setup
✅ **Backtesting Ready** - Reliable historical data
✅ **Professional Grade** - Suitable for live trading
---
## 📚 Educational Resources
### Recommended Reading on Pinbars
- "The Pin Bar Trading Strategy" by Nial Fuller
- "Price Action Trading" by Al Brooks
- TradingView Education: Price Action Patterns
### Practice Recommendations
1. Paper trade signals for 20+ trades before live trading
2. Backtest on different timeframes and markets
3. Keep detailed records of all trades
4. Analyze winning vs losing setups
5. Refine filter settings based on results
---
## ⚖️ Disclaimer
This indicator is a tool for technical analysis and does not guarantee profits. Trading involves substantial risk of loss. Past performance is not indicative of future results.
- Always use proper risk management
- Never risk more than you can afford to lose
- Consider your trading experience and objectives
- Seek independent financial advice if needed
---
## 📧 Version Information
**Current Version:** 1.0
**Last Updated:** 2024
**Compatibility:** TradingView Pine Script v5
**Status:** Production Ready
---
## 🔄 Future Enhancements (Potential)
Possible future additions:
- Multi-timeframe confirmation option
- Volume filter integration
- Customizable color schemes
- Win rate statistics display
- Partial profit taking levels
- Trailing stop functionality
---
## 📖 Quick Start Guide
### 5-Minute Setup
1. **Add to Chart**
- Open TradingView
- Go to Pine Editor
- Paste the code
- Click "Add to Chart"
2. **Configure Settings**
- Open indicator settings (gear icon)
- Start with default settings
- Enable "Show SL and TP Lines"
3. **Set Alert**
- Right-click indicator name
- Click "Add Alert"
- Select "Pinbar Signal (Any Direction)"
- Configure notification method
4. **Test**
- Scroll back on chart
- Verify signals make sense
- Check that signals don't repaint
5. **Trade** (After Practice!)
- Wait for alert
- Verify signal quality
- Enter, place SL/TP
- Manage trade
---
## 🎯 Final Thoughts
The **Pinbar MTF - No Repaint** indicator is designed for serious traders who value:
- **Reliability** over flashy signals
- **Quality** over quantity
- **Honesty** over false promises
This indicator will NOT:
- Make you rich overnight
- Win every trade
- Replace proper trading education
This indicator WILL:
- Identify high-probability reversal setups
- Save you analysis time
- Provide consistent, non-repainting signals
- Help you develop a systematic trading approach
**Success in trading comes from:**
1. Proper education (60%)
2. Risk management (30%)
3. Technical tools like this indicator (10%)
Use this tool as part of a complete trading plan, not as a standalone solution.

COT Index v.2COT Index v.2 Indicator
( fix for extreme values)
📊 Overview
The COT (Commitment of Traders) Index Indicator transforms raw COT data into normalized indices ranging from 0-100, with extensions to 120 and -20 for extreme market conditions. This powerful tool helps traders analyze institutional positioning and market sentiment by tracking the net long positions of three key market participant groups.
🎯 What It Does
This indicator converts weekly CFTC Commitment of Traders data into easy-to-read oscillator format, showing:
Commercial Index (Blue Line) - Smart money/hedgers positioning
NonCommercial Index (Orange Line) - Large speculators/funds positioning
Nonreportable Index (Red Line) - Small traders positioning
📈 Key Features
Smart Scaling Algorithm
0-100 Range: Normal market conditions based on recent price action
120 Level: Extreme bullish positioning (above historical maximum)
-20 Level: Extreme bearish positioning (below historical minimum)
Dual Time Frame Analysis
Short Period (26 weeks default): For current market scaling
Historical Period (156 weeks default): For extreme condition detection
Flexible Data Sources
Futures Only reports
Futures and Options combined reports
Automatic symbol detection with manual overrides for HG and LBR
🔧 Customizable Settings
Data Configuration
Adjustable lookback periods for both current and historical analysis
Report type selection (Futures vs Futures & Options)
Display Options
Toggle individual trader categories on/off
Customizable reference lines (overbought/oversold levels)
Optional 0/100 boundary lines
Adjustable line widths and colors
Reference Levels
Upper Bound: 120 (extreme bullish)
Overbought: 80 (default)
Midline: 50 (neutral)
Oversold: 20 (default)
Lower Bound: -20 (extreme bearish)
💡 Trading Applications
Contrarian Signals
High Commercial Index + Low NonCommercial Index = Potential bullish reversal
Low Commercial Index + High NonCommercial Index = Potential bearish reversal
Market Sentiment Analysis
Track institutional vs retail positioning divergences
Identify extreme market conditions requiring attention
Monitor smart money accumulation/distribution patterns
Confirmation Tool
Use alongside technical analysis for trade confirmation
Validate breakouts with positioning data
Assess market structure changes
📊 Visual Elements
Status Table: Displays current settings and symbol information
Color-Coded Lines: Easy identification of each trader category
Reference Levels: Clear overbought/oversold boundaries
Extreme Indicators: Visual cues for unusual market conditions
⚠️ Important Notes
COT data is released weekly on Fridays (Tuesday data)
Best suited for weekly and daily timeframes
Requires symbols with available CFTC data
Works automatically for most futures contracts
🎯 Best Practices
Use in conjunction with price action analysis
Look for divergences between price and positioning
Pay special attention to extreme readings (120/-20 levels)
Consider all three indices together for complete market picture
Allow for data lag (3-day delay from CFTC)
This indicator is ideal for swing traders, position traders, and anyone interested in understanding the positioning dynamics of professional vs retail market participants.

Dual FUT/Spot price with next monthly expiryThis Pine Script dashboard indicator is specifically designed for pair trading strategies in Indian futures markets (NSE). Let me break down how it facilitates pair trading:
Core Pair Trading Concept
The script monitors two correlated stocks simultaneously (Symbol A and Symbol B), comparing their:
Spot prices vs Futures prices
Current month futures vs Next month futures
Premium/discount relationships
Key Pair Trading Features
1. Dual Symbol Monitoring
symbolA = "NSE:TCS" (Default)
symbolB = "NSE:INFY" (Default)
Allows traders to watch two stocks in the same sector (like TCS and Infosys in IT) to identify relative value opportunities.
2. Basis Analysis for Each Stock
The indicator calculates the basis (difference between futures and spot):
Price Difference: FUT - SPOT
Premium/Discount %: ((FUT - SPOT) / SPOT) × 100
This helps identify when one stock's futures are relatively more expensive than the other's.
3. Multi-Expiry View
Near Month Futures (1!): Current active contract
Next Month Futures (2!): Upcoming contract
This enables calendar spread analysis within each stock and helps anticipate rollover effects.
4. Comparative Table
The detailed table displays side-by-side:
Symbol Spot Price Near Future Near Diff (%)Next Monthly Next Diff (%)Lot SizeTCS₹3,500₹3,520+20 (+0.57%)₹3,535+35 (+1.00%)125INFY₹1,450₹1,455+5 (+0.34%)₹1,460+10 (+0.69%)600
5. Lot Size Integration
Critical for position sizing in pair trades - the indicator fetches actual contract lot sizes, enabling proper hedge ratio calculations.
Pair Trading Strategies Enabled
Strategy 1: Basis Divergence Trading
When TCS futures trade at +0.8% premium and INFY at +0.2%
Trade: Short TCS futures, Long INFY futures (betting on convergence)
The indicator highlights these differences with color-coded cells
Strategy 2: Calendar Spread Arbitrage
Compare near month vs next month premium for each stock
If TCS shows wider calendar spread than INFY, potential arbitrage exists
Trade the relative calendar spread difference
Strategy 3: Premium/Discount Reversal
Monitor which stock moves from premium to discount (or vice versa)
Color indicators (green/red) make this immediately visible
Enter pairs when relative premium relationships normalize
Strategy 4: Lot-Adjusted Pair Trading
Use lot size data to create market-neutral positions
Example: If TCS lot = 125 and INFY lot = 600
Ratio = 600/125 = 4.8:1 for rupee-neutral positioning
Visual Trading Cues
Green cells: Futures at premium (contango)
Red cells: Futures at discount (backwardation)
Purple values: Next month contracts
Yellow highlights: Spot prices
Practical Pair Trading Example
Scenario: Both stocks in same sector, historically correlated
Normal state: Both show +0.5% premium
Divergence: TCS jumps to +1.2%, INFY stays at +0.5%
Trade Signal:
Short TCS futures (expensive)
Long INFY futures (relatively cheap)
Exit: When premiums converge back to similar levels
Hedge ratio: Use lot sizes to maintain proper exposure balance
Advantages for Pair Traders
✓ Single-screen monitoring of both legs
✓ Real-time basis calculations eliminate manual math
✓ Multi-timeframe view (near + next month)
✓ Automatic lot size fetching for position sizing
✓ Visual alerts through color coding
✓ Percentage normalization for easy comparison
This indicator essentially transforms raw price data into actionable pair trading intelligence by highlighting relative value discrepancies between correlated assets in the futures market.
Enjoy!!

GTI BGTI: RSI Suite (Standard • Stochastic • Smoothed)
A three-layer momentum and trend toolkit that combines Standard RSI, Stochastic RSI, and a Smoothed/“Macro” RSI to help you read intraday swings, trend transitions, and high-probability reversal/continuation spots.
All in one pane with intuitive coloring and optional divergence markers and alerts.
Why this works
* Stochastic RSI (K/D) visualizes fast momentum swings and timing.
* Standard RSI moves more gradually, helping confirm trend transitions that may span several Stochastic cycles.
* Smoothed RSI (Average → Macro) adds a second-pass filter and slope persistence to reveal the macro direction while suppressing noise.
Used together, Stochastic guides entries/exits around local highs/lows, while the RSI layers improve confidence when a small swing is likely part of a larger turn.
What you’ll see
* Standard RSI (yellow; pink above Bull line, aqua below Bear line).
* Stochastic RSI (K/D) with contextual colors:
* Greens when RSI is weak/oversold (bearish conditions → watch for bullish reversals/continuations).
* Reds when RSI is strong/overbought (bullish conditions → watch for bearish reversals/continuations).
* Smoothed (Macro) RSI with trend color:
* Red when macro is ascending (bullish),
* Aqua when macro is descending (bearish).
* Divergences (optional markers):
* Bearish: RSI Lower High + Price Higher High (red ⬇).
* Bullish: RSI Higher Low + Price Lower Low (green ⬆).
* No repaint: pivots confirm after the chosen right-bars window.
How to use it
* Bullish Reversal
* Macro RSI is reversing at a higher low after price has been in a overall downtrend
* Stochastic RSI is switching from green to red in an overall downtrend
* Bullish Oversold
* Macro RSI is reversing from a significantly low level after price has a short but strong dip during an overall uptrend
* Stochastic RSI is switching from green to red in an overall uptrend
* Bullish Continuation
* Macro RSI is ascending with a strong slope or forming a higher low above the 50 line
* Stochastic RSI is reaching a bottom but still painted red
* Bearish Reversal
* Macro RSI is reversing at a lower high after price has been in a overall uptrend
* Stochastic RSI is switching from red to green in an overall uptrend
* Bearish Overbought
* Macro RSI is reversing from a significantly high level after price has a short but strong jump during an overall downtrend
* Stochastic RSI is switching from red to green in an overall downtrend
* Bearish Continuation
* Macro RSI is descending with a strong slope or forming a lower high below the 50 line
* Stochastic RSI is reaching a top but still painted green
* Divergences: Use as signals of exhaustion—best when aligned with Macro RSI color/slope and key levels (e.g., Bull/Bear lines, 50 midline).
*** IMPORTANT ***
* Stack confluence, don’t single-signal trade. Look for:
* 1) Macro RSI color & slope (red = ascending/bullish, aqua = descending/bearish)
* 2) Standard RSI location (above/below Bull/Bear lines or 50)
* 3) Stoch flip + direction
* 4) Price structure (HH/HL vs LH/LL)
* 5) Divergence type (regular vs hidden) at meaningful levels
* Trade with the macro
* Prioritize longs when Macro RSI is red or just flipped up
* Prioritize shorts when Macro RSI is aqua or just flipped down
* Counter-trend setups = smaller size and faster management.
* Location > signal
* The same crossover/divergence is higher quality near Bull (~60)/Bear(~40) or extremes than in the mid-range chop around 50.
* Early vs confirmed
* Use the early pivot heads-up for anticipation, but scale in only after the confirmed pivot (right-bars complete). If early signal fails to confirm, stand down.
* Define invalidation upfront
* For divergence entries, place stops beyond the pivot extreme (LL/HH). If Macro RSI flips against your trade or RSI breaks back through 50 with slope, exit or tighten.
* Multi-timeframe alignment
* Best results come when entry timeframe (e.g., 1H) aligns with higher-TF macro (e.g., 4H/D). If they disagree, treat it as mean-reversion only.
* Avoid common traps
* Skip: isolated Stochastic flips without RSI support, divergences without price HH/LL confirmation, and serial divergences when Macro RSI slope is strong against the idea.
* Parameter guidance
* Start with defaults; then tune: confirmBars 3–7, minSlope 0.05–0.15 RSI pts/bar, pivot left/right tighter for faster but noisier signals, wider for cleaner but fewer.
* Alerts = workflow, not auto-trades
* Use Macro Flip + Divergence alerts as a checklist trigger; enter only when your confluence rules are met and risk is defined.
Key inputs (tweak to your market/timeframe)
* RSI / Stochastic lengths and K/D smoothing.
* Bull / Bear Lines (default 61.1 / 43.6).
* Average RSI Method/Length (SMA/EMA/RMA/WMA) + Macro Smooth Length.
* Trend confirmation: bars of persistence and minimum slope to reduce flip noise.
* Pivot look-back (left/right) for divergence confirmation strictness.
Alerts included
* Macro Flip Up / Down (Smoothed RSI regime change).
* RSI Bullish/Bearish Divergence (confirmed at pivot).
* Stochastic RSI continuation/divergence (optional).
Tips
* Level + Slope matter. High/low RSI level flags conditions; slope confirms impulse/continuation.
* Let Stochastic time the swing; let Macro RSI filter the trend.
* Tighten or loosen pivot windows to trade fewer/cleaner vs. more/faster signals.

Multi-Mode Seasonality Map [BackQuant]Multi-Mode Seasonality Map
A fast, visual way to expose repeatable calendar patterns in returns, volatility, volume, and range across multiple granularities (Day of Week, Day of Month, Hour of Day, Week of Month). Built for idea generation, regime context, and execution timing.
What is “seasonality” in markets?
Seasonality refers to statistically repeatable patterns tied to the calendar or clock, rather than to price levels. Examples include specific weekdays tending to be stronger, certain hours showing higher realized volatility, or month-end flow boosting volumes. This tool measures those effects directly on your charted symbol.
Why seasonality matters
It’s orthogonal alpha: timing edges independent of price structure that can complement trend, mean reversion, or flow-based setups.
It frames expectations: when a session typically runs hot or cold, you size and pace risk accordingly.
It improves execution: entering during historically favorable windows, avoiding historically noisy windows.
It clarifies context: separating normal “calendar noise” from true anomaly helps avoid overreacting to routine moves.
How traders use seasonality in practice
Timing entries/exits : If Tuesday morning is historically weak for this asset, a mean-reversion buyer may wait for that drift to complete before entering.
Sizing & stops : If 13:00–15:00 shows elevated volatility, widen stops or reduce size to maintain constant risk.
Session playbooks : Build repeatable routines around the hours/days that consistently drive PnL.
Portfolio rotation : Compare seasonal edges across assets to schedule focus and deploy attention where the calendar favors you.
Why Day-of-Week (DOW) can be especially helpful
Flows cluster by weekday (ETF creations/redemptions, options hedging cadence, futures roll patterns, macro data releases), so DOW often encodes a stable micro-structure signal.
Desk behavior and liquidity provision differ by weekday, impacting realized range and slippage.
DOW is simple to operationalize: easy rules like “fade Monday afternoon chop” or “press Thursday trend extension” can be tested and enforced.
What this indicator does
Multi-mode heatmaps : Switch between Day of Week, Day of Month, Hour of Day, Week of Month .
Metric selection : Analyze Returns , Volatility ((high-low)/open), Volume (vs 20-bar average), or Range (vs 20-bar average).
Confidence intervals : Per cell, compute mean, standard deviation, and a z-based CI at your chosen confidence level.
Sample guards : Enforce a minimum sample size so thin data doesn’t mislead.
Readable map : Color palettes, value labels, sample size, and an optional legend for fast interpretation.
Scoreboard : Optional table highlights best/worst DOW and today’s seasonality with CI and a simple “edge” tag.
How it’s calculated (under the hood)
Per bar, compute the chosen metric (return, vol, volume %, or range %) over your lookback window.
Bucket that metric into the active calendar bin (e.g., Tuesday, the 15th, 10:00 hour, or Week-2 of month).
For each bin, accumulate sum , sum of squares , and count , then at render compute mean , std dev , and confidence interval .
Color scale normalizes to the observed min/max of eligible bins (those meeting the minimum sample size).
How to read the heatmap
Color : Greener/warmer typically implies higher mean value for the chosen metric; cooler implies lower.
Value label : The center number is the bin’s mean (e.g., average % return for Tuesdays).
Confidence bracket : Optional “ ” shows the CI for the mean, helping you gauge stability.
n = sample size : More samples = more reliability. Treat small-n bins with skepticism.
Suggested workflows
Pick the lens : Start with Analysis Type = Returns , Heatmap View = Day of Week , lookback ≈ 252 trading days . Note the best/worst weekdays and their CI width.
Sanity-check volatility : Switch to Volatility to see which bins carry the most realized range. Use that to plan stop width and trade pacing.
Check liquidity proxy : Flip to Volume , identify thin vs thick windows. Execute risk in thicker windows to reduce slippage.
Drill to intraday : Use Hour of Day to reveal opening bursts, lunchtime lulls, and closing ramps. Combine with your main strategy to schedule entries.
Calendar nuance : Inspect Week of Month and Day of Month for end-of-month, options-cycle, or data-release effects.
Codify rules : Translate stable edges into rules like “no fresh risk during bottom-quartile hours” or “scale entries during top-quartile hours.”
Parameter guidance
Analysis Period (Days) : 252 for a one-year view. Shorten (100–150) to emphasize the current regime; lengthen (500+) for long-memory effects.
Heatmap View : Start with DOW for robustness, then refine with Hour-of-Day for your execution window.
Confidence Level : 95% is standard; use 90% if you want wider coverage with fewer false “insufficient data” bins.
Min Sample Size : 10–20 helps filter noise. For Hour-of-Day on higher timeframes, consider lowering if your dataset is small.
Color Scheme : Choose a palette with good mid-tone contrast (e.g., Red-Green or Viridis) for quick thresholding.
Interpreting common patterns
Return-positive but low-vol bins : Favorable drift windows for passive adds or tight-stop trend continuation.
Return-flat but high-vol bins : Opportunity for mean reversion or breakout scalping, but manage risk accordingly.
High-volume bins : Better expected execution quality; schedule size here if slippage matters.
Wide CI : Edge is unstable or sample is thin; treat as exploratory until more data accumulates.
Best practices
Revalidate after regime shifts (new macro cycle, liquidity regime change, major exchange microstructure updates).
Use multiple lenses: DOW to find the day, then Hour-of-Day to refine the entry window.
Combine with your core setup signals; treat seasonality as a filter or weight, not a standalone trigger.
Test across assets/timeframes—edges are instrument-specific and may not transfer 1:1.
Limitations & notes
History-dependent: short histories or sparse intraday data reduce reliability.
Not causal: a hot Tuesday doesn’t guarantee future Tuesday strength; treat as probabilistic bias.
Aggregation bias: changing session hours or symbol migrations can distort older samples.
CI is z-approximate: good for fast triage, not a substitute for full hypothesis testing.
Quick setup
Use Returns + Day of Week + 252d to get a clean yearly map of weekday edge.
Flip to Hour of Day on intraday charts to schedule precise entries/exits.
Keep Show Values and Confidence Intervals on while you calibrate; hide later for a clean visual.
The Multi-Mode Seasonality Map helps you convert the calendar from an afterthought into a quantitative edge, surfacing when an asset tends to move, expand, or stay quiet—so you can plan, size, and execute with intent.

Fixed High Timeframe Moving AveragesFixed High Timeframe Moving Averages (W/D/4H)
Summary
This indicator plots essential, high-timeframe (HTF) Moving Averages onto your chart, **no matter which timeframe you are currently viewing**.
It is designed for traders who need multi-timeframe context at a glance. Stop switching charts to see where the 200-Week or 50-Day MA is—now you can see all critical HTF levels directly on your 5-minute (or any other) chart.
---
Who it’s for
Traders who rely on moving averages but like to work on lower chart timeframes while keeping higher timeframe context in sight. If you scalp on 1–15m yet want Weekly/Daily/4H MAs always visible, this is for you.
---
What it shows
Pinned (“fixed”) moving averages from higher timeframes—Weekly (20/100/200) , Daily (50/100/200/365) and 4H (200) —rendered on any chart timeframe. Your favorite HTF MAs stay on screen no matter what TF you’re currently analyzing.
---
Features
* **MA types:** SMA, EMA, VWMA, Hull.
* **Fully configurable:** toggle each line, set periods, colors, and thickness.
* **Two alert modes (see below):** intrabar vs confirmed HTF close.
* **Works on any symbol & chart TF** using `request.security` to fetch HTF data.
---
Alerts & Modes
This indicator solves the biggest problem with MTF alerts: false signals. You can choose one of two modes:
1. **Intrabar mode** — compares current chart price to the HTF MA. Triggers as soon as price crosses the HTF line; great for early signals but may update until the HTF bar closes.
2. **Confirmed mode** — checks HTF close vs HTF MA. Signals only on the higher-TF bar close; fewer false starts, no intrabar repainting on that TF.
Per-line *Cross Above / Cross Below* conditions are provided for all enabled MAs (e.g., “20W — Cross Above”, “365D — Cross Below”, etc.).
**How to use alerts:** add the script → “Create Alert” → pick any condition from the script’s list.
---
Why this helps
* Keeps Weekly/Daily structure visible while you execute on LTF.
* Classic anchors (e.g., 200D, 20W/100W/200W) are popular for trend bias, dynamic support/resistance, and pullback context.
* Lets you standardize MA references across all your lower-TF playbooks.
---
Notes on confirmation & repainting
* Intrabar signals can change until the higher-TF bar closes (that’s expected with multi-TF data).
* Confirmed mode waits for the HTF close—cleaner, but later. Choose what fits your workflow.
---
Quick setup
1. Pick `MA Type` (SMA/EMA/VWMA/Hull).
2. Enable the HTF lines you want (Weekly 20/100/200; Daily 50/100/200/365; 4H 200).
3. Choose `Alert Mode` (Intrabar vs Confirmed).
4. Style colors/widths to taste and set alerts on the lines you care about.
---
Good practice
* Combine HTF MAs with price action (swings, structure, liquidity grabs) rather than using them in isolation.
* Always validate signals in your execution TF and use a risk plan tailored to volatility.
* Protect your capital: position sizing, stops, and disciplined risk management matter more than any single line on the chart.
---
Disclaimer
For educational/informational purposes only; not financial advice. Trading involves risk—manage it responsibly.

Scissors&Knifes V3.1✂️ The Scissors (PAG Chop V4 Engine)
🧠 Core idea
Scissors measure market compression and breakout readiness.
They use a modified Choppiness Index that looks at the relationship between:
True Range volatility (ATR × period length)
The total high–low range over the same window.
The smaller the ratio (sum of TR vs range), the more directional and impulsive the market is.
The higher the ratio, the more “sideways” the market trades.
This version smooths the result over PAG_SMOOTHLEN bars and applies several color bands that correspond to volatility states.
🎨 Color code meaning
Range State Color Interpretation
≤ 30 Strong Red #8B0000 Momentum exhaustion on downside, sellers dominating — about to reverse or already strong down-trend.
30 – 38 Brick Red #A52A2A Fading downside pressure; often the “bleeding edge” of a bearish climax.
38 – 55 Transparent black (α≈100) Neutral chop zone — indecision, range-building.
55 – 61.8 Yellow (optional) #DAA520 Early compression pocket where volatility starts contracting; the calm before a trend.
61.8 – 70 Bright Green #556B2F Energy release phase: volatility breaking out upward.
≥ 70 Strong Green #355E3B Sustained bullish drive, often continuation leg of a trend.
🪶 Secret nuance:
The transition bands (38–45 and 45–55) are treated as fully transparent to mark “dead zones.”
When PAG Chop sits here, all label activity pauses — the system resets its cluster memory so the next colored print begins a new “cluster”, letting you clearly see where fresh directional momentum starts.
🧩 Cluster logic
Every time a colored (non-transparent) reading appears, it belongs to a “color cluster.”
Grey labels (= count 1) mark the genesis of a new cluster, and following counts 2, 3, 4 … represent the internal continuity of that trend state.
You can optionally hide the first N grey or count 2 labels to reduce clutter on the initial stabilization bars.
✂️ Label meaning
Each label shows:
Emoji ✂️
Current count (e.g. ✂️ = 3 means 3 timeframes are simultaneously firing)
Optional list of the timeframes that contribute.
So a high count (e.g. 8–10) means many lower TFs are synchronizing volatility breakout — a multiframe alignment, often just before an acceleration burst.
🔪 The Knife (Mr Blonde V4 Engine)
🧠 Core idea
Mr Blonde converts the slope of a long EMA into an angle-of-attack metric — literally the “tilt” of market momentum.
It computes the EMA gradient relative to price span and rescales it into degrees (-5 ° to +5 °).
The steeper the angle, the stronger the directional push.
🎨 Color code meaning
Angle range Color Interpretation
≥ +5 ° Transparent (Black 1) Fully over-extended up move — wait for reset.
+3.57 – +5 ° Dark Red Strong upward slope, momentum apex.
+2.14 – +3.57 ° Orange Medium upward slope, trend acceleration zone.
+0.71 – +2.14 ° Light Orange Mild upward bias, pre-momentum phase.
0 to -0.71 ° Yellow Neutral transition.
-0.71 – -2.14 ° Olive Green Soft bearish slope.
-2.14 – -3.57 ° Olive Drab Building bearish momentum.
-3.57 – -5 ° Hunter Green Strong downward angle, aggressive push.
≤ -5 ° Transparent (Black 2) Oversold/over-tilted — likely exhaustion.
🪶 Secret nuance:
Mr Blonde uses a “span normalization” factor that divides EMA slope by the dynamic range of highs and lows.
This lets it compare angles fairly across assets with different volatility profiles (e.g. BTC vs ES) — it’s one of the rare EMA-angle implementations that self-scales properly.
🗡 Label meaning
Emoji 🔪
Count = how many TFs share the same momentum angle bias.
When many TFs show the same slope polarity (e.g. knife = 8), you’re in a deep momentum cascade — a “knife trend.”
💫 Yellow knife
The yellow state marks neutrality or slope flattening.
If you enable yellow visibility (mb_show_yellow), you can see where momentum cools off — often the earliest reversal hint.
⚙️ Shared mechanics between ✂️ and 🔪
Multi-timeframe sweep
The script cycles through 1 m → 10 m by default, running both engines once per TF.
Each returning true adds +1 to the count.
So:
sc_hits = count of timeframes where PAG fires + 1
knife_hits = count of timeframes where MB fires + 1
That “+1 shift” means there’s always at least 1, letting count = 1 represent the local TF itself.
Cluster limiter
If Limit max labels per cluster is on, you cap how many total symbols (both ✂️ & 🔪, including trails) can appear within one color phase — avoiding chart spam during extended trends.
Trails
Each printed label seeds a short-lived “trail” sequence — faded copies extending N bars forward.
Trails visualize the linger effect of the last signal, useful for visually connecting bursts in momentum.
Grey or count = 1 labels can have shorter or longer trails depending on your overrides (*_trail_bars_grey).
They’re purely visual and do not affect alerting.
Alerts
Alerts fire independently of whether you hide labels — unless you enable “respect filters”.
This guarantees you never miss a structural signal even if you suppress visuals for clarity.
🌈 Interpreting Both Together
Scenario Interpretation
✂️ = low (1–2) + 🔪 rising (red/orange) Market just leaving chop, early thrust stage.
✂️ = high (≥ 5) + 🔪 green Fully aligned breakout continuation — trend in progress.
✂️ = yellow cluster + 🔪 yellow Volatility squeeze, energy buildup — next expansion near.
✂️ = green cluster → 🔪 turns red Cross-state conflict; likely transition or correction.
✂️ = grey + 🔪 grey Reset condition — both engines cooling; stand aside.
💡 Hidden edge:
Scissors signal potential, Knife measures kinetic force.
The perfect storm is when ✂️ goes from yellow→green one bar before 🔪 shifts from orange→green — it catches the birth of directional flow while volatility is still tight.
🧭 Reading the labels intuitively
Grey ✂️/🔪 = 1 → embryonic state, may fizzle or bloom.
✂️/🔪 = 2 or 3 → expansion taking hold.
✂️/🔪 ≥ 4 (mid black) → strong synchronized drive across TFs.
Transparent gap → cluster reset; prepare for new phase.
Trail lines → echo of previous cluster strength.
Final secret tip 🗝
Because both engines are mathematically uncorrelated (volatility vs EMA angle), when they agree in color polarity on multiple TFs, you have one of the cleanest probabilistic trend windows possible.
If you ever see ✂️ = 6 + 🔪 = 6 both pointing the same way — that’s a “knife-through-the-scissors” moment: volatility expansion and directional slope synchronized — those are the bars where institutional algorithms tend to add size.
