First 12 Candles High/Low BreakoutThis indicator identifies potential breakout opportunities based on the high and low points formed within the first 12 candles after the market opens on a 5-minute timeframe. It provides visual cues and labels to help traders make informed decisions.
Features:
Market Open High/Low: Marks the highest and lowest price of the first 12 candles following the market open with horizontal lines for reference.
Breakout Signals: Identifies potential buy or sell signals based on the first 5-minute candle closing above the open high or below the open low.
Target and Stop-Loss: Plots horizontal lines for target prices (100 points by default, adjustable) and stop-loss levels (100 points by default, adjustable) based on the entry price.
Visual Cues: Uses green triangles (up) for buy signals and red triangles (down) for sell signals.
Informative Labels: Displays labels with "Buy" or "Sell" text, target price, and stop-loss price next to the entry signals (optional).
Customization:
You can adjust the target and stop-loss point values using the provided inputs.
How to Use:
Add the script to your TradingView chart.
The indicator will automatically plot the open high, open low, potential entry signals, target levels, and stop-loss levels based on the first 12 candles after the market opens.
Use the signals and price levels in conjunction with your own trading strategy to make informed decisions.
Поиск скриптов по запросу "12月4号是什么星座"

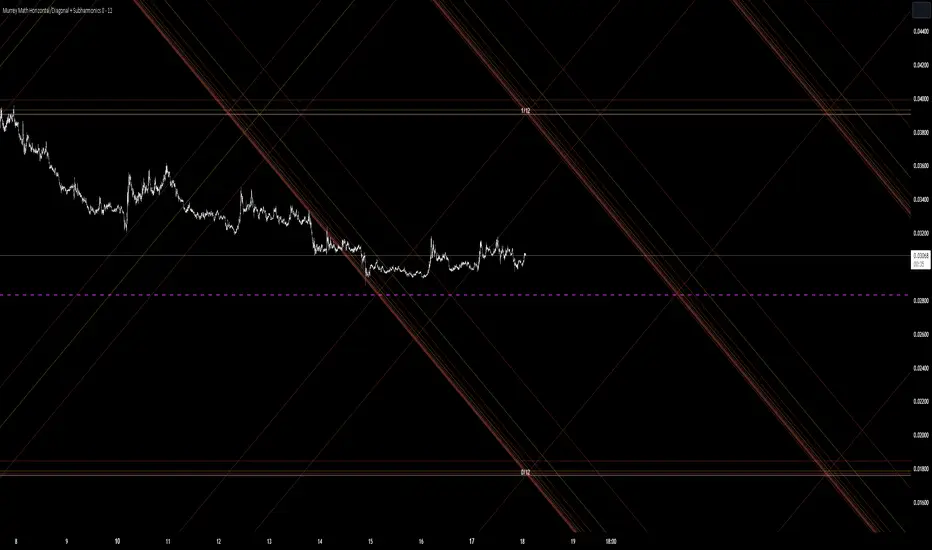
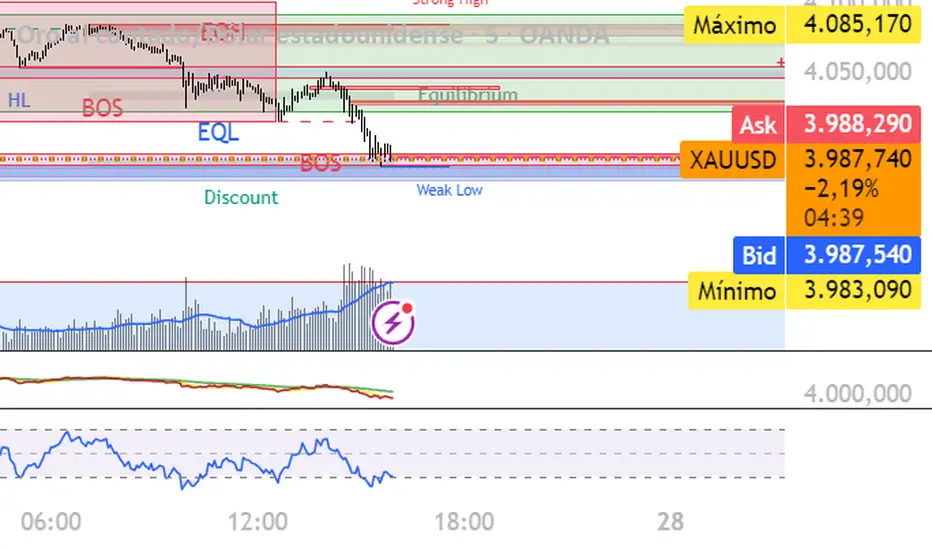
Murrey Math Horizontal/Diagonal + Subharmonics 0 - 12 [All-Time]The Murrey Math lines are created by dividing the range between the high and low of the monthly timeframe prices into equal parts based on the division factor from 2 to 12.
No matter which timeframe you will use, because the calculations based on the most high and low price values.
Better to use > monthly timeframe for faster calculations.
These lines serve as potential support and resistance levels.
The midlines are dashed lines representing the midpoint between two consecutive Murrey Math lines.
The diagonal lines can be enabled to show two different types or both types. These lines connect the highs or lows of the price bars in a diagonal manner.
The subharmonic lines represent smaller divisions within each Murrey Math range. They can be customized to show only strong subharmonics or all subharmonics. Subharmonics are calculated based on the division factor and can provide additional support and resistance levels within the Murrey Math framework.
This script helps visualize the Murrey Math levels and their associated lines on a trading chart, aiding traders in identifying potential price levels for decision-making.
The most strong levels which I tested were: 2, 4, 6, 8, 12.
I was inspired by Gann's work and i tried to implement this indicator.
It's the most accurate version of Murrey Math calculations, you can set the value of 8 which Gann was used but I did up to 12 because of my experiments and I would recommend you to use the value of 12.
This indicator can be used for all types of markets.
Also note, that the strong levels described above is tested on division by 12 setting.
Anyway, you can use the divison of 8 and use the standart strong s/r levels.
(for more information search for Gann 2.0 support resistance on the internet).
Also note: this information is not a financial advice, just my opinion to the indicator I implemented. Please use this indicator wisely and focus to save your money, not earn.
I wish you profitable trades, stick to your risk/money management and the key entry points!
7EMA_5MA (G/D + Bias + 12/26 Signal)This script alow you to survey multiple crossing signals as Golden/Death cross (MA50/200), Institutional Bias (EMA9/18), or EMA 12/26 crossing. You can show/hide all EMAs/MAs and show/hide all signals. Default config displays EMA 50/100/200 and MA 20. Full script includes display of EMA 9/18/12/26/50/100/200 and MA 20/21/50/100/200.

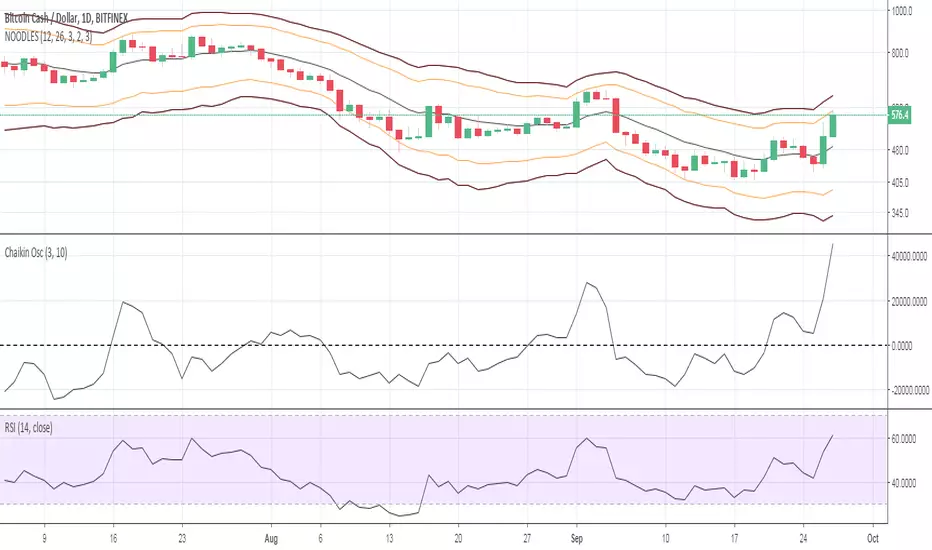
Noodles ema bands 12/26ema bands 12/26 for crypto trading, to find perfect support and resistance on each timeframe. 12/26 exponential moving average as you know is a perfect tool who working very well on bitcoin and others crypto. With this indicator now you have s/r too.
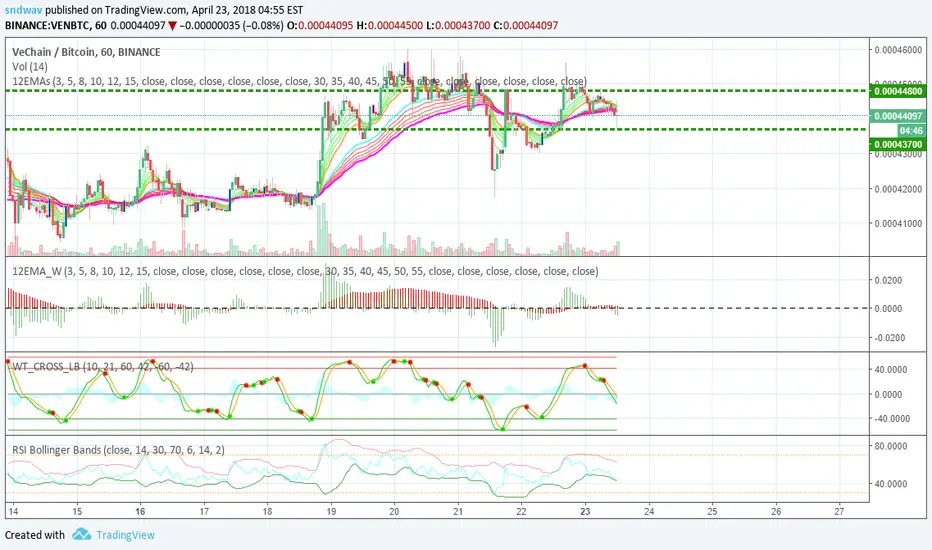
Frosted 12 EMA WIDTHThis is a complementary indicator for the 12 EMAs indicator ()
This width indicator shows the fanning width of each fan (shorter MAs and longer MAs).
To make things easier to see:
You can turn off one of the histograms to view just one of the widths (and add a 2nd instance of this indicator, turning off the other width).
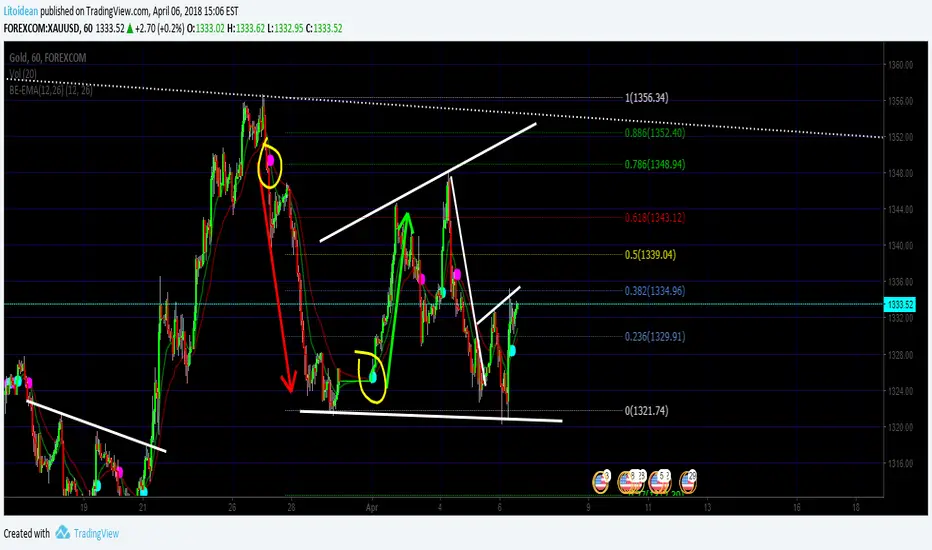
BE-EMA(12,26) (Blue Empire Exponential Moving Average)
Simple EMA where you get a CROSS mark between EMA 12 and EMA 26.
Each time a cross happens, a spot gets created.
If it's cyan, it goes up.
If it's magenta, it goes down.
I'm studying Trading at Blue Empire Academy, if you want to know more send me a PM.
Wave Analysis study the wave's behavior and tries to predict by using trendlines, elliot waves, fibonacci retracements, and EMAs basically.
In this Indicator, It's a confirmation when EMA 12 goes over to confirm the price may go up. and Vice versa.
Hope you like, please share if you think it's useful and comment if you think this can be better.
Thank you again for reading
>> This is just an indicator, it doesn't predict the future. Use it at your own risk. <<
##########
All the credits to @tracks, a genius who helped me polish the code. :] thank you.


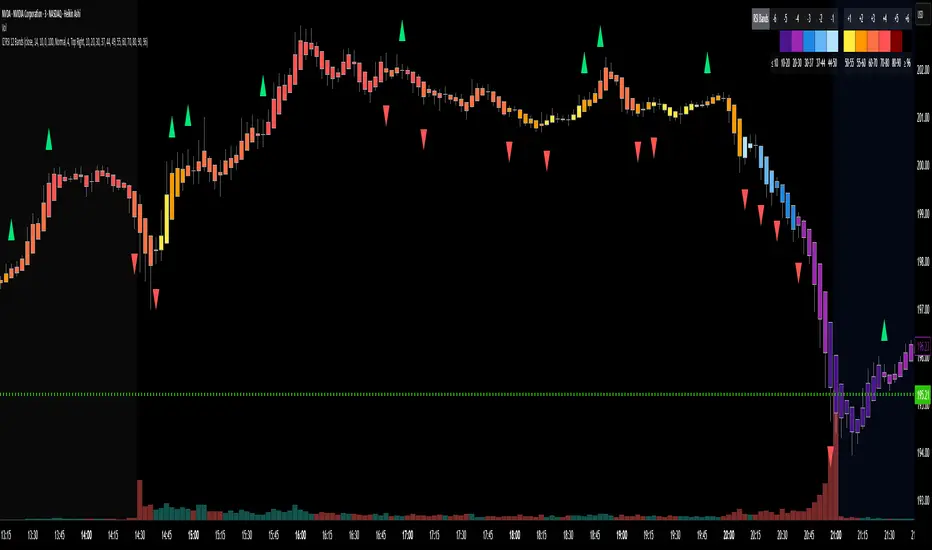
RSI Candle 12-Band SpectrumExperience RSI like never before. This multi-band visualizer transforms relative strength into a living color map — directly over price action — revealing momentum shifts long before traditional RSI signals.
🔹 12 Dynamic RSI Bands – A full emotional spectrum from oversold to overbought, colored from deep blue to burning red.
🔹 Adaptive Pulse System – Highlights every shift in RSI state with an intelligent fade-out pulse that measures the strength of each rotation.
🔹 Precision Legend Display – Clear RSI cutoff zones with user-defined thresholds and color ranges.
🔹 Multi-Timeframe Engine – Optionally view higher-timeframe RSI context while scalping lower frames.
🔹 Stealth Mode – Borders-only visualization for minimal chart impact on dark themes.
🔹 Complete Customization – Adjustable band levels, color palettes, and fade behavior.
🧠 Designed for professional traders who move with rhythm, not randomness.
Cruce TEMA SMMA con Alarma a 12 Barras LLUCes un cruce de TEMA SMMA, luego del cruce contar 12 barras controladas por otros

EMA band 12/60/150/200EMA band consisting of 12/60/150/200
Specifically for Indian stock market, can be used for other trading scripts after testing.
Best use case : on Daily TF.
Bull run entry criteria, Not bear market or Bottom catching.

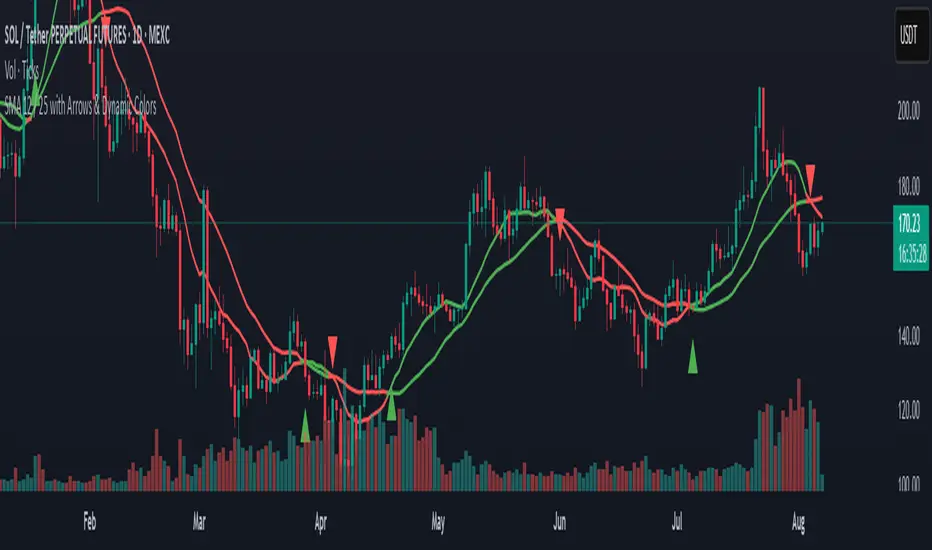
SMA 12 / 25 with Arrows & Dynamic ColorsSMA 12 / 25 with Arrows & Dynamic Colors
Colors are the same after crosses
Up down arrows at crosses
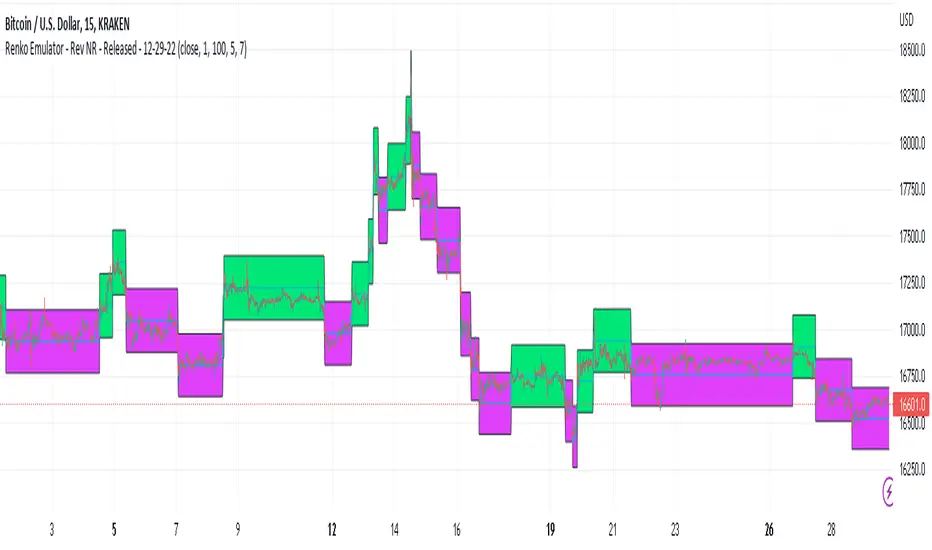
Renko Emulator - Rev NR - Released - 12-29-22Renko Emulator - Rev NR - Released 12-29-22
By Hockeydude84
Simple script to Emulate Renko Charting behavior on standard candle stick charts. Code provide capability to select between standard(ish) Renko bricks (in this code it's defined by percent vs ticks/value), or an ATR brick option. For ATR bricks, the code provides an option to inhibit emulator movement (formation of new bricks) by providing a minimum threshold that must be present. This threshold is the "Standard Brick" input (the input pulls double duty). Code also provides multiple plotting options.
Use the code to help see trends and reduce the chop/erroneous data. Also helps to identify where trend deviations are present.
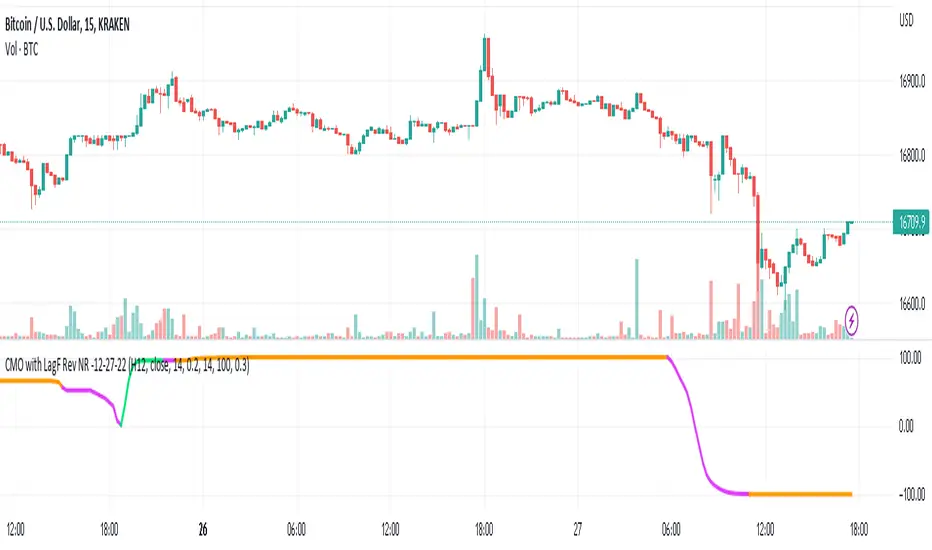
CMO with ATR and LagF Filtering - RevNR - 12-27-22Rev NR of the CMO ATR, with LagF Filtering - Released 12-27-22 by @Hockeydude84
This code takes Chande Momentum Oscillator (CMO), adds a coded ATR option and then filters the result through a Laguerre Filter (LagF) to reduce erroneous signals.
This code also has an option for self adjusting alpha on the Lag, via a lookback table and monitoring the price rate of change (ROC) in the lookback length.
Faster ROC will allow the LagF to move faster, slower price action will slow down LagF reaction. Pausing of signals is also present based on Rate of Change of the LagF Curve
Aggressive signals and Base signaling is allowed - aggressive bases signals on increase/decrease of previous LagF curve value point, Base is greater or less than 0
Original Code credits; Lost some of this due to time and multiple script manipulations, I believe the CMO origin code is from @TradingView House Code, and the LagF from @KıvançÖzbilgiç
BBI MA(6/12/24)This Bear Bull Index ( BBI ) is only consider 3 moving averages i.e. SMA (6), SMA (12) and SMA (24). BBI likely moving average, it tells you the trend, beside it is the support and resistance line against the share price. The share price will ride on the BBI wave and earn big so long the share price is maintained above the BBI line.

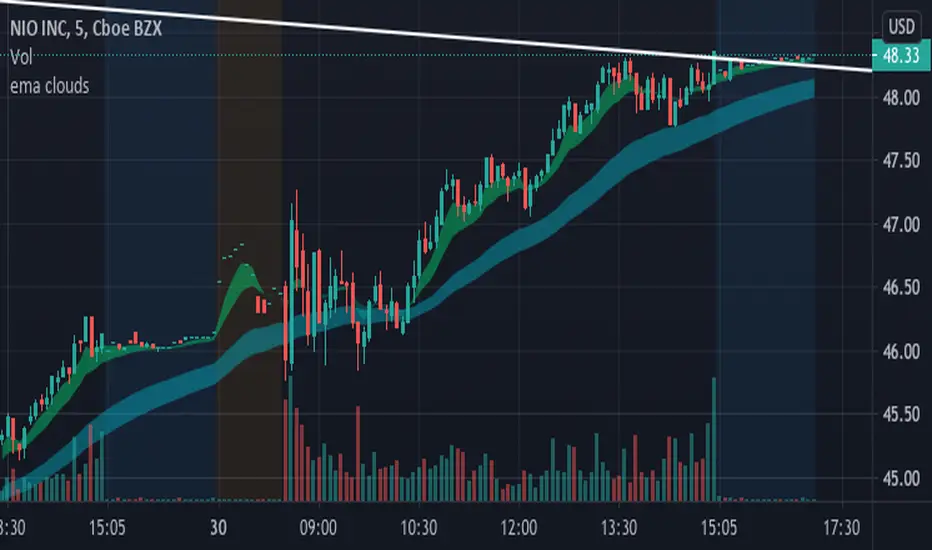
EMA clouds (5/12 and 34/50)This is a custom ema cloud script with a 5/12 cloud and a 34/50 cloud.
Personally, I used to trade with the 20 ema and 50 ema, but wanted something with a little more robust. These clouds are especially great for the first hour of market open since strong bullish stocks that have gapped up overnight tend to follow these trends.
For example, Tesla opened above the clouds and used them as support before running all day.
NIO happened to do a similar move.
MA 12, MA 24, RSI OB-OS, CCI by WP@SITechDeveloped by Worachart Pirunruk, MD - Siam Intelligence Technology
This is the signal that generates based on 4 Technical Analysis Tools:
1. SMA 12,
2. SMA 26,
3. RSI 14,3,3
4. CCI
Signal to Buy/Long when the RSI below Dynamic oversold line based on close price back 60 bars.
Parameter. This signal doesn't have to best TP point, I'm working on improvement, now. Btw, don't forget to calculate you Margin Level. I'll teach you guys later of how to calculate.
Have fun Trading guys, and don't forget to give back to others. Because, Giving is Receiving."
WP@SITech