Custom EMA from X Days AgoThis is an indicator to plot the selected EMA value from X days ago on today's candle.
Or it will helps to plot the previous candle's EMA value on current candle.
Поиск скриптов по запросу "3 ema"
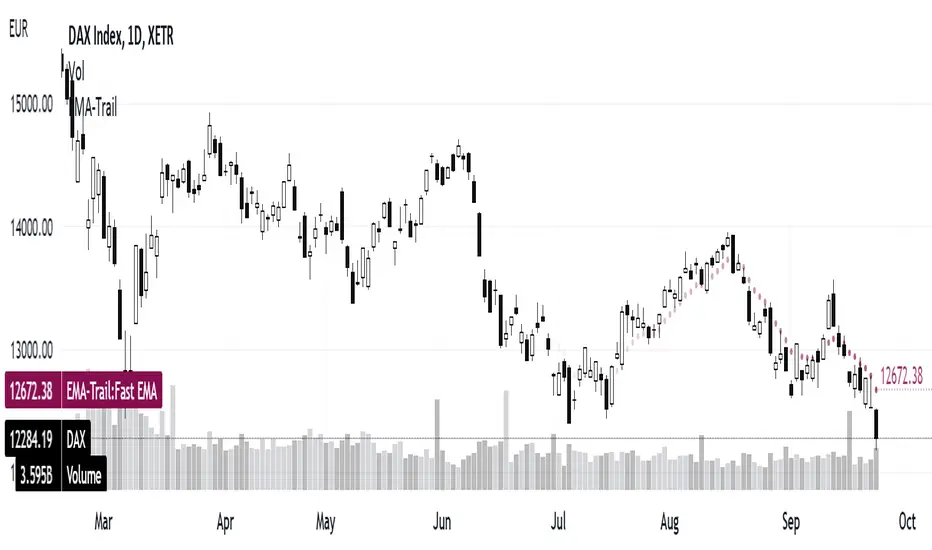
3 EMAs: Daily fixed and custom timeframe (cajole)Simply adds 3 exponential moving averages (EMAs) to the chart. Two are fixed to the daily scale (e.g., 200 and 50 days) and one adjusts to the chart's scale (e.g. 8 bars).
To use the 8-EMA as a trail stop, you can enable labels on the plot or on the price axis.
Trend Surfers - Momentum + ADX + EMAThis script mixes the Lazybear Momentum indicator, ADX indicator, and EMA.
Histogram meaning:
Green = The momentum is growing and the ADX is growing or above your set value
Red = The momentum is growing on the downside and the ADX is growing or above your set value
Orange = The market doesn't have enough momentum or the ADX is not growing or above your value (no trend)
Background meaning:
Blue = The price is above the EMA
Purple = The price is under the EMA
Cross color on 0 line:
Dark = The market might be sideway still
Light = The market is in a bigger move

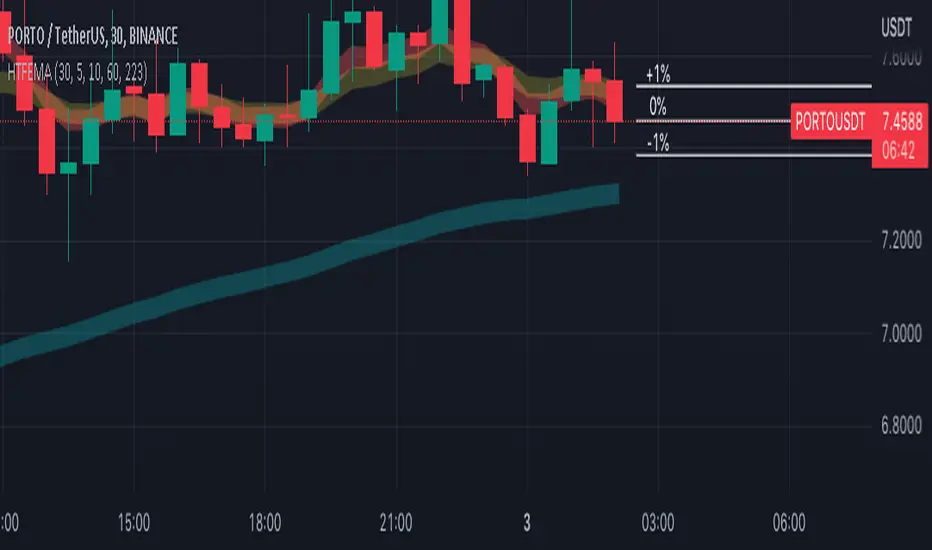
Higher Time Frame EMAs and 1% volatility indicatorSet the "higher time frame" (HTF) from which the EMAs will be calculated in all timeframes.
Example: I chose timeframe 1D and I will see the EMAs from TF 1D also in smaller TF as 1, 5, 30, 60 minutes.
There are 4 EMAs. The default values are 5, 10, 60 and 223 periods from "Scalping the Bull" indicator.
You can change the periods of each EMA.
The indicator have also a volatility indication, showing -1% and +1% price levels.
VWAP With EMAFor those who want the classic Volume Weighted Average Price and Ema on the same overlay.
This script utilizes the same protocols as the VWAP and EMA you currently use. Just frees up an indicator space.
KEEP UP TO DATE
Are you a college student or graduate?
Join College Town Trade discord for helpful community specializing in trading stocks, options, and crypto.
Our staff consists of a group of college students with 10+ years of combined experience. Collectively we have profited and made well above an average yearly salary while being in college. The community aspect is everything and the team always listens and appreciates feedback. We all earn and learn together. There are free trials in place in order for you to see what it’s all about. These are in place so we can gain your trust and show transparency!
I look forward to seeing you in the community
advBtBjDhk

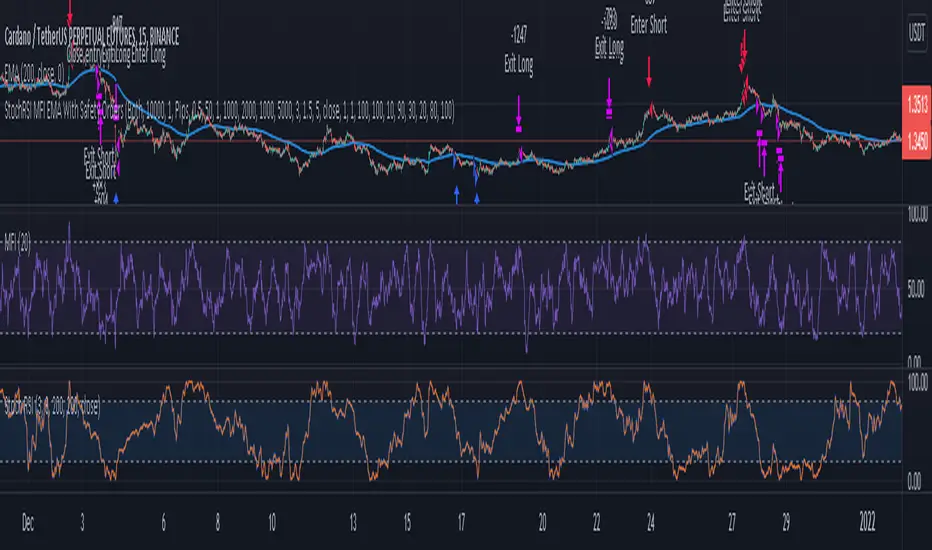
3 Indicator Strategy (StochRSI, MFI & EMA) With Safety OrdersThis strategy uses Stochastic RSI, Money Flow Index and EMA with settings for lower time-frames.
It also features safety orders based on 3 different take profit and stop loss methods.
Recommended Indicator Settings for lower time-frames;
Stoch RSI: 1,1,100,100
MFI: 30
EMA: 100
Take Profit/Stop Loss Settings:
There are 3 TP/SL types available;
- Pips -> based on minticks
- Base Value -> manually entering a value for the actual profit/loss.
- Opposite Signal -> e.g. if the current open order is long, strategy waits for the next short signal.
Signal Table - AutoFib - SMA - EMA - RSI - ATR - VolWith this indicator you can add a table on top of your chart.
What's in this table?
On which graph you open this table, the indicator data at the selected time of that graph are written. In the image below, you can see the table in the upper right.
You can also see two EMAs above the chart in this indicator. You can adjust their length.
You can add automatic fibonacci retracement levels to the top of the chart. In this way, you can see the Fibonacci levels on the chart and determine the support resistance. If the price is above the Fibonacci level, it will appear green on the chart, and red if below. You will understand as you use it.
It turns red if the RSI is below 30 and green if it is above 70.
Likewise, if the price is above the moving averages you have set, it appears as green, and if it is below it, it appears as red.
You can hide and activate the EMA and Fibonacci levels above the chart.
For example, you can get the ETH chart while the BTC chart is open in front of you. I think you will understand everything clearly from the settings tab below. Please support me. I hope you will be satisfied using it.

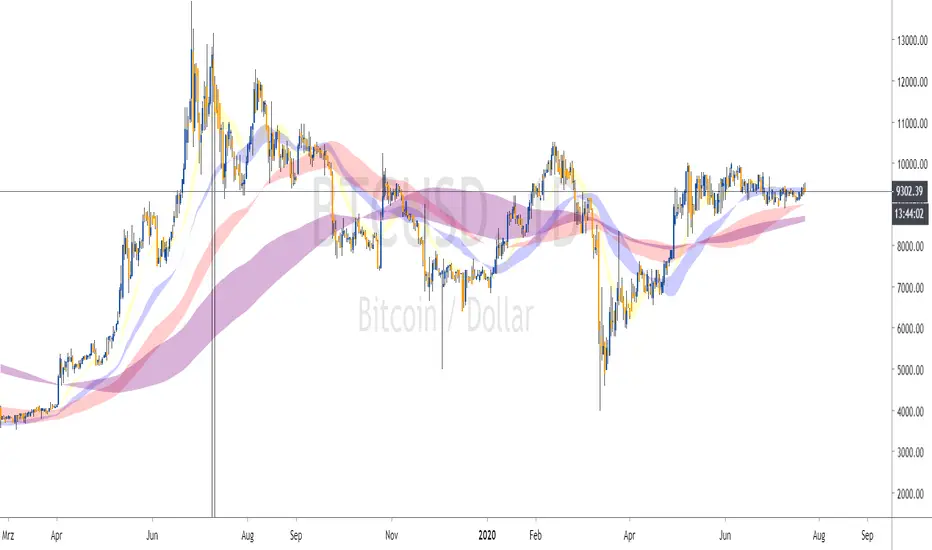
BB+RSI+EMA BUY/SELL SignalsBINANCE:BTCUSDT
* * * TESTED ON BTCUSDT 4H CHART * * *
The indicator gives signals based on candles touching BB lines and RSI oversold/overbought conditions, also a 200 EMA filter is used to trade following the major trend.
Only LONG signals are given.
Signals are divided in 3 categories based on their strenght:
- Weak BUY/SELL (green/red circles on chart)
- normal BUY/SELL (green/red triangles with "BUY" or "SELL" text on chart)
- strong BUY/SELL (green/red labels with "STRONG BUY" or "STRONG SELL" text on chart)
You can use signals from the same category as triggers for entering or exiting a trade or you can try using signals from different categories
All indicators settings can be costumized
Every signal label can be turned ON/OFF
EMA that changes color based on last candle close can be turned ON/OFF
Alerts can be set for:
- General Signals (every signal will trigger it)
- Weak Signals (only weak signals will trigger it)
- Normal Signals (only normal signals will trigger it)
- Strong Signals (only strong signals will trigger it)

Triple EMA (20, 50, 200) w/ LabelsI've combined the 20, 50, and 200 day exponential moving averages and added labels.
I created this due to finding EMA scripts that are either nothing but ugly to look at or have extra "features" that serve no purpose.
This gets rid of the clutter and gives a simple triple EMA with labels.
Labels are optional, you can turn them off in the settings.

Long only EMA CROSS 8/50/200 BacktestImprove EMA CROSS 8/50/200 with adjustable Exit EMA Level, and can open trade only when above EMA200

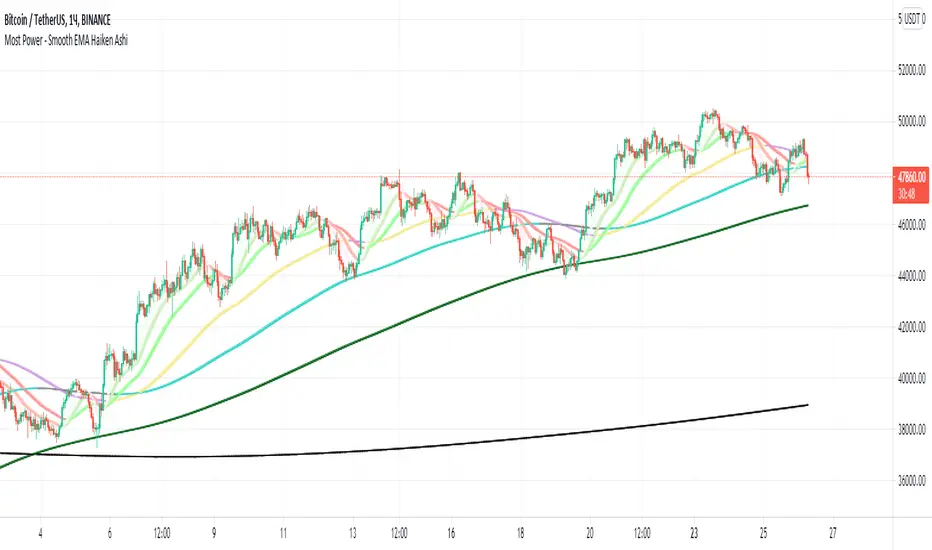
Most Power - Smooth EMA Haiken AshiMost Power - Smooth EMA Haiken Ashi
The indicator displays smoothed EMA (5, 10, 20, 50, 100, 200, 1000). Smoothing occurs through the use of Haiken AShi
Know Sure Thing and EMA Strategy by JLXThis is a simple strategy based in Know Sure Thing indicator and an Exponential moving average,
Rules are as follow:
- You can go long when the KST cross signal bellow 0 and price closes above the target EMA
- You can go short when the KST cross signal above 0 and price closes bellow the target EMA
I include a trailing stop loss, default its 0.5%
Hope you enjoy it

MACD EMA - TradingRush StrategyHey there!
Today I present you a rather simple, but very profitable MACD strategy. Since I trade it with cryptocurrencies, the settings have been adjusted.
I discovered the strategy on a YouTube channel and tried to transfer it as a strategy into a script.
Tested with the crypto pair ETH/USDT in the 15 minute chart.
There is the possibility to switch between short and long positions.
-----------------------------------------------------------------------------------
How does the strategy work?
ENTRY
The MACD indicator must cross below the histogram. If it crosses when the price is below the EMA, only short positions are traded. Above the EMA - long.
EXIT
The Lowest Low (long) / highest high (short) serves as the stop loss. The TP is formed on the basis of a factor. (SL multiplied by factor 2.1 = TP).
The red lines are used to illustrate the SL. Above for short positions below for long positions.
The results of the strategy are without commissions and levers.
If you have any questions or feedback, please let me know in the comments.
If you need more information about the strategy and want to know exactly how to apply it, check out my profile.
I wish you good luck with the strategy!

3 EMA Stochastik RSI ATR SL TP only LONGHey there!
Here i will show you the 3 EMA RSI Stochastic Crossover strategy with an ATR SL and TP.
The strategy works as follows:
For long positions, the EMA's must be in the following order:
The 8 E M A must be above the 14 E M A and the 14 E M A must be above the 50 E M A.
The buy signal is given to us by the Stochastic RSI indicators.
The K line must cross the D line above. The following candle must then close above all E M A's.
The stop loss is determined by three times the value of the ATR.
The take profit is determined by two times the value of the ATR.
In this strategy only long positions are traded.

Three EMA and Stochastic RSI Signals with TP and SL AlertsThis is kind of similar to one of my other scripts but I figured people might be looking for this one in a simple wrapped up package. It takes 3 EMAs, a 50, 14 and an 8 and the trade signals come from crossovers of the Stochastic RSI lines and conditions that marry up with the EMAs lining up in an uptrend or downtrend condition. I used the TP and SL lines from one of my other scripts so you can see where the winners and losers are. Includes alerts so they can be used with webhooks to automate however you wish. I have added signal confirmation with Weiss Wave Volume on side with trend. Stop and TP Levels are configurable in the settings as well as the periods for the ATR used in these calculations.

Multi MA CloudsEMA Clouds are used for identifying trends. It helps to see moving averages as in a range especially when you look at them in Micro time frames like 1/5/10/15/30 mins. So these Clouds could be used for Intraday trading for identifying trends and pullbacks.
For example, on a 10min chart, once you see a parabolic move, don't take trade until the bar touches 5/13 or 8/9 EMA clouds.
There are other EMA cloud scripts available but this one gives you option to choose MA Type and Source in addition to providing all well known MA range in one script. You can modify the MA length as you wish. So you can disable one you don't want to see on the chart.
Please look at my other scripts at www.tradingview.com

Custom Moving Average (EMA & SMA)This script is a custom visualization tool to plot 4 Moving Averages (MA).
Each MA is customizable; you can:
enable (disable) the plot of MA;
select whether the MA is an EMA or an SMA;
the length;
the source (open, close, ...);
the offset value (default is 0).
Note:
The 1st MA is an EMA with length 50.
The others MAs are SMA with length 9, 30 and 100 respectively.

Bjorgum Triple EMA Strat-This script uses a triple EMA strategy to establish trend direction and reversal points
-Inputs are smoothed with Heiken Ashi values to reduce whipsaws, while providing timely execution
-Buy and sell indications are dictated by bar color
-Bar color is dictated by the candle close value in relation to the EMAs, specifically the faster of the 3
(If candle closes above or below the fast and intermediate averages, a buy or sell signal is indicated by bar color change)
-If the close falls between the two a cautionary signal is given. The viewer can hold, or take profit, or evaluate other indicators for clues
-Best results are obtained when coupled with Bjorgum TSI and Bjorgum RSI for confirmation of signals (see TradingView profile)
@Bjorgum on Stocktwits

Double BB & Double EMA by IKINThis is the combination of code to detect the cross over between EMA 7 & EMA 21.
By using the double Bollinger Bands will help traders to make the decision by exit the counter just incase buy at the highest price.
Create for FREE TRADING VIEW USER

Bollinger Band+ Multi EMA, SMAHello Everyone.
I make Bollinger band , 3 ema and 3 sma combined.
I think this indicator can use all timeframe.
--------------------------------------------------------------
Indicator will show you
1. Trend follow
2. Pullback catch
2. Market bounce.
1. Trend Follow
- Trend Follow for I used 3 terms. They are short, Mid and Long Trend.
2. Pullback Catch
- EMA for Save, take care, alert Zones.
- Mid Term Trend can be catch also.
3. Market Bounce
- Bollinger Band will show you market re-bounce point.
Final Notes
Indicator will show Trend, Pullback, Market bounce and some support and resistant level.

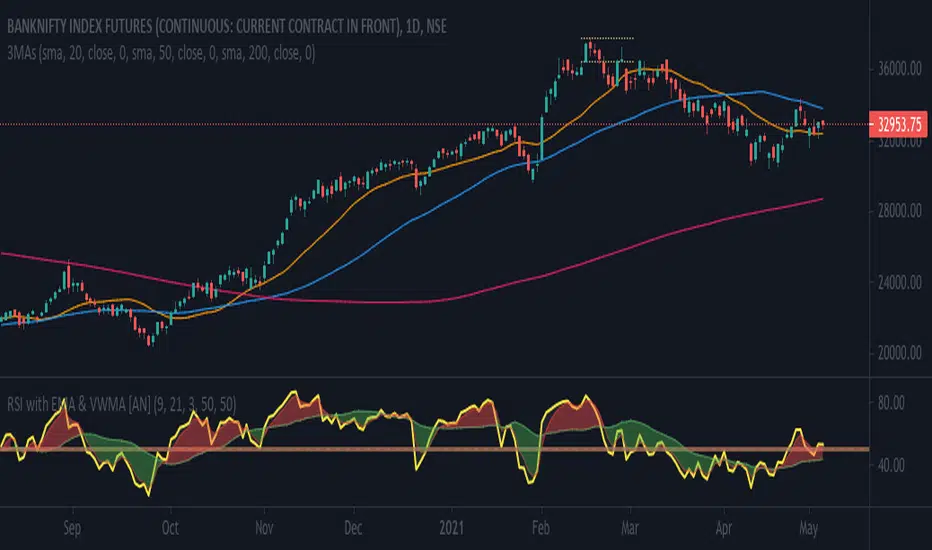
RSI with WMA & EMA [AN]Key Factors traced
- Price: EMA (Exponential Moving Average)
- Volume: WMA (Weighted Moving Avg.)
- Strength (Momentum): RSI (Relative Strength Indicator)
Default parameters
1. RSI at 9. Over brought & Under sold to 50 to be used as a median. This can be altered to the traditional 70:30 or 60:40
2. WMA at 21
3. EMA at 3, Exponential for Intraday trades
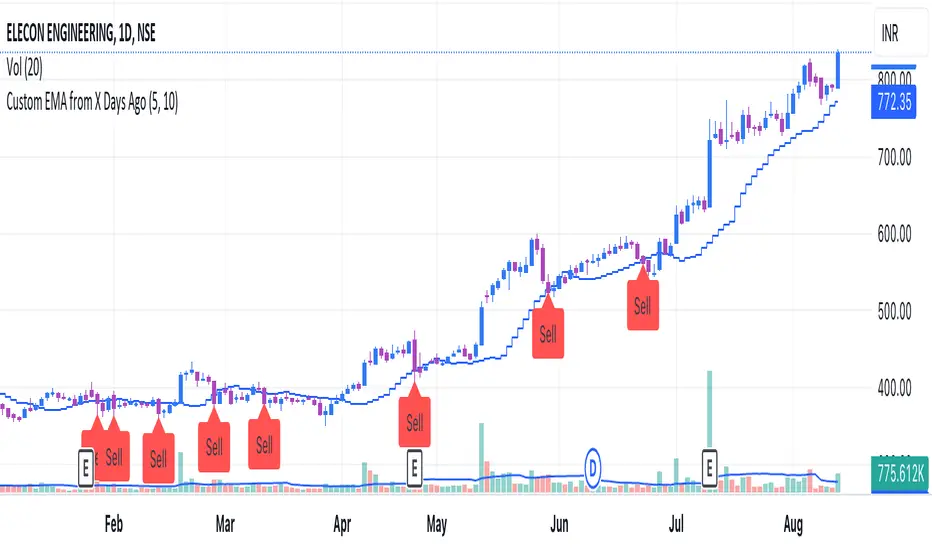
SMA 9/50/180 | EMA 20 | BUY/SELLAllows for 3 SMAs and One EMA, Combined with Buy/Sell Indicator
Defaults to following settings:
9 SMA - Red
50 SMA - Blue
180 SMA - White
20 EMA - Yellow
Input Values and Colors can be modified
Recommend changes to the Style default
-uncheck SMA2
-uncheck Buy/Sell Chart Line

All EMA & MA in onDas Script zeigt EMA sowie MA 21, 50 ,100, 200
Es sind alle Farben einstellbar sowie die bereiche zwischen EMA und MA als Zone einfärbbar.