ATH Reversion (ES)All credit here to str1nger for building this initially. I just added some more ES-relevant calculations for reversion from ATH's. This version plots reversions from ES ATH at 3, 5, 7, 10, 15, 20, and 25%.
Поиск скриптов по запросу "ATH"


ATH Levels V3Added the ability to hide the Peak ATH level so that you can zoom into lower levels with more detail. Useful when prices are tanking and you want a better view.

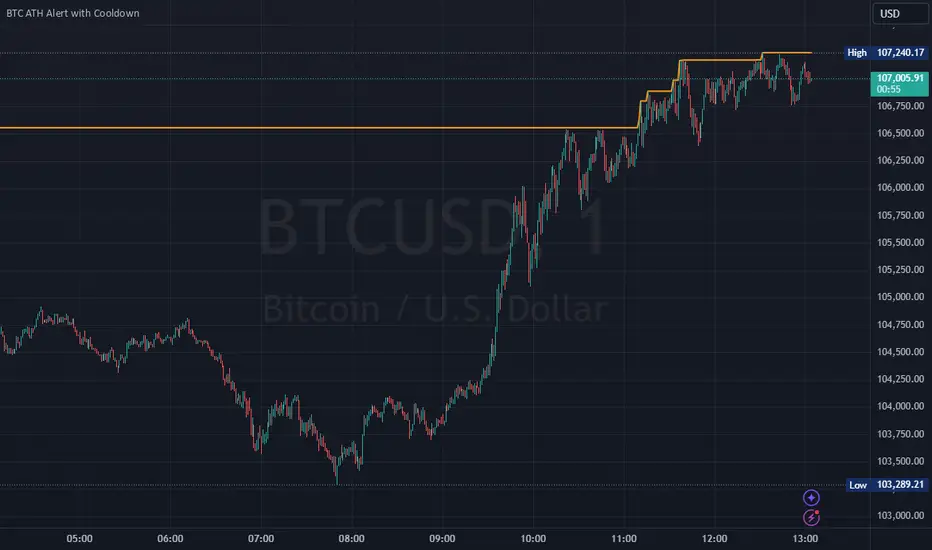
Bitcoin All-Time High (ATH) Alert with Cooldown₿ Bitcoin All-Time High (ATH) Alert with Cooldown 🚀👩🚀
🔍 What it does:
This indicator tracks new all-time highs (ATHs) and alerts you when Bitcoin (or any asset) reaches a fresh ATH, while avoiding alert spam with a customizable cooldown period.
✨ Key Features
✅ Alerts for New ATHs: Never miss when Bitcoin makes history!
✅ Cooldown Period: Prevents multiple alerts within a short timeframe (customizable in settings).
✅ ATH Line on Chart: A clear, visual line marking the all-time high price.
✅ Manual Reset Option: Reset the ATH for testing or specific chart conditions.
⚙️ How to Use
Add the Indicator: Apply it to your chart like any other indicator. Ideally on a small time frame, the cooldown is 20 bars by default (adjustable) which gives 20 minutes on the 1 min chart.
Customize Settings:
- Cooldown Period (bars): Set the number of bars to wait before triggering another alert (e.g., 20 bars).
- Show All-Time High Line: Toggle to display or hide the ATH line visually.
- Reset All-Time High: Use this to manually reset the ATH to the current bar's high.
Create an Alert:
Open the "Alerts" menu.
Select the condition: "New All-Time High" .
Choose a trigger type:
Once Per Bar: For immediate alerts when a new ATH occurs.
Once Per Bar Close: To confirm the ATH at the end of each bar.
🛠️ Who is it for?
Traders and HODLers who want to stay on top of price action.
Anyone looking for clean and efficient ATH tracking with no redundant alerts
🚀 Never miss a new ATH again. Stay ahead of the market!
Anchored ATH Drawdown LevelsThe Anchored ATH Drawdown Levels plots horizontal lines from a chosen anchor price (ATH), showing potential pullback zones at set percentage drops below it.
This indicator's use lies in its anchored ATH framework, which rapidly visualizes precise drawdown levels as dynamic levels of interest or price targets enabling traders to anticipate pullback depths and potential reversal levels without manual calculations.
Pick "True ATH" for the all-time high or "Period ATH" for anchored highs reset weekly, monthly, or quarterly. Lines stretch right for a cleaner visual.
Key Features
Anchoring: True ATH (lifetime max) or Period ATH (resets on 1W/1M/3M intervals).
Drawdown Levels: 8 adjustable levels (defaults: -5%, -10%, -15%, -20% on; -25% to -50% off). Toggle each, set drop % (0.1-99.9), pick color, style (solid/dashed/dotted), width (1-3).
ATH Line: Optional ATH line with custom color, style, width.
Unified Look: Global overrides for all levels' color, style, width.
Labels: Show % drops (with/without prices) via text boxes or full tags; sizes from tiny to large.
Projection: Lines extend 5-100 bars right (default 20).
Settings
Anchor: Mode and timeframe.
Display: Toggle levels/ATH, set extension.
Labels: Style (text/full/none), size, price display.
Global/ATH/Levels: Colors, styles, widths (per-level or shared).
How to Use
Load on chart (overlays prices; handles up to 500 lines).
Choose anchor for your high.
Tune levels for key pullbacks (e.g., -5% minor, -20% major).
Customize visuals where the lines update on new peaks.

Breakouts & Pullbacks [Trendoscope®]🎲 Breakouts & Pullbacks - All-Time High Breakout Analyzer
Probability-Based Post-Breakout Behavior Statistics | Real-Time Pullback & Runup Tracker
A professional-grade Pine Script v6 indicator designed specifically for analyzing the historical and real-time behavior of price after strong All-Time High (ATH) breakouts. It automatically detects significant ATH breakouts (with configurable minimum gap), measures the depth and duration of pullbacks, the speed of recovery, and the subsequent run-up strength — then turns all this data into easy-to-read statistical probabilities and percentile ranks.
Perfect for swing traders, breakout traders, and anyone who wants objective, data-driven insight into questions like:
“How deep do pullbacks usually get after a strong ATH breakout?”
“How many bars does it typically take to recover the breakout level?”
“What is the median run-up after recovery?”
“Where is the current pullback or run-up relative to historical ones?”
🎲 Core Concept & Methodology
Indicator is more suitable for indices or index ETFs that generally trade in all-time highs however subjected to regular pullbacks, recovery and runups.
For every qualified ATH breakout, the script identifies 4 distinct phases:
Breakout Point – The exact bar where price closes above the previous ATH after at least Minimum Gap bars.
Pullback Phase – From breakout candle high → lowest low before price recovers back above the breakout level.
Recovery Phase – From the pullback low → the bar where price first trades back above the original breakout price.
Post-Recovery Run-up Phase – From the recovery point → current price (or highest high achieved so far).
Each completed cycle is stored permanently and used to build a growing statistical database unique to the loaded chart and timeframe.
🎲 Visual Elements
Yellow polyline triangle connecting Previous ATH / Pullback point(start), New ATH Breakout point (end), Recovery point (lowest pullback price), and extends to recent ATH price.
Small green label at the pullback low showing detailed tooltip on hover with all measured values
Clean, color-coded statistics table in the top-right corner (visible only on the last bar)
Powerful Statistics Table – The Heart of the Indicator
The table constantly compares the current situation against all past qualified breakouts and shows details about pullbacks, and runups that help us calculate the probability of next pullback, recovery or runup.
🎲 Settings & Inputs
Minimum Gap
The minimum number of bars that must pass between breaking a new ATH and the previous one.
Higher values = stricter filter → only the strongest, cleanest breakouts are counted.
Lower values = more data points (useful on lower timeframes or very trending instruments).
Recommendation:
Daily charts: 30–50
4H charts: 40–80
1H charts: 100–200
🎲 How to Use It in Practice
This indicator helps investors to understand when to be bullish, bearish or cautious and anticipate regular pullbacks, recovery of markets using quantitative methods.
The indicator does not generate buy/sell signals. However, helps traders set expectations and anticipate market movements based on past behavior.

YCGH ATH DrawdownHow the Indicator Measures Drawdown from ATH
The indicator continuously tracks and calculates the percentage decline from the all-time high (ATH) using a systematic approach.
ATH Tracking Mechanism
Dynamic ATH Calculation: The script maintains a persistent variable that stores the highest price ever reached. On each bar, it compares the current high with the stored ATH using ath := math.max(ath, high), updating the ATH whenever a new peak is reached.

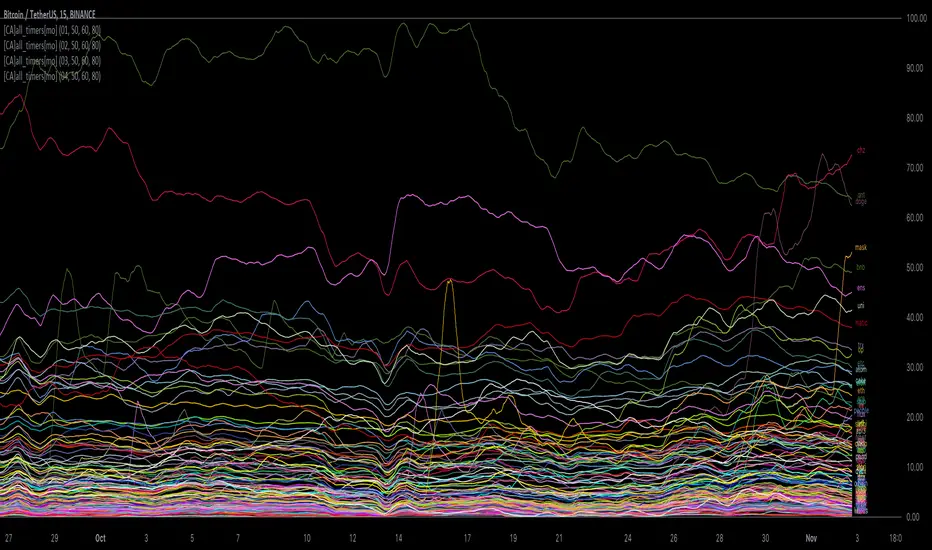
[ChasinAlts] All-Timers [MO]*** PLEASE NOTE: THIS SCRIPT WILL MAKE TV's SERVERS FLEX IT'S MUSCLES SO IT WILL SLOW DOWN OTHER PROCESSES WITHIN TV (HIDE THEM IF NECESSARY TO REGAIN THE SPEED/FUNCTION...OR DELETE THEM...WHAT DO I CARE???) ESP IF YOU HAVE 3-4 ITERATIONS AS I DO TO SHOW THE WHOLE KUCOIN MARGIN MARKET ***
G'day Tradeurs, Hope everyone is having a FAN-FRIGGIN-TASTIC DAY!!! Right now (November 2nd, 2022) is a GREAT time to look for coins that are near their ALL-Time Low
due to the incoming bull market rearing its head around the corner (I'd wait for ONE MORE big dump to be safe though). And how GREAT would it be to even have
$50 of a coin with 10X leverage (I wouldn't suggest this to others though) at the near bottom said market? That is the reason for me publishing this.
This is a quick little scanner script thats part of my "Market Overview" series. Nothing monumental or advanced regarding the ATH/ATL calculations.
Perhaps one thing slightly different here than others is both the % from ATH and % from ATL is calculated and the result is the % that the price is between it's ATH/ATL.
So, it will show the All Time High/All Time Low BUT ONLY to the extent that the TF will allow. Ie. For the Free Planned Users, they can only get data as far back as
5,000 bars would provide. Thus, the ATH/ATL will not show the ACTUAL ATH/ATL but the highest high/lowest low within the last 5,000 bars. So if you want to get more
granular then I suggest you going with a Lower TF but if you want to see the ACTUAL ATH/ATL then the Daily TF or higher is what you're looking for. Make sure to note
that when a coin's plot is staying even with the 0 or 100 line(0 being the ATL within the TF and vise versa) that means the coin is pushing the ATH/ATL further than it
previously was, Also, as with many of my other scripts, I've included a coin filter that will either allow or disallow the plot to be printed depending on if the
"Printed Bar Count" is selected and if it's % is above the threshold (set by the user). This filter will pretty much be useless on the higher TF so don't expect a change
in the data output if you're using a HTF and have that filter selected for use. Elaboration on the inner-workings of MOST inputs can be found in the tooltips provided
along side it and viewed within the settings menu by hovering your curser over the little circled "i" next to the appropriate setting (or near it if the tooltips are
referencing each other or other inputs around itself). May the force be with your trades (in my best Darth Vader voice). Toodles. -ChasinAlts
[BoTo] ATH/2 OverlayThan this indicator is useful?
Can help you to understand this indicator who main in the market now. Bulls or bears.
How it works
All-Time-High ('ATH') - the highest point in price that a cryptocurrency has been in history.
Step 1: The 'ATH' line is drawn
Step 2: 'ATH/2' line is drawn.
Step 3: If the price became more than 'ATH' it means the market bulls have taken, and the price it will be more probable to increase. And vice versa. If the price became less than 'ATH/2' it means that the market was taken by bears, and the price it will be more probable to fall.
Step 4: If it is the bull market, then the green background is drawn. And vice versa. If it is the bear market, then the red background is drawn. If the market has changed, then the background will be gray color. Only one candle.
How to use it
It is possible to use any timeframes, and any symbol.
It is possible to use chart type only the japanese candles, the line or bars. Don't use Kagi, Renko or Haiken Ashi!
The background can be not shown. You can make 1 or 2 lines. If you have chosen only 1 line, then in the bull market you will see only 'ATH/2' line. And vice versa. In the bear market you will see only the 'ATH' line.
You need just to turn on this indicator once to understand what to wait in this market, big falling or big rockets for. And to switch off it that he didn't prevent to analyze.
It is the good help for long-term investments (the position can be longer than 1 year)
For an example
'Ethereum'
'Ripple'
We tried for you. We want to receive your like for good work.

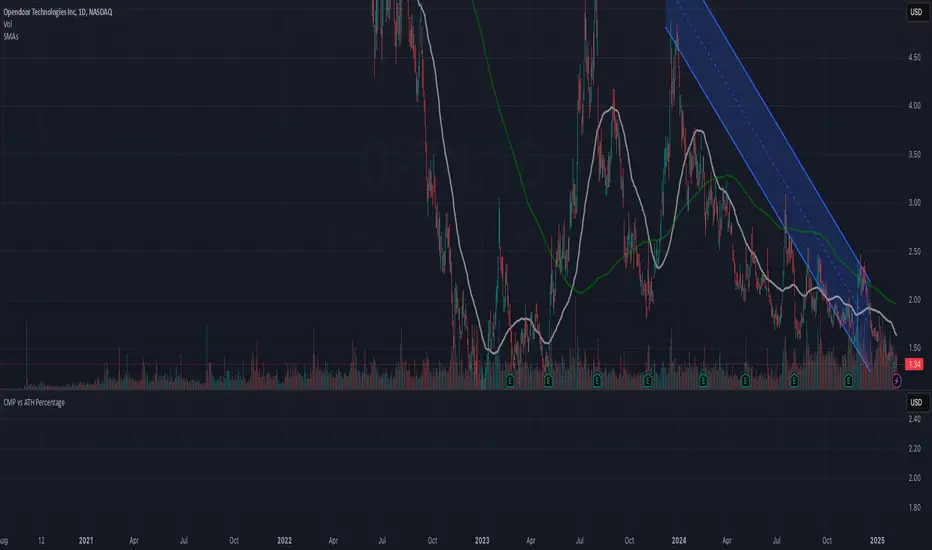
CMP vs ATH PercentageThis indicator helps traders and investors track how the current market price (CMP) compares to the all-time high (ATH) price of an asset. It calculates the percentage difference between the CMP and ATH and displays it visually on the chart. A label is placed on the latest bar, showing key information like:
ATH (All-Time High Price)
CMP (Current Market Price)
Percentage Comparison (CMP as a percentage of ATH)
Additionally, the indicator plots a horizontal line at the ATH level to provide a clear visual reference for the price history.
Use Cases:
Identify price levels relative to historical highs.
Gauge whether the price is nearing or far from its ATH.
Quickly assess how much the price has recovered or declined from the ATH.
Customization:
You can modify the label's style, color, or text formatting according to your preferences. This indicator is useful for long-term analysis, especially when tracking stocks, indices, or other financial instruments on a weekly timeframe.
Note:
This indicator is designed to work on higher timeframes (e.g., daily or weekly) where ATH levels are more meaningful.
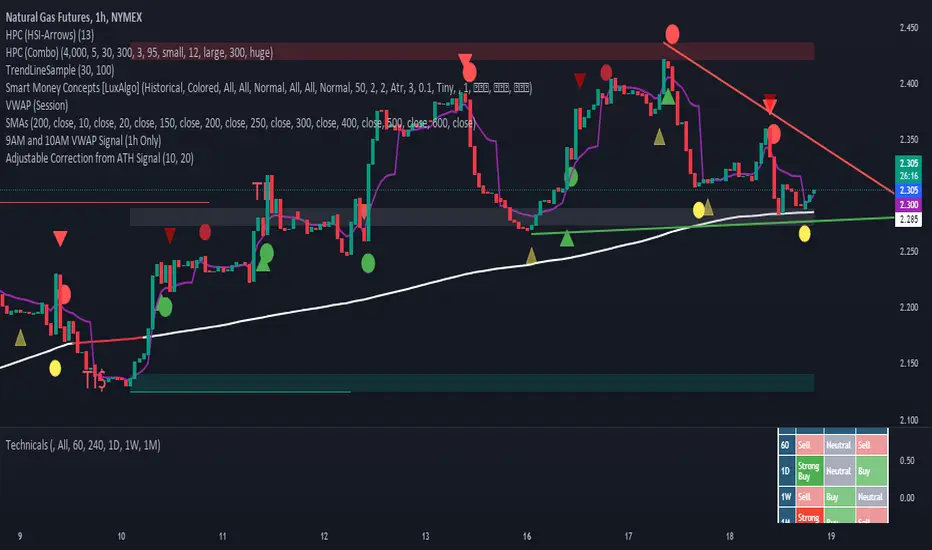
Adjustable Correction from ATH SignalA "Correction Signal from All-Time High" is an indicator used to identify potential reversals or pullbacks in an asset's price after it has reached its highest historical level, known as an all-time high (ATH). This signal typically occurs when the price begins to decline after hitting the ATH, suggesting a correction phase where the asset retraces part of its upward movement.
Key elements of this signal include:
Overbought Conditions: The asset may have experienced a strong rally leading to an overbought condition, where the price could be considered too high relative to recent trends.
Reversal Patterns: The correction signal is often accompanied by technical patterns or indicators that suggest a reversal, such as bearish candlestick formations, negative divergence in momentum indicators, or moving average crossovers.
Percentage Decline: A correction is generally defined as a price drop of at least 10% from the ATH, although smaller pullbacks may also signal potential market shifts.
Volume Analysis: Increased selling volume after the ATH can validate the correction signal, indicating that more market participants are taking profits or exiting positions.
This signal helps traders and investors anticipate periods of market consolidation or potential downturns after significant price advances, allowing for better risk management or entry points for new positions.
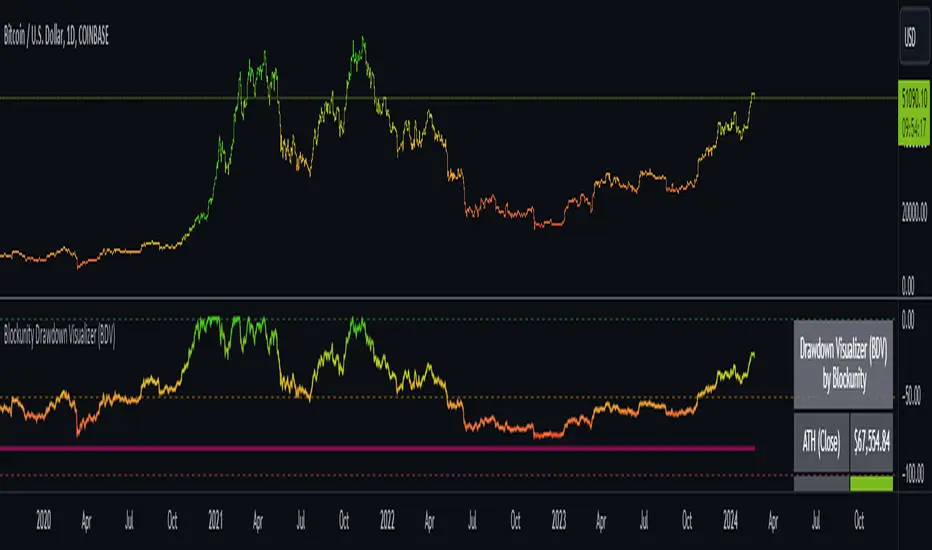
Blockunity Drawdown Visualizer (BDV)Monitor the drawdown (value of the drop between the highest and lowest points) of assets and act accordingly to reduce your risk.
Introducing BDV, the incredibly intuitive metric that visualizes asset drawdowns in the most visually appealing manner. With its color gradient display, BDV allows you to instantly grasp the state of retracement from the asset’s highest price level. But that’s not all – you have the option to display the oscillator’s colorization directly on your chart, enhancing your analysis even further.
The Idea
The goal is to provide the community with the best and most complete tool for visualizing the Drawdown of any asset.
How to Use
Very simple to use, the indicator takes the form of an oscillator, with colors ranging from red to green depending on the Drawdown level. A table summarizes several key data points.
Elements
On the oscillator, you'll find a line with a color gradient showing the asset's Drawdown. The flatter line represents the Max Drawdown (the lowest value reached).
In addition, the table summarizes several data:
The asset's All Time High (ATH).
Current Drawdown.
The Max Drawdown that has been reached.
Settings
First of all, you can activate a "Bar Color" in the settings (You must also uncheck "Borders" and "Wick" in your Chart Settings):
You can display Fibonacci levels on the oscillator. You'll see that levels can be relevant to drawdown. The color of the levels is also configurable.
In the calculation parameters, you can first choose between taking the High of the candles or the Close. By default this is Close, but if you change the parameter to High, the indication next to ATH in the table will change, and you'll see that the values in the table will be affected.
The second calculation parameter (Start Date) lets you modify the effective start date of the ATH, which will affect the drawdown level. Here's an example:
How it Works
First, we calculate the ATH:
var bdv_top = bdv_source
bdv_top := na(bdv_top ) ? bdv_source : math.max(bdv_source, bdv_top )
Then the drawdown is calculated as follows:
bdv = ((bdv_source / bdv_top) * 100) - 100
Then the max drawdown :
bdv_max = bdv
bdv_max := na(bdv_max ) ? bdv : math.min(bdv, bdv_max )
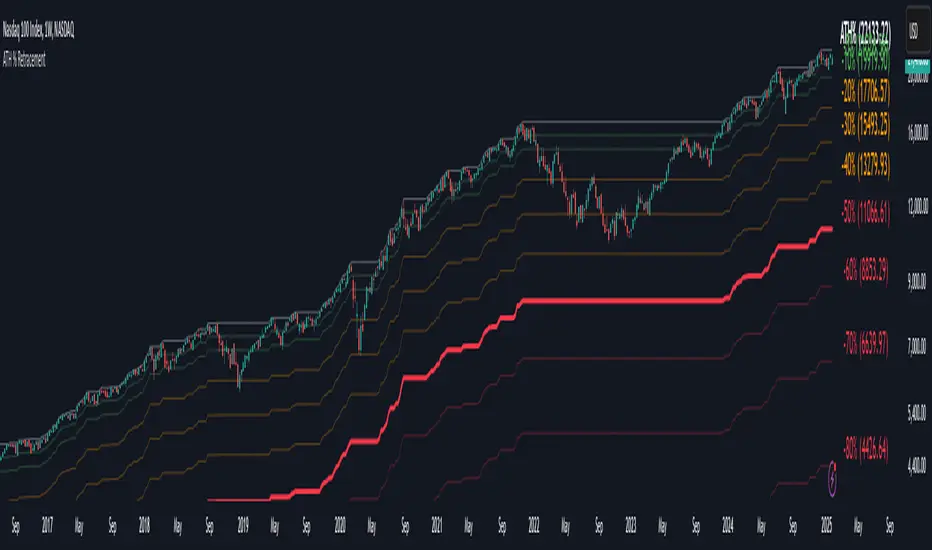
Percentage Retracement from ATH█ OVERVIEW
The Percentage Retracement from ATH indicator is a dynamic trading utility designed to help traders gauge market pullbacks from the peak price. By calculating key retracement levels based on the All-Time High (ATH) and user‑defined percentage inputs, it offers clear visual cues to assist in identifying potential support and resistance zones.
█ KEY FEATURES
Custom Date — Use a custom start date so the indicator only considers specified price action.
Retracement Calculation — Determines ATH and calculates levels based on user‑defined percentages (0% to –100%).
Visual Customisation — Plots configurable horizontal lines and labels showing retracement percentages and prices.
Time Filtering — Uses time filtering to base levels on the desired data period.
█ PURPOSE
Assist traders in visualising the depth of price retracements from recent or historical peaks.
Identify critical zones where the market may find support or resistance after reaching an ATH.
Facilitate more informed entry and exit decisions by clearly demarcating retracement levels on the chart.
█ IDEAL USERS
Swing Traders — Looking to exploit pullbacks following strong upward moves.
Technical Analysts — Interested in pinpointing key retracement levels as potential reversal or continuation points.
Price Action Traders — Focused on the nuances of market peaks and subsequent corrections.
Strategy Developers — Keen to backtest and refine approaches centred on retracement dynamics.
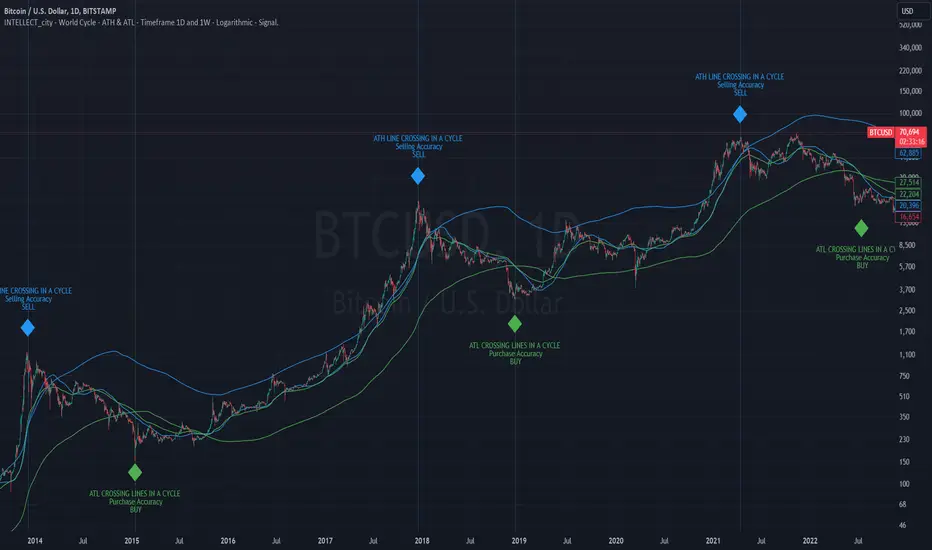
Intelle_city - World Cycle - Ath & Atl - Logarithmic - Strategy.Overview
Indicators: Strategy !
INTELLECT_city - World Cycle - ATH & ATL - Timeframe 1D and 1W - Logarithmic - Strategy - The Pi Cycle Top and Bottom Oscillator is an adaptation of the original Pi Cycle Top chart. It compares the 111-Day Moving Average circle and the 2 * 350-Day Moving Average circle of Bitcoin’s Price. These two moving averages were selected as 350 / 111 = 3.153; An approximation of the important mathematical number Pi.
When the 111-Day Moving Average circle reaches the 2 * 350-Day Moving Average circle, it indicates that the market is becoming overheated. That is because the mid time frame momentum reference of the 111-Day Moving Average has caught up with the long timeframe momentum reference of the 2 * 350-Day Moving Average.
Historically this has occurred within 3 days of the very top of each market cycle.
When the 111 Day Moving Average circle falls back beneath the 2 * 350 Day Moving Average circle, it indicates that the market momentum of that cycle is significantly cooling down. The oscillator drops down into the lower green band shown where the 111 Day Moving Average is moving at a 75% discount relative to the 2 * 350 Day Moving Average.
Historically, this has highlighted broad areas of bear market lows.
IMPORTANT: You need to set a LOGARITHMIC graph. (The function is located at the bottom right of the screen)
IMPORTANT: The INTELLECT_city indicator is made for a buy-sell strategy; there is also a signal indicator from INTELLECT_city
IMPORTANT: The Chart shows all cycles, both buying and selling.
IMPORTANT: Suitable timeframes are 1 daily (recommended) and 1 weekly
-----------------------------
Описание на русском:
-----------------------------
Обзор индикатора
INTELLECT_city - World Cycle - ATH & ATL - Timeframe 1D and 1W - Logarithmic - Strategy - Логарифмический - Сигнал - Осциллятор вершины и основания цикла Пи представляет собой адаптацию оригинального графика вершины цикла Пи. Он сравнивает круг 111-дневной скользящей средней и круг 2 * 350-дневной скользящей средней цены Биткойна. Эти две скользящие средние были выбраны как 350/111 = 3,153; Приближение важного математического числа Пи.
Когда круг 111-дневной скользящей средней достигает круга 2 * 350-дневной скользящей средней, это указывает на то, что рынок перегревается. Это происходит потому, что опорный моментум среднего временного интервала 111-дневной скользящей средней догнал опорный момент импульса длинного таймфрейма 2 * 350-дневной скользящей средней.
Исторически это происходило в течение трех дней после вершины каждого рыночного цикла.
Когда круг 111-дневной скользящей средней опускается ниже круга 2 * 350-дневной скользящей средней, это указывает на то, что рыночный импульс этого цикла значительно снижается. Осциллятор опускается в нижнюю зеленую полосу, показанную там, где 111-дневная скользящая средняя движется со скидкой 75% относительно 2 * 350-дневной скользящей средней.
Исторически это высветило широкие области минимумов медвежьего рынка.
ВАЖНО: Выставлять нужно ЛОГАРИФМИЧЕСКИЙ график. (Находиться функция с правой нижней части экрана)
ВАЖНО: Индикатор INTELLECT_city сделан для стратегии покупок продаж, есть также и сигнальный от INTELLECT_сity
ВАЖНО: На Графике видны все циклы, как на покупку так и на продажу.
ВАЖНО: Подходящие таймфреймы 1 дневной (рекомендовано) и 1 недельный
-----------------------------
Beschreibung - Deutsch
-----------------------------
Indikatorübersicht
INTELLECT_city – Weltzyklus – ATH & ATL – Zeitrahmen 1T und 1W – Logarithmisch – Strategy – Der Pi-Zyklus-Top- und Bottom-Oszillator ist eine Anpassung des ursprünglichen Pi-Zyklus-Top-Diagramms. Er vergleicht den 111-Tage-Gleitenden-Durchschnittskreis und den 2 * 350-Tage-Gleitenden-Durchschnittskreis des Bitcoin-Preises. Diese beiden gleitenden Durchschnitte wurden als 350 / 111 = 3,153 ausgewählt; eine Annäherung an die wichtige mathematische Zahl Pi.
Wenn der 111-Tage-Gleitenden-Durchschnittskreis den 2 * 350-Tage-Gleitenden-Durchschnittskreis erreicht, deutet dies darauf hin, dass der Markt überhitzt. Das liegt daran, dass der Momentum-Referenzwert des 111-Tage-Gleitenden-Durchschnitts im mittleren Zeitrahmen den Momentum-Referenzwert des 2 * 350-Tage-Gleitenden-Durchschnitts im langen Zeitrahmen eingeholt hat.
Historisch gesehen geschah dies innerhalb von 3 Tagen nach dem Höhepunkt jedes Marktzyklus.
Wenn der Kreis des 111-Tage-Durchschnitts wieder unter den Kreis des 2 x 350-Tage-Durchschnitts fällt, deutet dies darauf hin, dass die Marktdynamik dieses Zyklus deutlich nachlässt. Der Oszillator fällt in das untere grüne Band, in dem der 111-Tage-Durchschnitt mit einem Abschlag von 75 % gegenüber dem 2 x 350-Tage-Durchschnitt verläuft.
Historisch hat dies breite Bereiche mit Tiefstständen in der Baisse hervorgehoben.
WICHTIG: Sie müssen ein logarithmisches Diagramm festlegen. (Die Funktion befindet sich unten rechts auf dem Bildschirm)
WICHTIG: Der INTELLECT_city-Indikator ist für eine Kauf-Verkaufs-Strategie konzipiert; es gibt auch einen Signalindikator von INTELLECT_city
WICHTIG: Das Diagramm zeigt alle Zyklen, sowohl Kauf- als auch Verkaufszyklen.
WICHTIG: Geeignete Zeitrahmen sind 1 täglich (empfohlen) und 1 wöchentlich

intellect_city - World Cycle - Ath & Atl - Logarithmic - Signal.Indicator Overview
INTELLECT_city - World Cycle - ATH & ATL - Timeframe 1D and 1W - Logarithmic - Signal - The Pi Cycle Top and Bottom Oscillator is an adaptation of the original Pi Cycle Top chart. It compares the 111-Day Moving Average circle and the 2 * 350-Day Moving Average circle of Bitcoin’s Price. These two moving averages were selected as 350 / 111 = 3.153; An approximation of the important mathematical number Pi.
When the 111-Day Moving Average circle reaches the 2 * 350-Day Moving Average circle, it indicates that the market is becoming overheated. That is because the mid time frame momentum reference of the 111-Day Moving Average has caught up with the long timeframe momentum reference of the 2 * 350-Day Moving Average.
Historically this has occurred within 3 days of the very top of each market cycle.
When the 111 Day Moving Average circle falls back beneath the 2 * 350 Day Moving Average circle, it indicates that the market momentum of that cycle is significantly cooling down. The oscillator drops down into the lower green band shown where the 111 Day Moving Average is moving at a 75% discount relative to the 2 * 350 Day Moving Average.
Historically, this has highlighted broad areas of bear market lows.
IMPORTANT: You need to set a LOGARITHMIC graph. (The function is located at the bottom right of the screen)
IMPORTANT: The INTELLECT_city indicator is made for signal purchases of sales, there is also a strategic one from INTELLECT_city
IMPORTANT: The Chart shows all cycles, both buying and selling.
IMPORTANT: Suitable timeframes are 1 daily (recommended) and 1 weekly
-----------------------------
Описание на русском:
-----------------------------
Обзор индикатора
INTELLECT_city - World Cycle - ATH & ATL - Timeframe 1D and 1W - Logarithmic - Signal - Логарифмический - Сигнал - Осциллятор вершины и основания цикла Пи представляет собой адаптацию оригинального графика вершины цикла Пи. Он сравнивает круг 111-дневной скользящей средней и круг 2 * 350-дневной скользящей средней цены Биткойна. Эти две скользящие средние были выбраны как 350/111 = 3,153; Приближение важного математического числа Пи.
Когда круг 111-дневной скользящей средней достигает круга 2 * 350-дневной скользящей средней, это указывает на то, что рынок перегревается. Это происходит потому, что опорный моментум среднего временного интервала 111-дневной скользящей средней догнал опорный момент импульса длинного таймфрейма 2 * 350-дневной скользящей средней.
Исторически это происходило в течение трех дней после вершины каждого рыночного цикла.
Когда круг 111-дневной скользящей средней опускается ниже круга 2 * 350-дневной скользящей средней, это указывает на то, что рыночный импульс этого цикла значительно снижается. Осциллятор опускается в нижнюю зеленую полосу, показанную там, где 111-дневная скользящая средняя движется со скидкой 75% относительно 2 * 350-дневной скользящей средней.
Исторически это высветило широкие области минимумов медвежьего рынка.
ВАЖНО: Выставлять нужно ЛОГАРИФМИЧЕСКИЙ график. (Находиться функция с правой нижней части экрана)
ВАЖНО: Индикатор INTELLECT_city сделан для сигнальных покупок продаж, есть также и стратегический от INTELLECT_сity
ВАЖНО: На Графике видны все циклы, как на покупку так и на продажу.
ВАЖНО: Подходящие таймфреймы 1 дневной (рекомендовано) и 1 недельный
-----------------------------
Beschreibung - Deutsch
-----------------------------
Indikatorübersicht
INTELLECT_city – Weltzyklus – ATH & ATL – Zeitrahmen 1T und 1W – Logarithmisch – Signal – Der Pi-Zyklus-Top- und Bottom-Oszillator ist eine Anpassung des ursprünglichen Pi-Zyklus-Top-Diagramms. Er vergleicht den 111-Tage-Gleitenden-Durchschnittskreis und den 2 * 350-Tage-Gleitenden-Durchschnittskreis des Bitcoin-Preises. Diese beiden gleitenden Durchschnitte wurden als 350 / 111 = 3,153 ausgewählt; eine Annäherung an die wichtige mathematische Zahl Pi.
Wenn der 111-Tage-Gleitenden-Durchschnittskreis den 2 * 350-Tage-Gleitenden-Durchschnittskreis erreicht, deutet dies darauf hin, dass der Markt überhitzt. Das liegt daran, dass der Momentum-Referenzwert des 111-Tage-Gleitenden-Durchschnitts im mittleren Zeitrahmen den Momentum-Referenzwert des 2 * 350-Tage-Gleitenden-Durchschnitts im langen Zeitrahmen eingeholt hat.
Historisch gesehen geschah dies innerhalb von 3 Tagen nach dem Höhepunkt jedes Marktzyklus.
Wenn der Kreis des 111-Tage-Durchschnitts wieder unter den Kreis des 2 x 350-Tage-Durchschnitts fällt, deutet dies darauf hin, dass die Marktdynamik dieses Zyklus deutlich nachlässt. Der Oszillator fällt in das untere grüne Band, in dem der 111-Tage-Durchschnitt mit einem Abschlag von 75 % gegenüber dem 2 x 350-Tage-Durchschnitt verläuft.
Historisch hat dies breite Bereiche mit Tiefstständen in der Baisse hervorgehoben.
WICHTIG: Sie müssen ein logarithmisches Diagramm festlegen. (Die Funktion befindet sich unten rechts auf dem Bildschirm)
WICHTIG: Der INTELLECT_city-Indikator dient zur Signalisierung von Käufen oder Verkäufen, es gibt auch einen strategischen Indikator von INTELLECT_city
WICHTIG: Das Diagramm zeigt alle Zyklen, sowohl Kauf- als auch Verkaufszyklen.
WICHTIG: Geeignete Zeitrahmen sind 1 täglich (empfohlen) und 1 wöchentlich
IDX Utility Set [zidaniee]Purpose
This indicator is not a technical analysis tool. It’s a companion overlay designed to guide your analysis of the uniquely structured Indonesia Stock Exchange (IDX).
Core Features
Centered Ticker Display – Clean, readable ticker shown at the center of the chart.
Company Name – Displays the listed company’s full name.
Active Timeframe – Shows the currently selected timeframe.
Additional Features
ATH & ATL Markers – Labels the All-Time High (ATH) and All-Time Low (ATL) and shows the percentage distance from the latest price to each level, so you can quickly gauge upside/downside room.
IDX Fraction (Tick) Levels – Visualizes Indonesia’s price-fraction (tick) brackets. This matters because tick size changes by price range—very useful for scalpers and fast traders.
ARA/ARB Levels (Realtime) – Plots Auto-Reject Upper (ARA) and Auto-Reject Lower (ARB) levels in real time. Levels refresh in line with IDX trading hours 09:00–16:00 WIB (UTC+7), so your view stays consistent both during and outside market hours. This feature already complies with the latest rules and adjustments set by the Indonesia Stock Exchange (IDX).
Suspension Status – Shows SUSPENDED if the stock is halted/suspended, helping you avoid unnecessary analysis. The suspension check compares today’s date with the last available candle date and accounts for weekends.
Note: WIB = Western Indonesia Time (UTC+7).

Potential Profit at ATHUsage:
Enter how much of the particular coin you are holding within the settings area.
What this indicator does:
Grabs the current All Time High (ATH).
Uses the ATH to calculate the potential profit in percentage from the current price to ATH.
Calculates the potential profit in EUR based on the percentage in the previous calculation.
Displays the above-mentioned values on the screen as labels.
You now have a forecast of the potential profit you can make when you hodl to the ATH.
Attention: "The example uses 1 coin as default.
For a calculation of your holdings, make sure you enter the amount of the current coin you are holding"

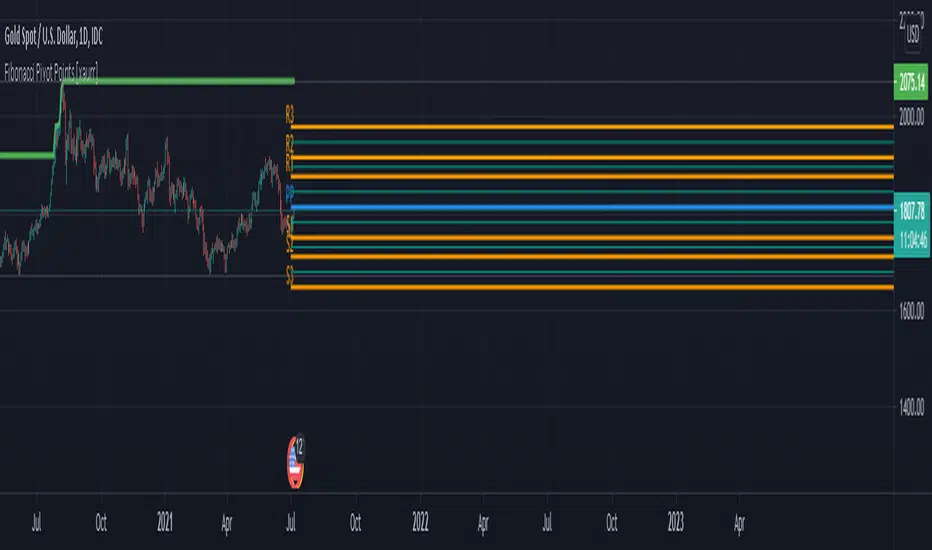
Fibonacci Pivot Points [xaurr]This script is the enhanced version of my previous script Ath Atl Fibonacci Pivot Points
It has standart fibonacci pivot points with auto time frame, you can also choose custom time frame too.
Good Luck!
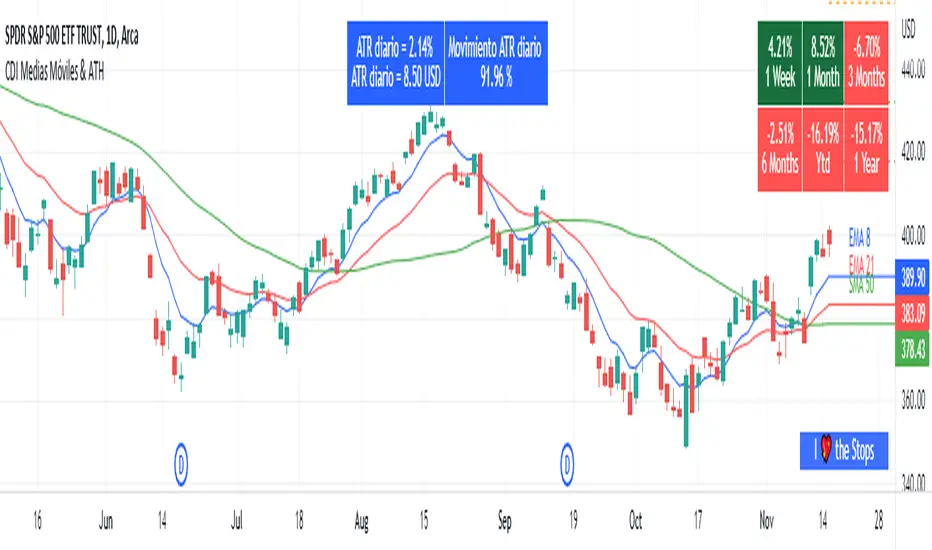
Moving Average and PerformanceThis indicator combines several tools that are used daily for analysis:
The performance of the action we are seeing.
The percentage of retracement the stock has made from its all time high.
Possibility of using up to four exponential or simple moving averages in the length we want.
It allows to see or not the levels of four moving averages in daily temporality.
This indicator is unique since it allows you to see in real time the performance of the Stock or ETF that is being analyzed, which allows you to make a timely decision for short, medium or long-term investments.
If you are doing scalping, swing, or intraday trading, you can see the retracement it has made from the ATH (3, 5, 10 or 13%) which can become Supports or Resistances where the price can rebound, Likewise, the levels of the moving averages in 1D temporality can be observed at the same time, which are usually dynamic supports or resistances and it can also be observed in the same temporality of the chart four moving averages that the trader can configure in the length that you deem convenient to improve your analysis and make decisions as quickly as possible.
Este indicador es único ya que permite ver en tiempo real el rendimiento de la Acción o ETF que se está analizando, lo cual permite tomar una decisión oportuna para las inversiones a corto, mediano o largo plazo.
Si se está haciendo trading tipo scalping, swing, o intradía, se puede observar el retroceso que ha hecho desde el ATH (3, 5, 10 o 13%) el cual puede convertirse en Soportes o Resistencias en donde el precio puede hacer rebotes, así mismo se pueden estar observando al mismo tiempo los niveles de las medias móviles en temporalidad de 1D, los cuales usualmente son Soportes o resistencias dinámicas y también se puede observar en la misma temporalidad del gráfico cuatro medias móviles que el trader puede configurar en la longitud que crea conveniente para mejorar su análisis y tomar decisiones lo más rápido posible.

Adaptive Trend Navigator [ATH Filter & Risk Engine]Description:
This strategy implements a systematic Trend Following approach designed to capture major moves while actively protecting capital during severe bear markets. It combines a classic Moving Average "Fan" logic with two advanced risk management layers: a 4-Stage Dynamic Stop Loss and a macro-economic "Circuit Breaker" filter.
Core Concepts:
1. Trend Identification (Entry Logic) The script uses a cascade of Simple Moving Averages (SMA 25, 50, 100, 200) to identify the maturity of a trend.
Entries are triggered by specific crossovers (e.g., SMA 25 crossing SMA 50) or by breaking above the previous trade's high ("High-Water Mark" Re-Entry).
2. The "Circuit Breaker" (Crash Protection) To prevent trading during historical market collapses (like 2000 or 2008), the strategy monitors the Nasdaq 100 (QQQ) as a global benchmark:
Normal Regime: If the market is within 20% of its All-Time High, the strategy operates normally.
Crisis Regime: If the QQQ falls more than 20% from its ATH, the "Circuit Breaker" activates (Visualized by a Red Background).
Recovery Rule: In a Crisis Regime, new long positions are blocked unless the QQQ reclaims its SMA 200. This filters out "bull traps" in secular bear markets.
3. 4-Stage Risk Engine (Exit Logic) Once in a trade, the risk management adapts to the position's performance:
Stage 1: Fixed initial Stop Loss (default 10%) for breathing room.
Stage 2: Moves to Break-Even area once the price rises 12%.
Stage 3: Tightens to a trailing stop (8%) after 25% profit.
Stage 4: Maximizes gains with a tight trailing stop (5%) during parabolic moves (>40% profit).
Visual Guide:
SMAs: 25/50/100/200 period lines for trend visualization.
Red Background: Indicates the "Crisis Regime" where trading is halted due to broad market weakness.
Blue Background: Indicates a "Recovery Phase" (Crisis is active, but market is above SMA 200).
Red Line: Shows the dynamic Stop Loss level for active positions.
Settings: All parameters (SMA lengths, Drawdown threshold, Risk Stages) are fully customizable. The QQQ benchmark ticker can also be changed to SPY or other indices depending on the asset class traded.

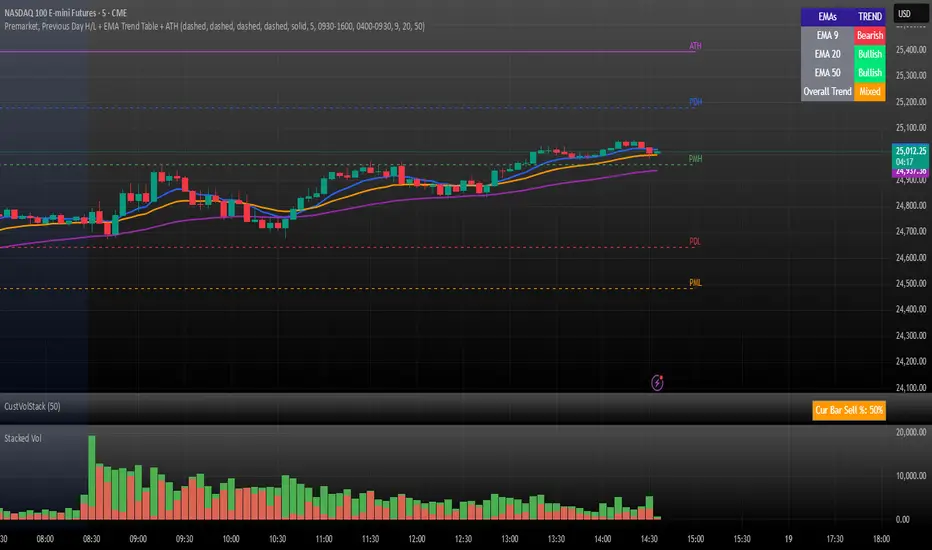
Premarket, Previous Day H/L + EMA Trend Table + ATHPremarket, Previous Day H/L + EMA Trend Table + ATH