S&P Power Hour Liquidity Sweep StrategyThis indicator is designed for intraday traders who want to take advantage of liquidity grabs, break of structure (BOS), and optimal entry points during the most volatile hours of the trading day: the NYSE Power Hours (09:30–10:30 AM and 02:30–04:00 PM EST).
Key Features:
Power Hour Detection:
Automatically identifies the two most liquid hours of the trading session.
Liquidity Sweep Detection:
Highlights when price sweeps a recent swing high or low — a common trap before reversals.
Break of Structure (BOS):
Confirms trend shift after a liquidity sweep with smart money-style BOS markers.
Fair Value Gap (FVG) Highlighting: (Optional)
Spot institutional imbalances between candles to fine-tune trade entries.
How It Works:
Wait for price to sweep a swing high or low during the power hours.
Look for a break of structure (BOS) in the opposite direction.
Enter on the next candle or FVG retest.
The indicator will plot a yellow circle for entry, a red line for stop, and a green line for the target (based on your RR setting).
Customizable Inputs:
Swing sensitivity (lookback bars)
Risk-to-reward ratio
Optional FVG visibility
Best Used With:
Higher timeframe bias (15m/1H)
Order blocks or volume analysis
Avoiding major news events
Whether you're a scalper or precision-based intraday trader, this tool helps you spot high-probability reversal setups with clean visuals and clear confirmations.
Поиск скриптов по запросу "BOS"

Higher Timeframe Market StructureHTF Market Structure – ZigZag, Break of Structure & Supply/Demand
This powerful indicator is designed to identify higher-timeframe market structure using a combination of ZigZag patterns, Break of Structure (BOS) signals, and Supply/Demand zones.
Key Features:
Automatic detection of Higher Highs (HH), Higher Lows (HL), Lower Lows (LL), and Lower Highs (LH)
Internal structure shifts based on Open or High/Low logic
Supply and Demand zones plotted on the chart
Break of Structure (BOS) lines with optional alerts
Mitigation logic to mark or delete invalidated order blocks
Customizable aggregation factor to view higher time frame structure on lower time frames
How to Use:
Focus on market structure and BOS to understand the current trend.
Watch for internal shifts as early signals of potential reversals.
Use ZigZag lines to connect swing highs and lows to visualize market rhythm.
Supply zones (red) and Demand zones (green) are automatically drawn after structure breaks:
Use Demand Zones in Bullish Markets for the highest probability entries.
Use Supply Zones in Bearish Markets to align with the prevailing trend.
Best Practices:
Only use Demand Zones in Bullish markets and Supply Zones in Bearish markets for optimal results.
Look for price action or reversal signals within these zones to refine your entries.
Enable alerts to get notified on:
New order blocks
Internal shifts
BOS events
HH, HL, LL, LH formations
Liquidity sweeps
Customization Options:
Aggregation Factor: Control how many candles are grouped for structure analysis.
Zone Duration: Define how length of plotted zones.
Mitigation Settings: Automatically delete or fade zones after mitigation.
Colors: Choose custom colors for bullish and bearish zones and structure markers.
This tool is ideal for traders who rely on price action, structure, and smart money concepts. Combine it with your own S&D strategy or integrate it with other confluence tools for even better precision.

Market Structure- ZigZag, Break of Structure & Order BlocksDescription:
This script is an all-in-one market structure tool designed for traders who follow price action, Smart Money Concepts (SMC), or institutional order flow. It combines Order Block detection , Break of Structure (BOS) , Internal Structure Shifts (CHoCH) , and a ZigZag swing framework to provide a clear and actionable view of market behavior.
Key Features:
Order Blocks (OB) :
-Detects Bullish (Green) and Bearish (Red) order blocks upon valid market structure shifts.
-Optional deletion of mitigated (touched) blocks to keep charts clean.
-Customizable block duration, fill color, and border color.
Break of Structure (BOS) :
-Marks BOS with horizontal dotted lines when price breaks previous swing highs/lows.
-Confirms new trends and structural shifts.
Internal Structure Shifts (CHoCH-like) :
-Detects early internal changes in direction before BOS.
-User-selectable logic: based on candle Open or High/Low.
-Plotted as small black triangle markers.
ZigZag Swings :
-Connects confirmed internal shifts with black zigzag lines.
-Visually simplifies trend structure and major swing points.
-Tracks last swing highs/lows for BOS validation.
Alerts :
-Bullish/Bearish Engulfments (OB signals)
-Internal Structure Shifts
-Bullish/Bearish Break of Structure
-OB Mitigation Events
Inputs & Settings :
-Show/Hide Bullish or Bearish Order Blocks
-Calculate internal shifts by: Open or High/Low
-Set order block fill and border colors
-Enable or disable automatic deletion of mitigated blocks
-Set duration for order block display
This tool is designed to support price action trading by visually mapping key structural changes and zones of interest directly on your chart. It is not intended to function as a standalone trading strategy , but rather as a supplementary tool to inform your own analysis and discretion.

ICT-Elliott Hybrid Oscillator네이버 프리미엄 콘텐츠 > 재테크 사관학교 검색
This indicator uses Elliott Wave Theory and ICT (Inner Circle Trader) concepts to help easily and accurately predict when asset prices like cryptocurrencies or stocks will rise or fall.
📌 Easy Explanation of Terms
✅ What is Elliott Wave?
A theory stating that price movements follow a specific pattern (5 upward waves + 3 downward waves) repeatedly. Simply put, it's about repetitive cycles of rises and falls creating overall trends.
✅ What is ICT Theory?
A strategy that identifies optimal trading times by observing critical price areas traded by institutional investors (Order Blocks), imbalances in price (Fair Value Gaps - FVG), and major turning points (Break of Structure - BOS).
📈 Signals Provided by the Indicator
🔹 ① Pivot Highs & Lows
Red ▼: Short-term high (increased likelihood of price falling)
Green ▲: Short-term low (increased likelihood of price rising)
🔹 ② Fair Value Gap (FVG)
Green highlighted area: Zone where price is likely to rise again
Red highlighted area: Zone where price is likely to fall again
🔹 ③ Break of Structure (BOS)
Blue "BOS Up": Indicates a shift to an upward trend
Orange "BOS Down": Indicates a shift to a downward trend
⏳ Recommended Timeframe Combinations
| Major Trend (Basic Analysis) | Entry Point (Detailed Analysis) | Short-term Timing (Precision Analysis) |
| ---------------------------- | ------------------------------- | -------------------------------------- |
| 4-hour | 1-hour | 15-minute |
Use the 4-hour timeframe to gauge overall trends,
the 1-hour timeframe to pinpoint exact entry and exit points,
and the 15-minute timeframe for precise timing.
Include Source
🕯 Recommended Candle Patterns
* Pin Bar (Long wick candle) → Trend reversal signal
* Engulfing Candle (fully covering previous candle) → Strong trend reversal signal
* Hammer & Shooting Star (small body with a long wick) → Bullish or bearish reversal signal
* Doji (balance between buyers and sellers) → High potential for trend reversal

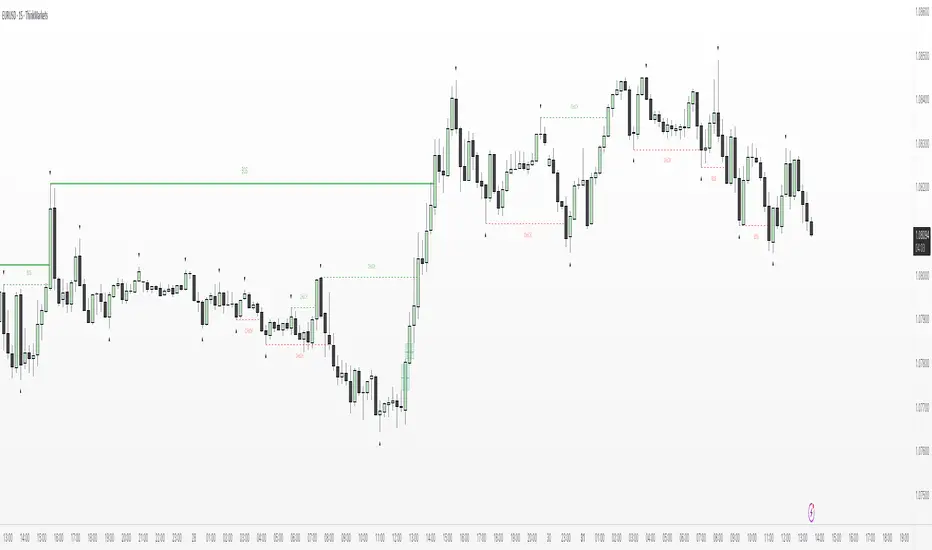
RunRox - Entry Model🎯 RunRox Entry Model is an all-in-one reversal-pattern indicator engineered to help traders accurately identify key price-reversal points on their charts. It will be part of our premium indicator package and improve the effectiveness of your trading strategies.
The primary concept of this indicator is liquidity analysis, making it ideal for Smart Money traders and for trading within market structure. At the same time, the indicator is universal and can be integrated into any strategy. Below, I will outline the full concept of the indicator and its settings so you can better understand how it works.
🧬 CONCEPT
In the screenshot below, I’ll schematically illustrate the core idea of this indicator. It’s one of the patterns that the indicator automatically detects on the chart using a two-timeframe approach. We use the higher timeframe to identify liquidity zones, and the lower timeframe to capture liquidity removal and structure breaks. The schematic is shown in the screenshot below.
Our indicator includes three entry models in total , and I will discuss its functionality and features in more detail later in this post.
💡 FEATURES
Three entry models
PO3 HTF Bar
Entry Area
Optimization for each Entry Area
Filters
HTF FVG
Alert customization
Next, we will examine each entry model in detail.
🟠 ENTRY MODEL 1
The first model is the core one we’ll work with; all other models rely on its structure and construction. In the screenshot below, I’ll schematically show the complete model.
As shown in the screenshot above, we display higher-timeframe candles on the current chart to better visualize the entry model and keep the trader informed of what’s happening on the larger timeframe. The screenshot also highlights both the Long and Short models, as well as the Entry Area, which I will explain in more detail below.
The schematic model on the lower timeframe is shown in the screenshot above. It illustrates that after the Entry Model forms, we draw the Entry Area on the next candle and wait for a price pullback into this zone for the optimal trade entry. Statistically, before moving higher, the price typically revisits the Entry Area, covering the imbalances created by MSS; thus, the Entry Area represents the ideal entry point.
🟩 Entry Area
Once the Entry Model has formed, we focus on identifying the optimal pullback zone for taking a position. To determine which retracement area performs best, we conducted extensive historical backtesting on potential zones and selected those that consistently delivered the strongest results. This process yields Entry Areas with the highest probability of a successful reversal.
On the screenshot above, you can see an example of the Entry Area and which zones carry a higher versus lower probability of reversal. Zones rendered with greater transparency have historically delivered weaker results than the more opaque zones. The deeper-colored areas represent the optimal entry zones and can improve your risk-reward ratio by allowing you to enter at more favorable prices.
It’s important to remember that the entire Entry Area functions as a potential zone for scaling into a position. However, if your risk-to-reward ratio isn’t favorable, you can wait for the price to retrace to lower levels within the Entry Area and enter with a more attractive risk-to-reward.
🟢 Pattern Rating
Each entry model receives a rating in the form of green circles next to its name 🟢. The rating ranges from one to four circles, based on the historical performance of similar patterns. To calculate this rating, we backtest past data by analyzing candle behavior during the model’s formation and assign circles according to how similar patterns performed historically.
Example Ratings:
🟢 – One circle
🟢🟢 – Two circles
🟢🟢🟢 – Three circles
🟢🟢🟢🟢 – Four circles
The more green circles a model has, the more reliable it is—but it’s crucial to rely on your own analysis when identifying strong reversal points on the chart. This rating reflects the model’s historical performance and does not guarantee future results, so keep that in mind!
Below is a screenshot showing four model variations with different ratings on the chart.
⚠️ Unconfirmed Pattern
Entry Model 1 is designed so that, until the higher-timeframe candle closes, the pattern remains unconfirmed and is hidden on the chart. For traders who prefer to see setups as they form, there’s a dedicated feature that displays the unconfirmed pattern at the moment of its appearance - triggered by the Market Structure Shift - before the HTF candle closes. The screenshot below shows what the pattern looks like prior to confirmation.
‼️IMPORTANT: Until the pattern is confirmed and the higher-timeframe candle has closed, the model may disappear from the chart if price reverses and the HTF candle closes below the previous bar. Therefore, this mode is suitable only for experienced traders who want to see market moves in advance. Remember that the pattern can be removed from the chart, so we recommend waiting for the HTF candle to close before deciding to enter a trade.‼️
✂️ Filters
For the primary model, there are four filters designed to enhance entry points or exclude less-confirmed patterns. The filters available in the indicator are:
Bounce Filter
Market Shift Mode
Same Wave Filter
Only with Divergence
I will explain how each of these filters works below.
- Bounce Filter
The Bounce Filter identifies significant deviations of price from its mean and only displays the Entry Model once the asset’s price moves beyond the average level. The screenshot below illustrates how this appears on the chart.
The actual average-price calculation is more sophisticated than what’s shown in the screenshot, that image is just an illustrative example. When the price deviates significantly from the N-bar average, we start looking for the Entry Model. This approach works particularly well in range-bound markets without a clear trend, as it lets you trade strong deviations from the mean.
- Market Shift Mode
This filter works by detecting the initial impulse that triggered the liquidity sweep on the previous higher-timeframe candle, and then holding the Market Structure Shift level at that point after the sweep. If the filter is turned off, price may move higher following the liquidity removal, creating a new MSS level and potentially producing a false structure shift and entry signal on the formed model.
This filter helps you more accurately identify genuine shifts - but keep in mind that the model can still perform well without it, so choose the setting that best suits your trading style.
- Same Wave Filter
The Same Wave Filter removes entry models that form without a clear lower-timeframe structure when liquidity is swept from the previous higher-timeframe candle. In other words, if the prior HTF candle and the current one belong to the same impulse wave - without any retracements on the LTF - the model is filtered out.
Keep in mind that this filter may also exclude patterns that could have produced positive results, so whether to enable it depends on your trading system.
- Only with Divergence
The Only with Divergence filter detects divergence between the lows of successive candles and indicators like RSI. When the low that swept liquidity diverges from the previous candle’s low, the indicator displays a “DIV” label. Although RSI is cited as an example, our divergence calculation is more advanced. This filter highlights patterns where low divergence signals genuine liquidity manipulation and a likely aggressive price reversal.
🌀 Model Settings
Trade Direction: Choose whether to display models for Long or Short trades.
Fractal: Select between automatic fractal detection—which adapts the lower-timeframe (LTF) and higher-timeframe (HTF) candles—or Custom.
Custom Fractal: When Custom is selected, manually specify the LTF and HTF timeframes used to detect the patterns.
History Pattern Limit: Set the maximum number of patterns to display on the chart to keep it clean and uncluttered.
🎨 Model Style
You can flexibly customize the model’s appearance by choosing your preferred line thickness, color, and the other settings we discussed above.
🔵 ENTRY MODEL 2
This model appears under specific conditions when Model 1 cannot form. It’s a price-reversal model constructed according to different rules than the first model. The screenshot below shows how it looks on the chart.
This model forms less frequently than Model 1 but delivers equally strong performance and is displayed as a position-entry zone.
Like the Entry Area in Entry Model 1, this zone is calculated automatically and highlights the best entry levels: areas that showed the strongest historical results are rendered in a brighter shade.
🎨 Model Style
You can flexibly customize the style of Entry Model 2 - its color, opacity, visibility, and the average price of the previous candle.
🟢 ENTRY MODEL 3
Entry Model 3 is a continuation pattern that only forms after Entry Model 1 has completed and delivered the necessary price move to trigger Model 3.
Below is a schematic illustration of how Model 3 is intended to work.
🎨 Model Style
As with the previous models, you can flexibly customize the style of this zone.
⬆️ HTF CANDLES
One of the standout features of this indicator is the ability to plot higher-timeframe (HTF) candles directly on your lower-timeframe (LTF) chart, giving you clear visualization of the entry models and insight into what’s unfolding on the larger timeframe.
You can fully customize the HTF candles - select their style, the number of bars displayed, and tweak various settings to match your personal trading style.
HTF FVG
Fair Value Gaps (FVGs) can also be drawn on the HTF candles themselves, enabling you to spot key liquidity or interest zones at a glance, without switching between timeframes.
Additionally, you can view all significant historical HTF highs and lows, with demarcation lines showing where each HTF candle begins and ends.
All these options let you tailor the HTF candle display on your chart and monitor multiple timeframes’ trends in a single view.
📶 INFO PANEL
Instrument: the market symbol on which the model is detected
Fractal Timeframes: the LTF and HTF fractal periods used to locate the pattern
HTF Candle Countdown: the time remaining until the higher-timeframe candle closes
Trade Direction: the direction (Long or Short) in which the model is searched for entry
🔔 ALERT CUSTOMIZATION
And, of course, you can configure any alerts you need. There are seven alert types available:
Confirmed Entry Model 1
Unconfirmed Entry Model 1
Confirmed Entry Model 2
Confirmed Entry Model 3
Entry Area 1 Trigger
Entry Area 2 Trigger
Entry Area 3 Trigger
You also get a custom macro field where you can enter any placeholders to fully personalize your alerts. Below are example macros you can use in that field.
{{event}} - Event name ('New M1')
{{direction}} - Trade direction ('Long', 'Short')
{{area_beg}} - Entry Area Price
{{area_end}} - Entry Area Price
{{exchange}} - Exchange ('Binance')
{{ticker}} - Ticker ('BTCUSD')
{{interval}} - Timeframe ('1s', '1', 'D')
{{htf}} - High timeframe ('15', '60', 'D')
{{open}}-{{close}}-{{high}}-{{low}} - Candle price values
{{htf_open}}-{{htf_close}}-{{htf_high}}-{{htf_low}} - Last confirmed HTF candle's price
{{volume}} - Candle volume
{{time}} - Candle open time in UTC timezone
{{timenow}} - Signal time in UTC timezone
{{syminfo.currency}} - 'USD' for BTCUSD pair
{{syminfo.basecurrency}} - 'BTC' for BTCUSD pair
✅ USAGE EXAMPLES
Now I’ll demonstrate several ways to apply this indicator across different trading strategies.
Primarily, it’s most effective within the Smart Money framework - where liquidity and manipulation are the core focus - so it integrates seamlessly into your SMC-based approach.
However, it can also be employed in other strategies, such as classic technical analysis or Elliott Wave, to capitalize on reversal points on the chart.
Example 1
The first example illustrates forming a downtrend using a Smart Money strategy. After the market structure shifts and the first BOS is broken, we begin looking for a short entry.
Once Entry Model 1 is established, a Fair Value Gap appears, which we use as our position-entry zone. The nearest target becomes the newly formed BOS level.
In this trade, it was crucial to wait for a strong downtrend to develop before hunting for entries. Therefore, we waited for the first BOS to break and entered the trade to ride the continuation of the downtrend down to the next BOS level.
Example 2
The next example illustrates a downtrend developing with a Fair Value Gap on the 1-hour timeframe. The FVG is also displayed directly on the HTF candles in the chart.
The pattern forms within the HTF Fair Value Gap, indicating that we can balance this inefficiency and ride the continuation of the downtrend.
The target can simply be a 1:2 or 1:3 risk–reward ratio, as in our case.
📌 CONCLUSION
These two examples illustrate how this indicator can be used to identify reversals or trend continuations. In truth, there are countless ways to incorporate this tool, and each trader can adapt the model to fit their own strategy.
Always remember to rely on your own analysis and only enter trades when you feel confident in them.

Simple Market Structure by TomSimple Market Structure by Tom is a clean and efficient trading indicator designed to visually map market structure with ease. It identifies swing highs/lows, break of structure (BOS), and change of character (CHoCH), helping traders analyze price action with precision.
Key Features & Selling Points:
✅ Dual Market Structure Tracking – Supports two independent market structures (MS1 & MS2) with customizable swing lengths.
✅ Customizable BOS & CHoCH Lines – Adjust line styles (solid, dashed, dotted) for clarity.
✅ Toggle BOS & CHoCH Labels – Choose to display BOS & CHoCH labels or keep the chart minimalistic.
✅ Adjustable Structure Icons – Customize icon size and visibility for a cleaner chart experience.
✅ Minimalistic & Adaptable – Easily toggle between a detailed structure breakdown or a simple price action view.
Perfect for price action traders, and swing traders looking to enhance their market structure analysis. 🎯
ICT Gold Trading ToolFirst, I recall the original code had elements like Break of Structure, Fair Value Gaps, Premium/Discount Zones, Liquidity Pools, and Buy/Sell signals. The user had previous feedback pointing out issues in the code, like incorrect timeframe usage for BOS and FVG inaccuracies. They also suggested improvements, which were incorporated into a revised version.
So, the brief note should highlight the main components of the tool without getting too technical. The user probably wants this for a quick overview, maybe to share with others or for their own reference. They might be a trader familiar with ICT concepts, so using terms like BOS or FVG is okay without explaining each one.
I need to mention that the tool combines multiple ICT strategies into one indicator. It uses higher timeframes for BOS, which is important for structure. FVG detection was corrected in the revised code, so I should note that it identifies 3-candle patterns. The zones and liquidity pools help in identifying market extremes and areas where price might reverse. The buy/sell signals are based on a combination of BOS and zones, which adds confluence.
Also, the user might appreciate knowing that the tool is customizable with inputs for periods, making it adaptable to different trading styles. Emphasizing that it's for visual assistance and not standalone signals is crucial to remind users to use additional analysis.

TJR SEEK AND DESTROYTJR SEEK AND DESTROY – Intraday ICT Trading Tool
Built for day traders, TJR SEEK AND DESTROY combines Smart Money concepts like order blocks, fair value gaps, and liquidity sweeps with structure breaks and daily bias to pinpoint high-probability trades during US market hours (9:30–16:00). Ideal for scalping or intraday strategies on stocks, futures, or forex.
What Makes It Unique?
Unlike standalone ICT indicators, this script integrates:
Order Blocks with volume and range filters for precise support/resistance zones.
Fair Value Gaps (FVG) to spot pre-market price imbalances.
Break of Structure (BOS) and Liquidity Sweeps for trend and reversal signals.
A 1H MA-based Bias to align trades with the day’s direction.
BUY/SELL Labels triggered only when bias, BOS, and sweeps align, reducing noise.
How Does It Work?
Order Blocks: Marks zones with high volume (>1.5x 20-period SMA) and low range (<0.5x ATR20) as teal boxes—potential reversal points.
Fair Value Gap: Compares the prior day’s close to the current open (pre- or post-9:30), shown as a purple line and label (e.g., "FVG: 0.005").
Pivot Point: Calculates (prevHigh + prevLow + prevClose) / 3 from the prior day, plotted as an orange line for equilibrium.
Break of Structure: Detects crossovers of 5-bar highs/lows (gray lines), marked with red triangles.
Liquidity Sweeps: Tracks breaches of the prior day’s high/low (yellow lines), marked with yellow triangles.
Daily Bias: Uses 1H close vs. 20-period MA (blue line) for bullish (green background), bearish (red), or neutral (gray) context.
Signals: BUY (green label) when bias is bullish, price breaks up, and sweeps the prior high; SELL (red label) when bias is bearish, price breaks down, and sweeps the prior low.
How to Use It
Setup: Apply to 1M–15M charts for US session trading (9:30–16:00 EST).
Trading:
Wait for a BUY label after a yellow sweep triangle above the prior day’s high in a green (bullish) background.
Wait for a SELL label after a yellow sweep triangle below the prior day’s low in a red (bearish) background.
Use order blocks (teal boxes) as support/resistance for stop-loss or take-profit.
Markets: Best for SPY, ES futures, or forex pairs with US session volatility.
Underlying Concepts
Order Blocks: High-volume, low-range bars suggest institutional activity.
FVG: Gaps between close and open indicate imbalance to be filled.
BOS & Sweeps: Price breaking key levels signals momentum or stop-hunting.
Bias: 1H MA filters trades by broader trend.
Chart Setup
Displays order blocks (teal boxes), pivot (orange), open (purple), bias (colored background), BOS/sweeps (triangles), and signals (labels). Keep other indicators off for clarity.

Ultimate SMC [smart-money-indicators] This indicator is a tool to support the "SMC" strategy.
This indicator does not provide entry or exit signals.
This indicator is a tool to mark key price areas.
This indicator is a tool to mark key time areas.
This indicator is particularly distinguished by its high customizability of tools,
setting it apart from the indicators currently available on the TradingView platform.
Moreover, unlike other "SMC indicators," this one does NOT use pivot points to identify Change of Character (ChoCh) or Break of Structure (BoS).
The following key areas are marked with lines or boxes:
Structure Breaks:
- Bearish Change of Character
- Bearish Break of Structure
- Bullish Change of Character
- Bullish Break of Structure
Premium/Discount Zone:
- Premium/Discount area of the current range, since the last ChoCh or BoS
Potential Buy/Sell Zones (including historical or mitigated):
- Bullish orderblocks
- Bearish orderblocks
Momentum Indicators:
- Bullish Fair Value Gaps
- Bearish Fair Value Gaps
How can I use or interpret these areas?
Structure Breaks:
- If the indicator shows bullish structure breaks in the form of ChoCh or BoS, it indicates a bullish trend.
- If the indicator shows bearish structure breaks in the form of ChoCh or BoS, it indicates a bearish trend.
Premium/Discount Zone:
- If the price is in the premium zone, it indicates that the current price is "expensive," and you should look for sell signals.
- If the price is in the discount zone, it indicates that the current price is "cheap," and you should look for buy signals.
Order Blocks:
- Bearish order blocks indicate strong selling pressure in that area, and you can look for sell signals.
- Bullish order blocks indicate strong buying pressure in that area, and you can look for buy signals.
Momentum Indicators:
- Bullish Fair Value Gaps that form after the creation of an order block may indicate strong buying pressure and confirm a bullish trend.
- Bearish Fair Value Gaps that form after the creation of an order block may indicate strong selling pressure and confirm a bearish trend.

Breaker Blocks + Order Blocks confirm [TradingFinder] BBOB Alert🔵 Introduction
In the realm of technical analysis, various tools and concepts are employed to identify key levels on price charts. These tools assist traders in analyzing market trends with greater precision, enabling them to optimize their trading decisions. Among these tools, the Order Block and Breaker Block hold a significant place, serving as effective instruments for analyzing market structure.
🟣 Order Block
An Order Block refers to zones on a chart where large financial institutions and high-volume traders place their orders. Due to the substantial volume of buy or sell orders in these areas, they are often regarded as pivotal points for potential price reversals or temporary pauses in a trend. Order Blocks are particularly crucial when prices react to these zones after a strong market move, acting as strong support or resistance levels.
🟣 Breaker Block
On the other hand, a Breaker Block refers to areas on a chart that previously functioned as Order Blocks but where the price has managed to break through and continue in the opposite direction. These zones are typically recognized as key points where market trends might shift, helping traders identify potential reversal points in the market.
🟣 Overlapping Block (BBOB)
Now, imagine a scenario where these two essential concepts in technical analysis—Order Blocks and Breaker Blocks—overlap on a chart. Although this overlap is not specifically discussed within the ICT (Inner Circle Trader) trading framework, exploring and utilizing this overlap can provide traders with powerful insights into strong support and resistance zones. The combination of these two robust concepts can highlight critical areas in trading, potentially offering significant advantages in making informed trading decisions.
In this article, we will delve into the concept of this overlap, explaining how to utilize it in trading strategies. Additionally, we will analyze the potential outcomes and benefits of incorporating this concept into your trading decisions.
Bullish Overlapping Block (BBOB) :
Bearish Overlapping Block (BBOB) :
🔵 How to Use
The overlap between Order Blocks and Breaker Blocks is a compelling and powerful concept that can help traders identify key levels on the chart with a high probability of success. This overlap is particularly valuable because it combines two well-regarded concepts in technical analysis—zones of high order volume and critical market shifts.
🟣 Here’s how to effectively use this overlap in your trading
1. Dentifying the Overlapping Block : To make the most of the overlap between Order Blocks and Breaker Blocks, begin by identifying these zones separately. Order Blocks are areas where price typically reacts and reverses after a strong market move.
Breaker Blocks are areas where a previous Order Block has been breached, and the price continues in the opposite direction. When these two zones overlap on a chart, it’s crucial to pay close attention to this area, as it represents a high-probability reaction zone.
2. Analyzing the Overlapping Block : After identifying the overlap zone, carefully analyze price action within this region. Candlestick patterns and price behavior can provide essential clues.
If the price reaches this overlap zone and strong reversal patterns such as Pin Bars or Engulfing patterns are observed, it’s likely that this zone will act as a pivotal reversal point. In such cases, entering a trade with confidence becomes more feasible.
3. Entering the Trade : When sufficient signs of price reaction are present in the overlap zone, you can proceed to enter the trade. If the overlap zone is within an uptrend and bullish reversal signals are evident, a long position might be appropriate.
Conversely, if the overlap zone is in a downtrend and bearish reversal signals are observed, a short position would be more suitable.
4. Risk Management : One of the most critical aspects of trading in overlap zones is managing risk. To protect your capital, place your stop loss near the lowest point of the Order Block (for buy trades) or the highest point (for sell trades). This approach minimizes potential losses if the overlap zone fails to hold.
5. Price Targets : After entering the trade, set your price targets based on other key levels on the chart. These targets could include other support and resistance zones, Fibonacci levels, or pivot points.
Bullish Overlapping Block :
Bearish Overlapping Block :
🟣 Benefits of the Overlapping Block Between Order Block and Breaker Block
1. Enhanced Precision in Identifying Key Levels : The overlap between these two zones usually acts as a highly reliable area for price reactions, increasing the accuracy of identifying entry and exit points.
2. Reduced Trading Risk : Given the high importance of the overlap zone, the likelihood of making incorrect decisions is reduced, contributing to overall lower trading risk.
3. Increased Probability of Success : The overlap between Order Blocks and Breaker Blocks combines two powerful concepts, enhancing the likelihood of success in trades, as multiple indicators confirm the importance of the area.
4. Creation of Better Trading Opportunities : Overlap zones often provide traders with more robust trading opportunities, as these areas typically represent strong reversal points in the market.
5. Compatibility with Other Technical Tools : This concept seamlessly integrates with other technical analysis tools such as Fibonacci retracements, trend lines, and chart patterns, offering a more comprehensive market analysis.
🔵 Setting
🟣 Global Setting
Pivot Period of Order Blocks Detector : Enter the desired pivot period to identify the Order Block.
Order Block Validity Period (Bar) : You can specify the maximum time the Order Block remains valid based on the number of candles from the origin.
Mitigation Level Order Block : Determining the basic level of a Order Block. When the price hits the basic level, the Order Block due to mitigation.
Mitigation Level Breaker Block : Determining the basic level of a Breaker Block. When the price hits the basic level, the Breaker Block due to mitigation.
Mitigation Level Overlapping Block : Determining the basic level of a Overlapping Block. When the price hits the basic level, the Overlapping Block due to mitigation.
🟣 Overlapping Block Display
Show All Overlapping Block : If it is turned off, only the last Order Block will be displayed.
Demand Overlapping Block : Show or not show and specify color.
Supply Overlapping Block : Show or not show and specify color.
🟣 Order Block Display
Show All Order Block : If it is turned off, only the last Order Block will be displayed.
Demand Main Order Block : Show or not show and specify color.
Demand Sub (Propulsion & BoS Origin) Order Block : Show or not show and specify color.
Supply Main Order Block : Show or not show and specify color.
Supply Sub (Propulsion & BoS Origin) Order Block : Show or not show and specify color.
🟣 Breaker Block Display
Show All Breaker Block : If it is turned off, only the last Breaker Block will be displayed.
Demand Main Breaker Block : Show or not show and specify color.
Demand Sub (Propulsion & BoS Origin) Breaker Block : Show or not show and specify color.
Supply Main Breaker Block : Show or not show and specify color.
Supply Sub (Propulsion & BoS Origin) Breaker Block : Show or not show and specify color.
🟣 Order Block Refinement
Refine Order Blocks : Enable or disable the refinement feature. Mode selection.
🟣 Alert
Alert Name : The name of the alert you receive.
Alert Overlapping Block Mitigation :
On / Off
Message Frequency :
This string parameter defines the announcement frequency. Choices include: "All" (activates the alert every time the function is called), "Once Per Bar" (activates the alert only on the first call within the bar), and "Once Per Bar Close" (the alert is activated only by a call at the last script execution of the real-time bar upon closing). The default setting is "Once per Bar".
Show Alert Time by Time Zone :
The date, hour, and minute you receive in alert messages can be based on any time zone you choose. For example, if you want New York time, you should enter "UTC-4". This input is set to the time zone "UTC" by default.
🔵 Conclusion
The overlap between Order Blocks and Breaker Blocks represents a critical and powerful area in technical analysis that can serve as an effective tool for determining entry and exit points in trading.
These zones, due to the combination of two key concepts in technical analysis, hold significant importance and can help traders make more confident trading decisions.
Although this concept is not specifically discussed in the ICT framework and is introduced as a new idea, traders can achieve better results in their trades through practice and testing.
Utilizing the overlap between Order Blocks and Breaker Blocks, in conjunction with other technical analysis tools, can significantly improve the chances of success in trading.

Pro V3 [SMRT Algo]SMRT Algo Suite is a versatile toolkit featuring advanced features designed to deliver valuable signals and insights, catering to every trader's technical analysis requirements with precise data.
The SMRT Algo V3 represents a groundbreaking, comprehensive solution built from the ground up for traders.
While SMRT Algo can complement other technical analysis methods, it is also designed to function effectively as a standalone indicator adaptable to any trading style. Each feature is designed with the understanding that not all technical indicators suit every market condition.
The optimal approach to leveraging this indicator is to explore its diverse features gradually, select a few that best match your trading style, and use them consistently to develop a personalized SMRT Algo strategy.
Features:
Buy & Sell Signals: Clear buy and sell signals displayed on the chart, with ‘+’ indicating strong signals and normal signals without ‘+’.
Candle Coloring: Blue and red candle colors to signify bullish and bearish trends, respectively.
Signal Sensitivity: Adjust the frequency of signals to match your trading preferences.
MA Filter: Customizable moving average filter to ensure trades align with the prevailing trend.
Dashboard: Multi-timeframe analysis with information on various timeframes, offering quick decision-making capabilities and a customizable dashboard size.
Trailing Stop Loss: Suggestions for trailing stop losses to maximize profits while minimizing risk.
Power MA: A custom moving average that closely follows price, highlighting short-term market trends.
ChoCh/Bos: Displays internal market structure, including changes of character and breaks of structure.
Market Structure: Shows external market structure, detailing changes of character, breaks of structure, and pivot points.
Support & Resistance: Key support and resistance zones plotted on the chart.
Reversals: Highlights areas with a high likelihood of reversal using diamond markers.
Reversal Bands: Zones where price is likely to reverse or correct.
Trend Lines: Auto-plotted trendlines for quick and easy analysis.
Retest Zones: Ideal for break-and-retest traders, identifying key retest zones for entries and re-entries
Take Profit & Stop Loss: Customizable take profit and stop loss points.
Full Any Alert() Function Call Conditions: Create custom alerts directly to your TradingView device for timely notifications.
Additional features: A set of toggles turning on/off these indicators.
SMRT Algo Pro V3 offers a comprehensive set of features designed to enhance your trading experience by providing actionable insights and customizable tools for all trading styles.
SMRT Algo Pro V3 Confirmation Signals and Candle Coloring
The signals in SMRT Algo Pro V3 can generate both normal and strong labels, with strong signals marked by the "+" symbol. These signals are closely linked to the candle coloring, providing a visual representation of trend development to help navigate various market conditions effectively.
Candle Coloring:
Blue Candles: Indicate bullish trends.
Red Candles: Indicate bearish trends.
Candles will turn blue when there is a buy signal, and turn red when there is a sell signal.
The candle coloring is especially useful when interpreting signals. For instance, a consistent series of blue candles alongside buy signals suggests a strong uptrend, reducing the likelihood of a fake-out. Conversely, a series of red candles with sell signals indicates a strong downtrend.
Dashboard for Multi-Timeframe Analysis
The dashboard provides a consolidated view of multiple timeframes, helping traders make quick decisions based on comprehensive data. This feature reduces the need to switch between charts, streamlining the analysis process.
The dashboard will show the trend of higher timeframes, based on signal calculation and the trend filter.
Note on the dashboard: To reduce memory load, it will only display information from the current timeframe and up.
Trailing Stop Loss
This component workw to maximize profits and manage risk. The Trailing Stop Loss feature provides dynamic stop loss levels. Traders can use this feature to place their stop loss in profit while price goes in favor of your direction, so that less profit is left on the table, should the trade reverse against you.
Green trailing stop loss ranges are shown for buy trades, while red lines are shown for sell trades. This can be used together with the buy & sell signals to trail the stop loss for those trades.
Power MA
The Power MA follows the price closely, indicating short-term market trends and potential exit points. Traders can use the Power MA to determine when to enter a trade. For example, if the Pro V3 prints a buy signal, but the power MA is red (indicating that the market is short term bearish), it can act as a confirmation to stay out of that trade. Conversely, if the power MA is blue, then it can be an added confirmation to enter the buy trade based on the signals.
Market Structure
The inclusion of ChoCh/Bos (Change of Character and Break of Structure) helps traders understand internal and external market shifts. The ChoCh/Bos shows internal market structure, while the Market Structure feature shows the external market structure. This feature is crucial for identifying key turning points and potential trend continuations, as well as ICT traders.
We recommend traders to use this as an added confirmation, for example, once a buy signal is printed, wait for an internal or external Choch/BOS, possibly indicating that the market is now in control of the bulls. From there traders an either enter off another signal from the V3 or wait for the retest from the Retest Zones feature of the V3.
Support & Resistance, Reversals, and Reversal Bands
These features highlight critical market levels and areas where price is likely to reverse or correct. They are essential for traders looking to capitalize on key support and resistance zones or potential reversal points.
They can be used together with the buy & sell signals. An example is when a sell signal appears, we can look for potential trade exits either at the S/R zones, the reversal diamonds that are printed on the candle, or when price touches the reversal bands.
Trend Lines
Auto-plotted trend lines and the trend ribbon provide insights into longer-term trends. They can be used together with the buy sell features of the V3, e.g. if a sell signal is printed, but price is in the lower half of the trend lines, we can assume that price is in an area of premium for our short trade. Traders can choose whether to wait for price to retrace back into an area of discount (top half of the trend line), where they can look to short.
Retest Zones
The Retest Zones feature identifies optimal entry and re-entry points for break-and-retest strategies. As mentioned earlier, this feature can be used together with other features to act as a re-entry or further confirmation before entering a trade.
Traders can wait for a signal to be printed by the V3, and wait for further confrirmation from the retest zones to enter at a better price. This feature can be used together with the signals, and the market structure features to create a simple break & retest strategy.
Take Profit Modes:
SMRT Algo Pro V3 includes a versatile Take Profit Mode designed to help traders optimize their exits:
Hybrid Mode: Displays Take Profit, entry, and stop loss lines on the chart for the current position. Additionally, small circles labeled TP1, TP2, and TP3 indicate the points where take profit levels were hit.
Minimal Mode: Only displays the small circles labeled TP1, TP2, and TP3, providing a cleaner chart view while still indicating take profit hits.
Traditional Mode Only: Displays only the lines for Take Profit, entry, and stop loss, without the small circles.
Take profits are based off of 1:1, 1:2 and 1:3 risk to reward ratio with respect to the stop loss.
These modes offer flexibility for traders to choose their preferred level of detail on the chart, helping them to manage their trades effectively and track their take profit levels clearly.
The features of SMRT Algo Pro V3 can significantly strengthen your market analysis by providing additional confluences. These features allow traders to cross-verify signals and trends, making their strategies more robust and reliable. Here's how you can leverage these features:
SMRT Algo Pro V3 offers a comprehensive suite of tools and features that extend beyond the capabilities of standard or open-source indicators, providing significant additional value to users.
Integrated System: Unlike basic or open-source tools that may require multiple installations and configurations, SMRT Algo Pro V3 combines all necessary indicators into a cohesive system.
Advanced Customization: The toolkit offers extensive customization options, including signal sensitivity adjustments, customizable MA Filters, and various Take Profit Modes. These features allow traders to tailor the system to their specific trading styles and risk tolerance, providing a level of personalization that free tools often lack.
Real-Time Market Adaptation: SMRT Algo Pro V3 includes features like a deep learning dashboard and real-time market data integration, which continuously update and adapt to changing market conditions. This ensures that users receive the most current and relevant signals, enhancing decision-making accuracy.
Educational Support: Alongside the tools, SMRT Algo provides comprehensive educational resources and tutorials, helping traders understand how to effectively use the system and develop robust trading strategies. This educational aspect adds significant value, especially for beginners looking to deepen their knowledge.
Comprehensive Analysis Tools: The inclusion of multi-timeframe analysis, a detailed dashboard, and advanced market structure indicators help traders make more informed decisions by offering a complete picture of market dynamics.
Support and Community: Subscribers to SMRT Algo Pro V3 gain access to dedicated 24/7 support and an active trading community. This support network can be invaluable for troubleshooting, strategy development, and gaining insights from other experienced traders.
SMRT Algo believe that there is no magic indicator that is able to print money. Indicator toolkits provide value via their convinience, adaptibility and uniqueness. Combining these items can help a trader make more educated; less messy, more planned trades and in turn hopefully help them succeed.
RISK DISCLAIMER
Trading involves significant risk, and most day traders lose money. All content, tools, scripts, articles, and educational materials provided by SMRT Algo are intended solely for informational and educational purposes. Past performance is not indicative of future results. Always conduct your own research and consult with a licensed financial advisor before making any trading decisions.

Order Blocks & Breaker Blocks [TradingFinder] Signals + Alerts🔵 Introduction
Order Block and Breaker Block, are powerful tools in technical analysis. By understanding these concepts, traders can enhance their ability to predict potential price reversals and continuations, leading to more effective trading strategies.
Using historical price action, volume analysis, and candlestick patterns, traders can identify key areas where institutional activities influence market movements.
🟣 Demand Order Block and Supply Breaker Block
Demand Order Block : A Demand Order Block is formed when the price succeeds in breaking the previous high pivot.
Supply Breaker Block : A Supply Breaker Block is formed when the price succeeds in breaking the Demand Order Block. As a result, the Order Block changes its role and turns from the role of price support to resistance.
🟣 Supply Order Block and Demand Breaker Block
Supply Order Block : A Supply Order Block is formed when the price succeeds in breaking the previous low pivot.
Demand Breaker Block : A Demand Breaker Block is formed when the price succeeds in breaking the Supply Order Block. As a result, the Order Block changes its role and turns from the role of price resistance to support.
🔵 How to Use
🟣 Order Blocks (Supply and Demand)
Order blocks are zones where the likelihood of a price reversal is higher. In demand zones, buying opportunities arise, while in supply zones, selling opportunities can be explored.
The "Refinement" feature allows you to adjust the width of the order block to fit your trading strategy. There are two modes in the "Order Block Refine" feature: "Aggressive" and "Defensive." The primary difference between these modes is the width of the order block.
For risk-averse traders, the "Defensive" mode is ideal as it offers a lower loss limit and a higher reward-to-risk ratio.
Conversely, for traders who are willing to take more risks, the "Aggressive" mode is more suitable. This mode, with its wider order block width, caters to those who prefer entering trades at higher prices.
🟣 Breaker Blocks (Supply and Demand)
Trading based on breaker blocks is the same as order blocks and the price in these zones is likely to be reversed.
🔵 Setting
🟣 Global Setting
Pivot Period of Order Blocks Detector : Enter the desired pivot period to identify the Order Block.
Order Block Validity Period (Bar) : You can specify the maximum time the Order Block remains valid based on the number of candles from the origin.
Mitigation Level Order Block : Determining the basic level of a Order Block. When the price hits the basic level, the Order Block due to mitigation.
Mitigation Level Breaker Block : Determining the basic level of a Breaker Block. When the price hits the basic level, the Breaker Block due to mitigation.
Switching Colors Theme Mode : Three modes "Off", "Light" and "Dark" are included in this parameter. "Light" mode is for color adjustment for use in "Light Mode".
"Dark" mode is for color adjustment for use in "Dark Mode" and "Off" mode turns off the color adjustment function and the input color to the function is the same as the output color.
🟣 Order Block Display
Show All Order Block : If it is turned off, only the last Order Block will be displayed.
Demand Main Order Block : Show or not show and specify color.
Demand Sub (Propulsion & BoS Origin) Order Block : Show or not show and specify color.
Supply Main Order Block : Show or not show and specify color.
Supply Sub (Propulsion & BoS Origin) Order Block : Show or not show and specify color.
🟣 Breaker Block Display
Show All Breaker Block : If it is turned off, only the last Breaker Block will be displayed.
Demand Main Breaker Block : Show or not show and specify color.
Demand Sub (Propulsion & BoS Origin) Breaker Block : Show or not show and specify color.
Supply Main Breaker Block : Show or not show and specify color.
Supply Sub (Propulsion & BoS Origin) Breaker Block : Show or not show and specify color.
🟣 Order Block Refinement
Refine Order Blocks : Enable or disable the refinement feature. Mode selection.
🟣 Alert
Alert Name : The name of the alert you receive.
Alert Demand OB Mitigation :
On / Off
Alert Demand BB Mitigation :
On / Off
Alert Supply OB Mitigation :
On / Off
Alert Supply BB Mitigation :
On / Off
Message Frequency :
This string parameter defines the announcement frequency. Choices include: "All" (activates the alert every time the function is called), "Once Per Bar" (activates the alert only on the first call within the bar), and "Once Per Bar Close" (the alert is activated only by a call at the last script execution of the real-time bar upon closing). The default setting is "Once per Bar".
Show Alert Time by Time Zone :
The date, hour, and minute you receive in alert messages can be based on any time zone you choose. For example, if you want New York time, you should enter "UTC-4". This input is set to the time zone "UTC" by default.
Display More Info :
Displays information about the price range of the order blocks (Zone Price) and the date, hour, and minute under "Display More Info".
If you do not want this information to appear in the received message along with the alert, you should set it to "Off".

Institutional Liquidity and Price Action Concepts [AlgoAlpha]🚀 Introducing the Institutional Liquidity and Price Action Concepts™ (ILPAC) , a comprehensive toolkit developed by AlgoAlpha as part of our Premium Collection. This All-in-One indicator offers a robust approach to understanding price action and liquidity, empowering traders with hyper customizable features to tailor their analysis to their specific trading strategies.
Designed with efficiency and compactness in mind, the script shows Price action and liquidity through four methods: Market Structure , Liquidity Heatmap , Trend Lines , and FOMO Bubbles . Additionally, the script also includes a fully customizable interface, to match each individual's trading style. By utilizing a blend of advanced algorithms and customizable parameters, Institutional Liquidity and Price Action Concepts™ (ILPAC) provides traders with a vast array of trading strategies ranging from high frequency scalping to timing better entries on long-term swing and investing positions.
The ILPAC ™ can be used with or without other AlgoAlpha Premium Collection indicators as this indicator has been designed to be able to act as a standalone toolkit.
Let's delve into the key features and functionalities of this versatile indicator:
🎯 Key Features (summary):
Market Structure Analysis :
Customizable time-horizon
BOS confirmation methods
Adjustable CHoCH/BOS line styles
Swing point highlighting
Color customization
Liquidity Heatmap:
Configurable look-back period
Adjustable resolution
Customizable scale colors
Trend Lines :
Look-back period settings
Noise filter factor
Trend line signals with color options
FOMO Bubbles :
Configurable look-back period
Adjustable noise filter factor
Customizable bubble colors
🎯 Key Features (in-depth):
The Market Structure component within ILPAC ™ shows the underlying trend of the market using swing high and lows and is purely price action based. Higher Highs(HH), Higher Lows(HL) labels generally indicate an uptrend and Lower Highs(LH) and Lower Lows(LL) indicate a downtrend. The trend of the market is also determined by Change of Characters (CHoCH) and Break of Structure patterns (BOS). The Market Structure component marks out all these automatically and colours the bars on your chart for easy visualisation of trend.
The Liquidity Heatmap component within ILPAC ™ visualizes areas of high and low liquidity in the market. It identifies zones where liquidity is concentrated not only at specific price levels but also over time, giving the user a 3 Dimensional view of liquidity. The heatmap colours represent different levels of liquidity, making it easy to see where large volumes of orders may exist. This component helps traders understand the liquidity landscape and make informed decisions based on potential support and resistance levels.
The Trend Lines component within ILPAC ™ automatically draws trend lines based on historical price data. It identifies significant highs and lows, connecting them to form trend lines that highlight the overall market direction as well as give breakout signals as shown in the image below. The component also includes a noise filter to reduce false signals and ensure only valid trend breakouts are displayed. Customizable colour settings allow traders to personalize the visual representation of trend lines on their charts.
The FOMO Bubbles component within ILPAC ™ identifies periods of market activity driven by Fear of Missing Out (FOMO). By analysing price action and volume, it highlights bubbles where traders are likely entering positions impulsively. These bubbles are displayed on the chart with customizable colours, providing a visual cue for potential overbought or oversold conditions. This component helps traders recognize and potentially capitalize on market exuberance or panic.
🎯Usage Examples:
At its core, the components within ILPAC ™ were designed to operate with each other as a form of confluence and robust analysis. Typically, Price action components such as the Market Structure and Trend Lines can be used for entries while the Liquidity components like FOMO Bubbles and the Heatmap can be used to find exit points. Here are some examples of how they can be used.
Trend Trading
Using the Market Structure component, enter a trade during a CHoCH and set TP at key areas of liquidity using the heatmap. Users can also choose to enter into a BOS which is an indication of a trend continuation.
Reversal Trading
Using the Liquidity Heatmap to find areas of liquidity for possible reversals, wait for a rejection from a liquidity zone and use the Trend Line Breakout signals as confluence for an entry. Exits can be set at liquidity zones or using FOMO Bubbles as take profit signals.
(These are just examples for reference, the ILPAC ™ offers significantly more possibilities for customisation and fine tuning of your trading strategy.)
🎯Conclusion:
The Institutional Liquidity and Price Action Concepts™ (ILPAC) indicator by AlgoAlpha is a powerful tool for traders, offering in-depth market insights through its Market Structure, Liquidity Heatmap, Trend Lines, and FOMO Bubbles components. By integrating Price Action based analysis with Liquidity analysis, ILPAC ™ boasts a superior design for the confluence between its components, using Price Action components for entry opportunities and Liquidity based components for exit opportunities. With its highly customizable settings, this indicator caters to all trading styles, from scalping to long-term investing. By providing clear visualizations and automatic trend and liquidity detection, ILPAC ™ empowers traders to make informed decisions, enhancing their trading strategies and improving overall market understanding.
Платный скрипт

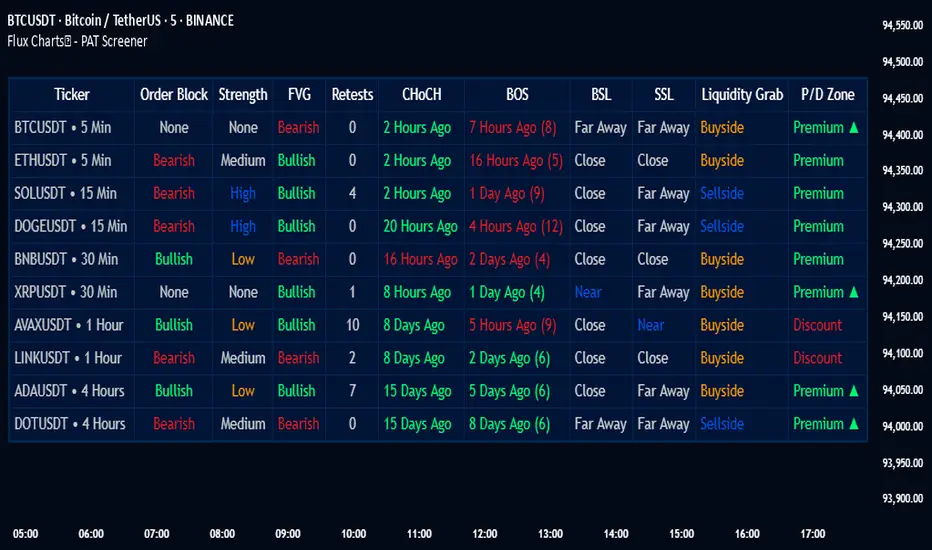
PAT Screener | Flux Charts💎 GENERAL OVERVIEW
Introducing our new Price Action Toolkit (PAT) Screener! This screener can spot trading opportunities that Price Action Toolkit offers across 8 different tickers! We believe that this screener will help you take a glimpse of the current state of the market much easier.
Features of the new Price Action Toolkit (PAT) Screener :
Finds Latest Across 8 Tickers:
Order Blocks
Breaker Blocks
Fair Value Gaps (FVG)
Inversion FVGs
Market Structures (BOS, CHoCH, CHoCH+)
Liquidity Zones
Liquidity Grabs
Premium / Discount Zones
Shows Additional Information Like :
Strength
Retests
(Bullish & Bearish) Volume
Consumption
Also :
All Features Support Tuning
Customizable Theme
📌 HOW DOES IT WORK ?
1. Order Blocks
Order blocks occur when there is a high amount of market orders exist on a price range. It is possible to find order blocks using specific formations on the chart.
The high & low volume of order blocks should be taken into consideration while determining their strengths. The determination of the high & low volume of order blocks are similar to FVGs, in a bullish order block, the high volume is the last 2 bars' total volume, while the low volume is the oldest bar's volume. In a bearish order block scenario, the low volume becomes the last 2 bars' total volume.
2. Breaker Blocks
Breaker blocks form when an order block fails, or "breaks". It is often associated with market going in the opposite direction of the broken order block, and they can be spotted by following order blocks and finding the point they get broken, i.e. price goes below a bullish order block.
The volume of a breaker block is simply the total volume of the bar that the original order block is broken. Often the higher the breaking bar's volume, the stronger the breaker block is.
The strength of Order & Breaker Blocks are calculated by the size of the block to the Average True Range (ATR) of the chart.
3. Fair Value Gaps
Fair value gaps often occur when there is an imbalance in the market, and can be spotted with a specific formation on the chart.
The volume when the FVG occurs plays an important role when determining the strength of it, so we've placed two bars on the FVG zone, indicating the high & low volumes of the FVG. The high volume is the total volume of the last two bars on a bullish FVG, while the low volume is - of the FVG. For a bearish FVG, the total volume of the last two bars is the low volume. The indicator can also detect FVGs that exist in other timeframes than the current chart.
4. Inversion Fair Value Gaps
A Fair Value Gap generally occur when there is an imbalance in the market. They can be detected by specific formations within the chart. An Inverse Fair Value Gap is when a FVG becomes invalidated, thus reversing the direction of the FVG.
IFVGs get consumed when a Close / Wick enters the IFVG zone. Check this example:
5. Market Structures
Sometimes specific market structures form and break as the market fills buy & sell orders. Formed Change of Character (CHoCH) and Break of Structure (BOS) often mean that market will change direction, and they can be spotted by inspecting low & high pivot points of the chart.
The number of times the chart recently had a BOS is displayed between brackets, Ex : (3)
6. Liquidity Zones
Buyside & Sellside Liquidity zones are where most traders place their take-profits and stop-losses in their long / short positions. They are spotted by using high & low pivot points on the chart.
7. Liquidity Grabs
Liquidity grabs occur when one of the latest pivots has a false breakout. Then, if the wick to body ratio of the bar is higher than 0.5 (can be changed from the settings) a liquidity grab has occurred.
8. Premium & Discount Zones
The premium zone is a zone that is over the fair value of the asset's price, and the discount zone is the opposite. They are formed by the latest high & low pivot points.
If the latest close price is outside the Premium or Discount zone, you will see "Premium ⬆️" or "Discount ⬇️". These mean that the price is currently higher than the premium zone or lower than the discount zone.
🚩UNIQUENESS
This screener offers a comprehensive dashboard for traders, combining multiple analytical elements with customizable settings to aid in decision-making across different tickers and timeframes. We believe that this will help traders spot trading opportunities much easier by providing crucial information in a single dashboard. Our new screener contains of common elements like Order & Breaker Blocks, Fair Value Gaps & IFVGs as well as rather unique elements like Liquidity Grabs . With the use of up to 8 tickers & timeframes , you can easily take a look at the bigger picture of the market. We recommend reading the "How Does It Work" section of the description to get a better understanding about how this indicator is unique to others.
⚙️SETTINGS
1. Tickers
You can set up to 8 tickers for the screener to scan here. You can also enable / disable them and set their individual timeframes.
You can enable / disable Retests, Strength, Consumption and (Bullish & Bearish) Volume for :
Order Blocks (Retests, Strength, Bullish & Bearish Volume)
Breaker Blocks (Retests, Strength, Volume)
Fair Value Gaps (Retests, Consumption, Strength, Bullish & Bearish Volume)
Inversion Fair Value Gaps (Retests, Consumption, Strength, Volume)
2. Order Blocks
Enabled -> Enables / Disables Order Blocks
Zone Invalidation -> Select between Wick & Close price for Order Block Invalidation.
Swing Length -> Swing length is used when finding order block formations. Smaller values will result in finding smaller order blocks.
3. Breaker Blocks
Enabled -> Enables / Disables Breaker Blocks
Zone Invalidation -> Select between Wick & Close price for Breaker Block Invalidation.
4. Fair Value Gaps
Enabled -> Enables / Disables Fair Value Gaps
Zone Invalidation -> Select between Wick & Close price for FVG Zone Invalidation.
Zone Filtering -> With "Average Range" selected, algorithm will find FVG zones in comparison with average range of last bars in the chart. With the "Volume Threshold" option, you may select a Volume Threshold % to spot FVGs with a larger total volume than average.
FVG Detection -> With the "Same Type" option, all 3 bars that formed the FVG should be the same type. (Bullish / Bearish). If the "All" option is selected, bar types may vary between Bullish / Bearish.
Detection Sensitivity -> You may select between Low, Normal or High FVG detection sensitivity. This will essentially determine the size of the spotted FVGs, with lower sensitivities resulting in spotting bigger FVGs, and higher sensitivities resulting in spotting all sizes of FVGs.
5. Inversion Fair Value Gaps
Zone Invalidation -> Select between Wick & Close price for IFVG Zone Invalidation. This setting also switches the type for IFVG consumption.
6. Market Structures
Break Of Structure (BOS) -> If the current structure of the market is broken in a bullish or bearish direction, it will be displayed.
Change Of Character (CHoCH) -> If the market shifts into another direction, it will be displayed.
Change Of Character+ (CHoCH+) -> This will display Change Of Characters detected with higher sensitivity if enabled.
7. Liquidity Zones
Buyside Liquidity -> Enables / Disables Buyside Liquidity
Sellside Liquidity -> Enables / Disables Sellside Liquidity
8. Liquidity Grabs
Pivot Length -> This setting determines the range of the pivots. This means a candle has to have the highest / lowest wick of the previous X bars and the next X bars to become a high / low pivot.
Wick-Body Ratio -> After a pivot has a false breakout, the wick-body ratio of the latest candle is tested. The resulting ratio must be higher than this setting for it to be considered as a liquidity grab.
9. Premium & Discount Zones
Enabled -> Enables / Disables Premium & Discount Zones.
10. Style
You can customize the visual looks of the screener here.
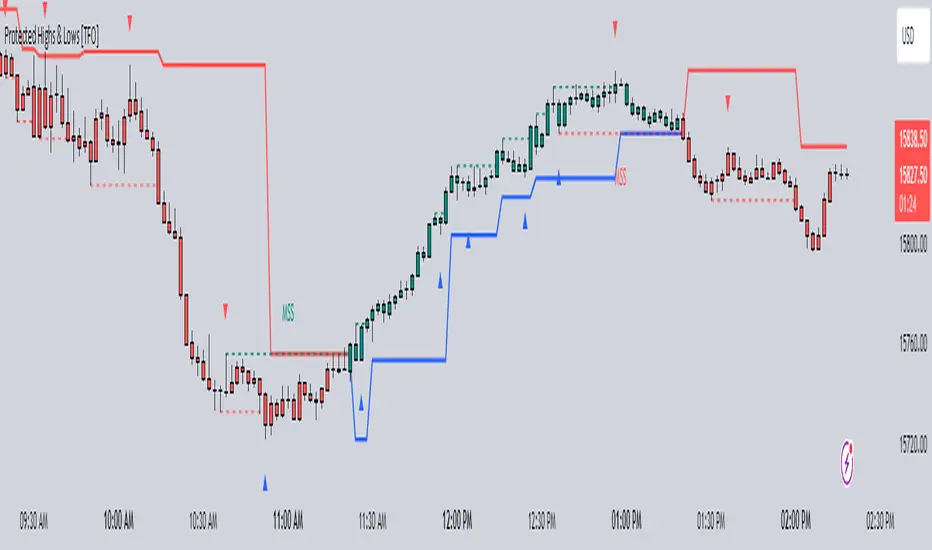
Protected Highs & Lows [TFO]This indicator presents an alternative approach to identify Market Structure. The logic used is derived from learning material created by @DaveTeaches
When quantifying Market Structure, it is common to use fractal highs and lows to identify "significant" swing pivots. When price closes through these pivots, we may identify a Market Structure Shift (MSS) for reversals or a Break of Structure (BOS) for continuations. The main difference with this "protected" logic is in how we determine the pivots/levels that are utilized to determine a valid MSS or BOS.
Nonetheless, the significance of our swing pivots is still governed by the input Pivot Strength parameter, which requires valid swing pivots to be compared to this many bars to the left and right of them. This is an optional parameter as it is traditionally set to 1 by default.
When identifying a BOS: When price closes below a valid swing low, we look back from the current bar to find the highest high that was made in that range. This becomes our protected high; similarly, when price closes above a valid swing high, we look back from the current bar to find the lowest low that was made in that range, which then becomes our protected low.
Note these valid highs and lows are the first swing pivots created after a MSS/BOS. For example, when price makes a bullish BOS/MSS and then trades away, a swing high is formed. This first swing high is what needs to be traded through to see a valid BOS.
When identifying a MSS: If the current trend is bearish and we're looking for a bullish reversal, we would need price to close above the most recent protected high. When this happens, we still look back to find the lowest low that was created in that range, and make that our new protected low. Likewise when looking for a bearish reversal, price would need to close below the most recent protected low, which would then give us a new protected high as a result (the highest point in that range).
The Trend Candles option allows users to easily visualize the current state of Market Structure with bullish and bearish colors. Users may also show BOS and MSS labels if desired.
Show Protected Highs & Lows will annotate the protected highs and lows, just note that the labels themselves are plotted in the past due to the lookback function required to identify them.
Lastly, the Show Protected Trail option will draw a line to essentially indicate a trailing stop-like line to denote the most recent protected low (if bullish) or protected high (if bearish).
I am simply a student of Dave's concepts, so please feel free to leave feedback if you are familiar with his concepts and have suggestions/improvements.
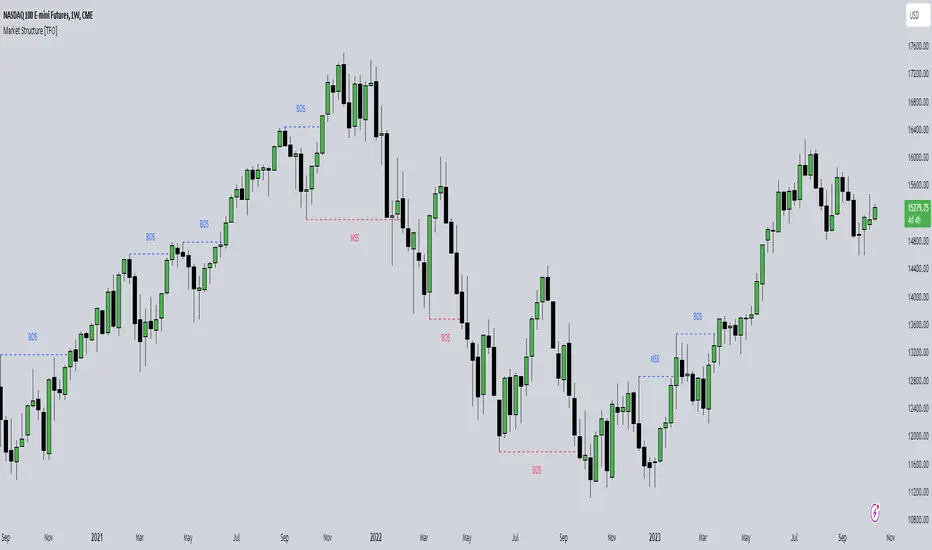
Market Structure [TFO]The purpose of this indicator is to provide a simple approach to Market Structure. When price is closing over swing highs, we may categorize that as bullish structure; and when price is closing below swing lows, we may categorize that as bearish structure.
We can easily find swing highs and lows via the following built-in Pine Script functions:
ta.pivothigh()
ta.pivotlow()
We can pass in our Pivot Strength parameter to determine the size/significance of these pivots. The lowest value of 1 will validate a swing high when a given high is larger than that of 1 bar to the left and right of it. A pivot strength of 3, for example, would validate a swing high only when a high is larger than that of the 3 bars to the left and right of it, making it much more selective.
In any case, we can simply track the most recent swing highs and lows and check for when price through them. Enabling the Show Pivots option will mark all the swing highs and lows that are being considered for future structure breaks.
If the trend is bearish and we begin closing over swing highs, that would mark a Market Structure Shift (MSS). If the trend is already bullish and we are closing over swing highs, that would mark a Break of Structure (BOS), and vice versa for bearish conditions. MSS essentially signifies reversals in Market Structure while BOS signifies continuations.
Users may also create alerts for Any/Bull/Bear BOS or MSS. Simply create a new alert, select this indicator, and select the desired BOS or MSS criteria.
ICT Concepts [LuxAlgo]The ICT Concepts indicator regroups core concepts highlighted by trader and educator "The Inner Circle Trader" (ICT) into an all-in-one toolkit. Features include Market Structure (MSS & BOS), Order Blocks, Imbalances, Buyside/Sellside Liquidity, Displacements, ICT Killzones, and New Week/Day Opening Gaps.
🔶 SETTINGS
🔹 Mode
When Present is selected, only data of the latest 500 bars are used/visualized, except for NWOG/NDOG
🔹 Market Structure
Enable/disable Market Structure.
Length: will set the lookback period/sensitivity.
In Present Mode only the latest Market Structure trend will be shown, while in Historical Mode, previous trends will be shown as well:
You can toggle MSS/BOS separately and change the colors:
🔹 Displacement
Enable/disable Displacement.
🔹 Volume Imbalance
Enable/disable Volume Imbalance.
# Visible VI's: sets the amount of visible Volume Imbalances (max 100), color setting is placed at the side.
🔹 Order Blocks
Enable/disable Order Blocks.
Swing Lookback: Lookback period used for the detection of the swing points used to create order blocks.
Show Last Bullish OB: Number of the most recent bullish order/breaker blocks to display on the chart.
Show Last Bearish OB: Number of the most recent bearish order/breaker blocks to display on the chart.
Color settings.
Show Historical Polarity Changes: Allows users to see labels indicating where a swing high/low previously occurred within a breaker block.
Use Candle Body: Allows users to use candle bodies as order block areas instead of the full candle range.
Change in Order Blocks style:
🔹 Liquidity
Enable/disable Liquidity.
Margin: sets the sensitivity, 2 points are fairly equal when:
'point 1' < 'point 2' + (10 bar Average True Range / (10 / margin)) and
'point 1' > 'point 2' - (10 bar Average True Range / (10 / margin))
# Visible Liq. boxes: sets the amount of visible Liquidity boxes (max 50), this amount is for Sellside and Buyside boxes separately.
Colour settings.
Change in Liquidity style:
🔹 Fair Value Gaps
Enable/disable FVG's.
Balance Price Range: this is the overlap of latest bullish and bearish Fair Value Gaps.
By disabling Balance Price Range only FVGs will be shown.
Options: Choose whether you wish to see FVG or Implied Fair Value Gaps (this will impact Balance Price Range as well)
# Visible FVG's: sets the amount of visible FVG's (max 20, in the same direction).
Color settings.
Change in FVG style:
🔹 NWOG/NDOG
Enable/disable NWOG; color settings; amount of NWOG shown (max 50).
Enable/disable NDOG ; color settings; amount of NDOG shown (max 50).
🔹 Fibonacci
This tool connects the 2 most recent bullish/bearish (if applicable) features of your choice, provided they are enabled.
3 examples (FVG, BPR, OB):
Extend lines -> Enabled (example OB):
🔹 Killzones
Enable/disable all or the ones you need.
Time settings are coded in the corresponding time zones.
🔶 USAGE
By default, the indicator displays each feature relevant to the most recent price variations in order to avoid clutter on the chart & to provide a very similar experience to how a user would contruct ICT Concepts by hand.
Users can use the historical mode in the settings to see historical market structure/imbalances. The ICT Concepts indicator has various use cases, below we outline many examples of how a trader could find usage of the features together.
In the above image we can see price took out Sellside liquidity, filled two bearish FVGs, a market structure shift, which then led to a clean retest of a bullish FVG as a clean setup to target the order block above.
Price then fills the OB which creates a breaker level as seen in yellow.
Broken OBs can be useful for a trader using the ICT Concepts indicator as it marks a level where orders have now been filled, indicating a solidified level that has proved itself as an area of liquidity. In the image above we can see a trade setup using a broken bearish OB as a potential entry level.
We can see the New Week Opening Gap (NWOG) above was an optimal level to target considering price may tend to fill / react off of these levels according to ICT.
In the next image above, we have another example of various use cases where the ICT Concepts indicator hypothetically allow traders to find key levels & find optimal entry points using market structure.
In the image above we can see a bearish Market Structure Shift (MSS) is confirmed, indicating a potential trade setup for targeting the Balanced Price Range imbalance (BPR) below with a stop loss above the buyside liquidity.
Although what we are demonstrating here is a hindsight example, it shows the potential usage this toolkit gives you for creating trading plans based on ICT Concepts.
Same chart but playing out the history further we can see directly after price came down to the Sellside liquidity & swept below it...
Then by enabling IFVGs in the settings, we can see the IFVG retests alongside the Sellside & Buyside liquidity acting in confluence.
Which allows us to see a great bullish structure in the market with various key levels for potential entries.
Here we can see a potential bullish setup as price has taken out a previous Sellside liquidity zone and is now retesting a NWOG + Volume Imbalance.
Users also have the option to display Fibonacci retracements based on market structure, order blocks, and imbalance areas, which can help place limit/stop orders more effectively as well as finding optimal points of interest beyond what the primary ICT Concepts features can generate for a trader.
In the above image we can see the Fibonacci extension was selected to be based on the NWOG giving us some upside levels above the buyside liquidity.
🔶 DETAILS
Each feature within the ICT Concepts indicator is described in the sub sections below.
🔹 Market Structure
Market structure labels are constructed from price breaking a prior swing point. This allows a user to determine the current market trend based on the price action.
There are two types of Market Structure labels included:
Market Structure Shift (MSS)
Break Of Structure (BOS)
A MSS occurs when price breaks a swing low in an uptrend or a swing high in a downtrend, highlighting a potential reversal. This is often labeled as "CHoCH", but ICT specifies it as MSS.
On the other hand, BOS labels occur when price breaks a swing high in an uptrend or a swing low in a downtrend. The occurrence of these particular swing points is caused by retracements (inducements) that highlights liquidity hunting in lower timeframes.
🔹 Order Blocks
More significant market participants (institutions) with the ability of placing large orders in the market will generally place a sequence of individual trades spread out in time. This is referred as executing what is called a "meta-order".
Order blocks highlight the area where potential meta-orders are executed. Bullish order blocks are located near local bottoms in an uptrend while bearish order blocks are located near local tops in a downtrend.
When price mitigates (breaks out) an order block, a breaker block is confirmed. We can eventually expect price to trade back to this breaker block offering a new trade opportunity.
🔹 Buyside & Sellside Liquidity
Buyside / Sellside liquidity levels highlight price levels where market participants might place limit/stop orders.
Buyside liquidity levels will regroup the stoploss orders of short traders as well as limit orders of long traders, while Sellside liquidity levels will regroup the stoploss orders of long traders as well as limit orders of short traders.
These levels can play different roles. More informed market participants might view these levels as source of liquidity, and once liquidity over a specific level is reduced it will be found in another area.
🔹 Imbalances
Imbalances highlight disparities between the bid/ask, these can also be defined as inefficiencies, which would suggest that not all available information is reflected by the price and would as such provide potential trading opportunities.
It is common for price to "rebalance" and seek to come back to a previous imbalance area.
ICT highlights multiple imbalance formations:
Fair Value Gaps: A three candle formation where the candle shadows adjacent to the central candle do not overlap, this highlights a gap area.
Implied Fair Value Gaps: Unlike the fair value gap the implied fair value gap has candle shadows adjacent to the central candle overlapping. The gap area is constructed from the average between the respective shadow and the nearest extremity of their candle body.
Balanced Price Range: Balanced price ranges occur when a fair value gap overlaps a previous fair value gap, with the overlapping area resulting in the imbalance area.
Volume Imbalance: Volume imbalances highlight gaps between the opening price and closing price with existing trading activity (the low/high overlap the previous high/low).
Opening Gap: Unlike volume imbalances opening gaps highlight areas with no trading activity. The low/high does not reach previous high/low, highlighting a "void" area.
🔹 Displacement
Displacements are scenarios where price forms successive candles of the same sentiment (bullish/bearish) with large bodies and short shadows.
These can more technically be identified by positive auto correlation (a close to open change is more likely to be followed by a change of the same sign) as well as volatility clustering (large changes are followed by large changes).
Displacements can be the cause for the formation of imbalances as well as market structure, these can be caused by the full execution of a meta order.
🔹 Kill Zones
Killzones represent different time intervals that aims at offering optimal trade entries. Killzones include:
- New York Killzone (7:9 ET)
- London Open Killzone (2:5 ET)
- London Close Killzone (10:12 ET)
- Asian Killzone (20:00 ET)
🔶 Conclusion & Supplementary Material
This script aims to emulate how a trader would draw each of the covered features on their chart in the most precise representation to how it's actually taught by ICT directly.
There are many parallels between ICT Concepts and Smart Money Concepts that we released in 2022 which has a more general & simpler usage:
ICT Concepts, however, is more specifically aligned toward the community's interpretation of how to analyze price 'based on ICT', rather than displaying features to have a more classic interpretation for a technical analyst.

Fsystem Pivot 1453 ScreenerHello,
This script provides scanning for our pivot 1453 script and should be used together.
I will try to explain the content with pictures.
Merhaba,
bu scriptimiz ,pivot 1453 scriptimiz için tarama yapılmasını sağlar ve beraber kullanılmalıdır.
sizlere içeriği resimler ile anlatmaya çalışacam.
Status column :
this column indicates that you are
from the Bear or Bull area at the last bar,
bear-positive bear appeared in the field,
bull -negative indicates that the bull is out of the field.
----------------
Durum Kolonu :
Bu kolon son barda Ayı veya Boğa alanda oldugunu ifade eder,
bear-positive ayı alandan çıktıgını,
bull -negative boğa alandan çıktığını ifade eder.
how bar ago column :
Indicates how many bars ago
the bull or bear crossed the area.
---------------------------------------
how bar ago kolonu :
boğa veya ayı alana kaç bar önce geçtiğini belirtir.
Level 1 distance column:
your last price
It is the percentage distance from the first pivot line that occurs when the Bull or Bear enters the field.
It gives information about how much the price has gained according to the 1st pivot and adds the color expression according to the current area.
-------------------------------------------
Level 1 distance kolonu :
son fiyatın
Boğa veya Ayı alana girdiğinde olusan ilk pivot çizgisine yüzdelik olarak uzaklığıdır.
1.pivota göre fiyat nekadar değer kazanmış bilgisini verir ve şu andaki alana göre renk ifadesinide katar.
which level column :
It gives information about the level of the price and colors it according to the relevant level.
----------------------------------------
which level kolonu :
fiyatın hangi seviyede oldugunun bilgisini verir ve ilgili seviyesine göre renklendirir.
Bottom distance column:
It gives the percentage distance
of the last price from the Support line.
-------------------------------------------------
Bottom distance kolonu :
Son fiyatın Destek çizgisine
yüzdelik uzaklığı bilgisini verir.
top distance column:
It gives the distance of the last price
from the peak, that is, to the resistance
point, as a percentage.
-------------------------------
top distance kolonu :
son fiyatın tepe yani direnç noktasına
uzaklığını yüzdelik olarak verir.
level up jump column :
If the price has closed on the line upwards
at the last bar and has passed to the
other level region, it gives information
about this.
-------------------------------------------
Level up jump kolonu :
eğer fiyat son barda yukarı doğru ,
çizgi üzerinde kapanış yapmış ve
diğer seviye bolgesine geçmiş ise
bunun bilgisini verir.
ema 60 and ema 360 column:
Returns the value of ema.
If the price is lower than the
relevant ema, it is turned
to a green ground if it is above red.
-----------------------------------
ema 60 ve ema 360 kolonu :
ema nın değerini verir.
eğer fiyat ilgili ema dan aşağı
ise kırmızı üstü ise yeşil zemine çevirilir.
Level Supp--Resis column:
gives the value of the top
resistance and the value of
the bottom support.
---------------------------
Level Supp--Resis kolonu :
tepe direncin değerini ve
dip desteğin değerini verir.
From the settings option of the script, you can narrow the result area by converting currency,
choosing a period, selecting a share, scanning another stock set and filtering integrated into the columns.
---------------------------------------------------------------------------------------------------------------------------------
scriptin ayarlar seçeneğinden ,para birimi çevirme ,periyot seçme,hisse seçme ,başka hisse seti tarama ve kolonlara entegreli filtreleme yaparak sonuç alanını daraltabilirsiniz.

ViVen - EXP - Signals with AlertsHi Friends,
Here the trading made easy with Signals...
The main purpose of this indicator is to identify the Support and Resistance levels well in advance to make ourselves ready for the Entries with confidence..
With this indicator we will be able to identify the Market Structure and Trend to initiate our trades.
Multi Timeframe Concepts are considered in some cases to capture the Golden Zones.
Details of the Indicator:
Method of Trading – Intraday, Positional or Swing – Indices, Stocks and Commodity Markets
Golden Zones : When two or more indicator levels are confluences at one price point which will act as Strong Support and Resistance in the Market. That is called Golden Zone.
CPR & Pivot (Daily / Weekly / Monthly) – Based on the previous Timeframe values, it will automatically calculates the Support and Resistance values for the upcoming Sessions.
BUY / SELL Levels (W-Refers the Weekly levels) – Possible Reversal in the market we can expect at this price level. Depends on the Time frame (Daily/Weekly)
Bull BO / Bear BO (W-Refers the Weekly levels) – Possible Breakout level, If breakout happens price will move to reach the Target 1 and 2 Points based on which side the price breaks ( BULLISH / BEARISH ). We can initiate our BUY/SELL Entries.
Target 1 & Target 2 – Once the Price breaks the Breakout (Bull BO / Bear BO) levels, it will try to reach the Target Points where we can book our profits.
Tomorrow Levels - This will help us to enable the next day trading session Support and Resistance Levels in advance to do pre-analysis to prepare for the Entry and Exits.
Colored Candles : Lime Green and Violet colored candles will indicate the Possible Trend Reversals.
Triangles : Orange and Violet triangles will indicate the Confirmation of Trend Reversal.
BUY / SELL Signal – Considering the momentum and the Trend change it will suggest the possible entry time.
Dashboard :
1. Weekly Trend : This will indicate how the current week trend is going to be – Trending / Sideways
2. Today – Current Session expectation in the Market ( Bullish / Bearish )
3. Sentiment – Indicates the Traders mind set (Positive/Negative Side)
4. Range - This will indicate how the current Day trend is going to be – Trending / Sideways
5. MB / MA Trend – This identifies the major trend (Is the Stock / script in Up Trend or Down Trend)
6. Other Parameters – Will indicates the present situation in the market
7. RSI Values – This is to know and understand the momentum of the particular script
Levels Name Explanations:
1. DPP – Daily Pivot Point
2. WPP – Weekly Pivot Point
3. WTC – Weekly Top Central Pivot
4. WBC – Weekly Bottom Central Pivot
5. PDH – Previous Day High
6. PDL – Previous Day Low
7. PWH – Previous Week High
8. PWL – Previous Week Low
9. PMH – Previous Month High
10. PML - Previous Month Low
11. WR1, WR2 – Weekly Resistance Levels 1 & 2
12. WS1, WS2 – Weekly Support 1 & 2
13. 5m 200 EMA – 5 Minutes 200 Period Exponential Moving Average
14. 15m 200 EMA – 15 Minutes 200 Period Exponential Moving Average
15. 1H 200 EMA – 1 Hour 200 Period Exponential Moving Average
16. 1H 200 SMA – 1 Hour 100 Period Simple Moving Average
17. 1D 200 EMA – Daily TF 100 Period Exponential Moving Average
Settings:
To turn ON and OFF any of these levels if it does not require, Go to Indicator Settings and disable the specific levels.
Alerts:
You can enable the Buy / Sell signal Alerts by creating new alert.
To Access the Indicator:
If you want to know more about the indicator & to access for your trading please check the link in the signature below.
If you have any doubts please mention it in the comment section.
Looking forward your valuable comments and feedbacks to improve further in accuracy of our Trading.
Thanks!!

Sonarlab - SMC Multi Timeframe add-onThe SMC HTF Indicator is an add-on for the original SMC Indicator . This add-on will show you multi timeframe Internal structure points, swing structure points and POI's. This will make it easier for you to do your multi timeframe analyses to speed up the process and save you chart work.
Main features:
- POI's
- Structure points (Swing and Internal)
- Trading panel (based on structure breaks)
Setting overview
Higher timeframe structure
Select timeframe {turn on/ off} / {amount to show}
Internal structure {turn on/ off} / {amount to show}
Swing structure {turn on/ off} / {amount to show}
POI {turn on/ off} / {amount to show}
OB Mitigation {wick/ close}
Alerts
Bullish/ bearish POI
Bullish/ bearish BOS
Bullish/ bearish CHoCH
Swing Bullish/ bearish BOS
Swing Bullish/ bearish CHoCH
Second higher timeframe structure
Select timeframe {turn on/ off} / {amount to show}
Internal structure {turn on/ off} / {amount to show}
Swing structure {turn on/ off} / {amount to show}
POI {turn on/ off} / {amount to show}
OB Mitigation {wick/ close}
Alerts
Bullish/ bearish POI
Bullish/ bearish BOS
Bullish/ bearish CHoCH
Swing Bullish/ bearish BOS
Swing Bullish/ bearish CHoCH
Trading panel
Styling options

TopTenAlgo 2. HFT Algo for CryptoEN: High Frequency Trade Algo TVQ is an advanced algorithmic system developed using Volume Weighted / Exponential Moving Averages, vWap and Ichimoku . Said indicators are re-blended with the Volume Weighted Average ( vWap ) algorithm used by Merryl Lynch or Yapıkredi algorithms. It does not act like the classic Ichimoku or Moving Averages. TVQ was used instead of RSI . High Frequency Trade Algo's incorporate a 3-sided trading strategy that detects Risk Areas and allows you to stay Flat if necessary (red and white circles above the bars) or generates appropriate signals in the buy and sell regions, that measures the risk. In the triangle or flat / horizontal corrections you need to stay flat, it warns you beforehand that you are in the risky area, while the trend will occur, it warns you with a buy or sell signal.
This algorithm is prepared with @Top10Algo ... Optimization Risky and Wait Zone
TR: High Frequency Trade Algo TVQ, Hacim Ağırlıklı/Exponential Hareketli Ortalamalar, vWap ve Ichimoku kullanarak geliştirilen gelişmiş bir algoritmik sistemdir. Bahsi geçen göstergeler Merryl Lynch yada Yapıkredi algoritmalarının kullandığı Volume Weighted Average ( vWap ) algoritması ile yeniden harmanlanmıştır. Klasik Ichimoku yada Hareketli Ortalamalar gibi hareket etmez. RSI yerine TVQ kullanılmıştır. High Frequency Trade Algo’ lar Riskli Bölgeleri tespit edip gerekirse Flat kalmanızı sağlayan(barların üstündeki kırmızı ve beyaz daireler) yada alım ve satım bölgelerinde uygun sinyaller üreten yani riski ölçen 3 taraflı bir trading stratejisini içinde barındırır. Flat kalmanız gereken üçgen yada yassı/yatay düzeltmelerde sizi riskli bölgede olduğunuz konusunda önceden uyarırken, trend oluşacağı zamanda al yada sat sinyali ile önceden uyarır.
Bu algoritma @Top10Algo ile beraber hazırlanmıştır...Riskli ve Bekleme yapılan Flat bölgelerle ile ilgili iyileştirmeler yapıldı...
MyMA + FIBOThis script combines 6 Moving Averages (MAs) with 3 Donchian Channel 78.6% and 21.4% intermediary level lines to perform trade analysis. The 6 MAs (I, II, III , IV, V and VI ) default lengths come from one of the Fibonacci Phi^3 and Phi^3/2 sub series (17, 34, 72, 144, 305 and 610), but can be changed to any values, particularly to the traditionally used 20, 40, 50, 100, 200 and 300. Up to my knowledge, Fibonacci Phi^3 and Phi^3/2 sub series lengths were first proposed by Bo Williams.
The used Moving Averages can be chosen between EMA and MyMA. MyMA is a Moving Average that tries to mimic Bo William's MIMA. Due to the close resemblance between MyMA and MIMA, I do not feel comfortable to open this script source code. In order to learn how this script operates with EMAs, please refer to my Custom EMA + Fibo indicator that has its source code open.
The 3 Donchian Channels used have default lengths 72, 305 and 1292, calculated after the first length default value of 72. For each of the 3 Donchian Channels only an upper line, set by default at 78.6%, is plotted in green and its complement, set to 21.4%, is plotted in red. When the closing price is above 3 green lines, we say it is Forbidden to Sell ( PV ), and when the closing price is below 3 red lines, we say it is Forbidden to Buy ( PC ). Those conditions are flagged on the chart. These PV-PC conditions were, up to my knowledge, first proposed by Bo Williams.
This script also includes optional plot of the Giant MAs to help detecting old Resistance and Support lines when the price seems to be doing new historical highs and lows, respectively. These Giant lines have length greater than 1000.
This script also include the indication of the MA Fans. Those fans are formed when 6 Phi^3/2 distant MAs are ordered, for instance, we say there is EMA Fan 610 if close > EMA 17 > EMA 34 > EMA 72 > EMA 144 > EMA 305 > EMA 610. As far as I know, this concept of EMA Fan was first proposed by Bo Williams.
SMC Market Structure with EMA Confirmation and Prepare EntryDewaSMC v1 — Smart Market Structure with Prepare Entry & EMA Confirmation
DewaSMC v1 is a technical analysis indicator based on market structure concepts, designed to help traders visually analyze price behavior in a structured and objective way. This indicator focuses on identifying structural changes in the market and highlighting areas of interest where price reactions may occur.
It is intended as an analytical support tool, not as an automated trading system or a signal service
🔹 Key Features
1. Market Structure Detection (BOS & CHoCH)
• Identifies Break of Structure (BOS) and Change of Character (CHoCH) using swing high and swing low analysis.
• Break confirmation can be configured to use candle body or wick.
• Structure levels are visualized with lines and clear BOS / CHoCH labels directly on the chart.
2. Prepare Entry Zones
• Displays prepare entry zones when price approaches an important structure level but has not yet confirmed a break.
• These zones help users monitor potential setups without entering prematurely.
• Prepare zones are temporary and automatically disappear after a defined number of bars or once a structure break occurs.
3. EMA Confirmation Filter
• Uses short-term and long-term EMAs as directional filters.
• Optional confirmation modes:
o Price relative to EMA
o EMA alignment (short EMA above/below long EMA)
• This filter is designed to reduce counter-structure or counter-trend scenarios.
4. Volatility-Based Target Projection
• After a confirmed structure break, the indicator projects:
o Entry level
o Stop Loss level
o Multiple target levels (TP1, TP2, TP3)
• Targets are calculated using ATR-based volatility logic, allowing adaptability to different market conditions.
• Risk and reward areas are displayed as visual zones for clarity.
5. Trade Information Table
• A real-time information table summarizes key analytical data, including:
o Structural direction
o Entry level
o Stop Loss
o Target levels
o EMA confirmation status
o Estimated Risk-to-Reward ratio
• Table position is fully customizable on the chart.
6. Trend Visualization
• Candles can be colored based on current market structure direction.
• EMAs are plotted as additional trend references.
⚙️ Customizable Settings
• Structure detection period
• Break confirmation type (Body or Wick)
• Enable / disable:
o Prepare Entry zones
o EMA confirmation
o Trade information table
o Trend-based candle coloring
• Visual customization options for colors and layout
📌 Important Notes
• This indicator does not provide financial advice and does not guarantee any specific outcome.
• It should be used in combination with:
o Personal risk management rules
o Additional technical or contextual analysis
• All trading decisions remain the responsibility of the user.
🎯 Suitable For
• Traders studying market structure or Smart Money–style concepts
• Manual analysis on various instruments and timeframes
• Users seeking a structured and visual approach to price analysis
