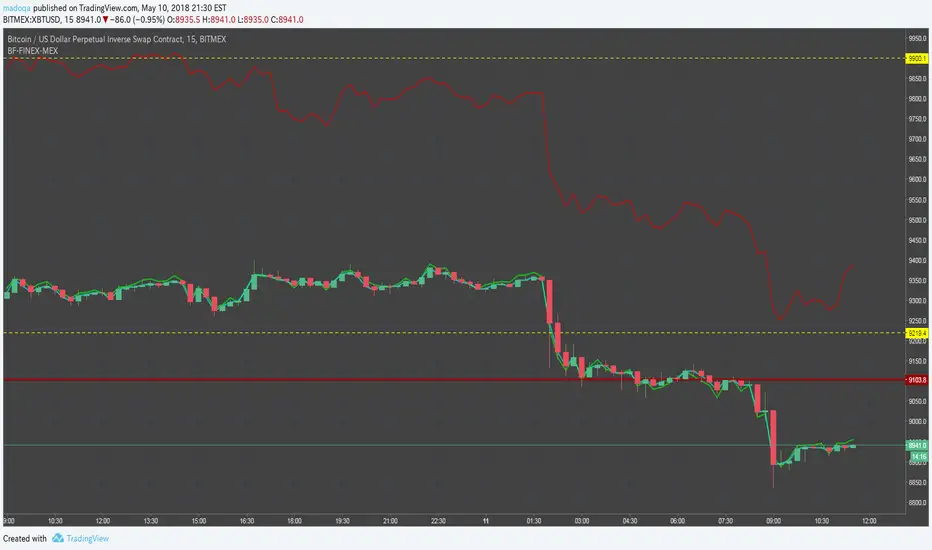
BTC Traffic LightsTracks BTC price of various exchanges across several time frames
Time frames:
1 minute
5 minutes
15 minutes
30 minutes
1 hour
4 hour
8 hour
1 day
8 red lights: dump incoming
8 green lights: pump incoming
Поиск скриптов по запросу "BTC"


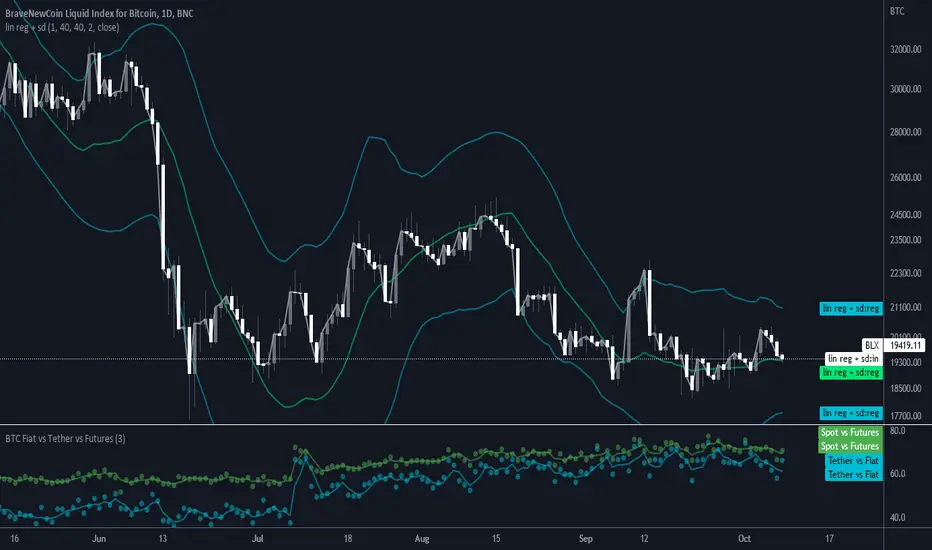
BTC Volume Fiat vs Tether vs FuturesFutures = BYBIT+ BITMEX
Fiat = KRAKEN + BITSTAMP + BITFLYER + COINBASE
Tether = HITBTC + HUOBI + BINANCE + BITFINEX
Spot = Fiat + Tether
Tether vs Fiat = 100 * Tether / (Tether + Fiat)
Spot vs Futures = 100 * Spot / (Spot + Futures)
BTC Dominance Infused MACD & MTF EMAsTwo unique views of the market that show you what BTC is really doing.

BTC 1D Alerts V1This script contains a variety of key indicator for bitcoin all-in-one and they can be activated individually in the menu. These are meant to be used on the 1D chart for Bitcoin.
1457 Day Moving Average: the bottom of the bitcoin price and arguably the rock bottom price target.
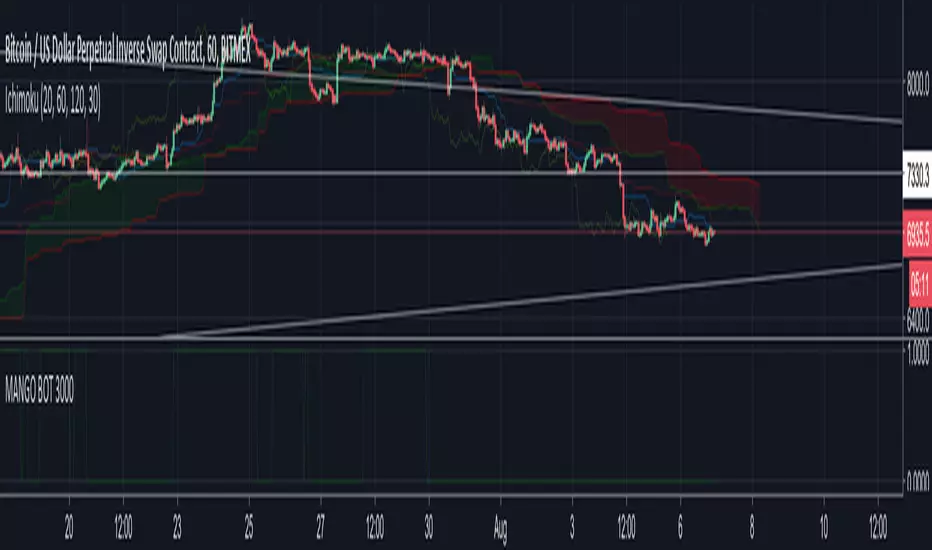
Ichimoku Cloud: a common useful indicator for bitcoin support and resistance.
350ma fibs (21 8 5 3 2 and 1.6) : Signify the tops of each logarthmic rise in bitcoin price. They are generally curving higher over the long term. For halvening #3, the predicted market crash would be after hitting the 350ma x3 fib. Also the 350 ma / 111 ma cross signifies bull market top within about 3 days as well. Using the combination of the 350ma fibs and the 350/111 crosses, reasonably identify when market top is about to occur.
50,120,200 ma: Common moving averages that bitcoin retests during bull market runs. Also, the 50/200 golden and death crosses.
1D EMA Superguppy Ribbons: green = bull market, gray is indeterminate, red = bear market. Very high specificity indicator of bull runs, especially for bitcoin. You can change to 3D candle for even more specificity for a bull market start. Use the 1W for even more specificity. 1D Superguppy is recommended for decisionmaking.
1W EMA21: a very good moving average programmed to be shown on both the daily and weekly candle time. Bitcoin commonly corrects to this repeatedly during past bull runs. Acts as support during bull run and resistance during a bear market.
Steps to identifying a bull market:
1. 50/200 golden cross
2. 1D EMA superguppy green
3. 3D EMA superguppy green (if you prefer more certainty than step 2).
4. Hitting the 1W EMA21 and bouncing off during the bull run signifies corrections.
Once a bull market is identified,
Additional recommended buying and selling techniques:
Indicators:
- Fiblines - to determine retracements from peaks (such as all time high or recent highs)
- Stochastic RSI - 1d, 3d, and 1W SRSI are great time to buy, especially the 1W SRSI which comes much less frequently.
- volumen consolidado - for multi exchange volumes compiled into a single line. I prefer buying on the lowest volume days which generally coincide with dips.
- MACD - somewhat dubious utility but many algorithms are programmed to buy or sell based on this.
Check out the Alerts for golden crosses and 350ma Fib crosses which are invaluable for long term buying planning.
I left this open source so that all the formulas can be understood and verified. Much of it hacked together from other sources but all indicators that are fundamental to bitcoin. I apologize in advance for not attributing all the articles and references... but then again I am making no money off of this anyway.

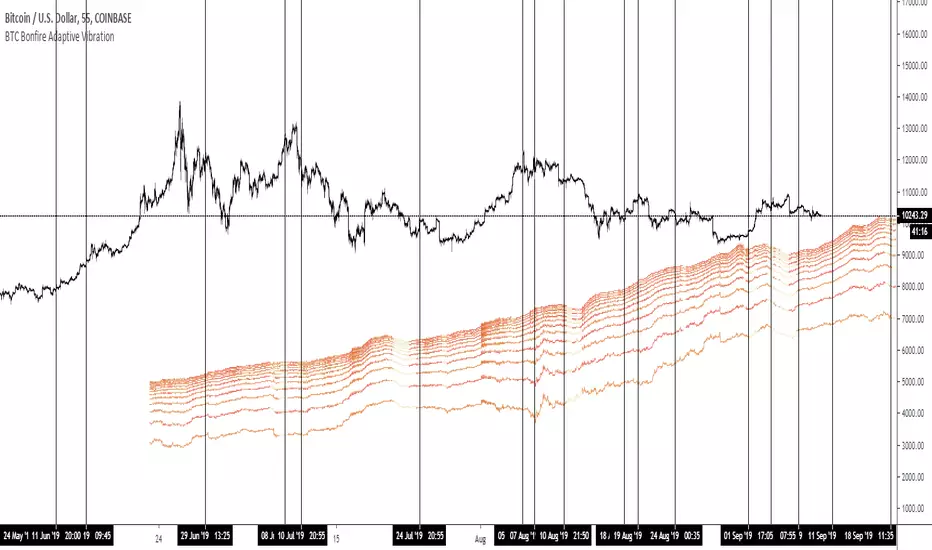
BTC Bonfire Adaptive Vibration*So far mainly tested on BTC
Gives forecasted pivots and trends
Adapts to current Algo
Shows seismic activity with waves oscillating ( neg - , pos +) for big moves and pattern data.
Shows gaps in vibration (gravity ON/OFF)
Projects pivots with trends and outlying vibrations.
Price can follow trend lines, reject trendlines, counter and or use them for support resistance at different levels.
BTC IronBank systemThe system analyzes and determines the price direction for the next couple hours or days. It trades only when there is a good entry point and exit the market when it is saturated, waiting for another good opportunity. With this strategy you will stack your Bitcoins flawlessly, respecting the good old "Buy Low-Sell High" plus our innovative reversal system alert, made to catch the very peak of each wave.
It works at its best on BTC/USD 4 hours timeframe.
Contact the author for permission.

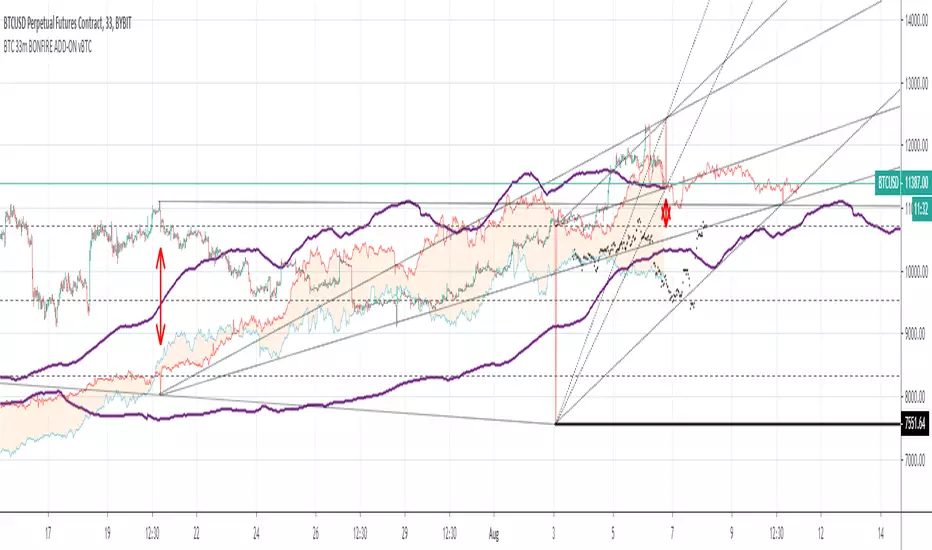
BTC 33m BONFIRE ADD-ON vBTCMade for BTC best on 33, very specific math on this as it holds a lot of prediction math and volatility
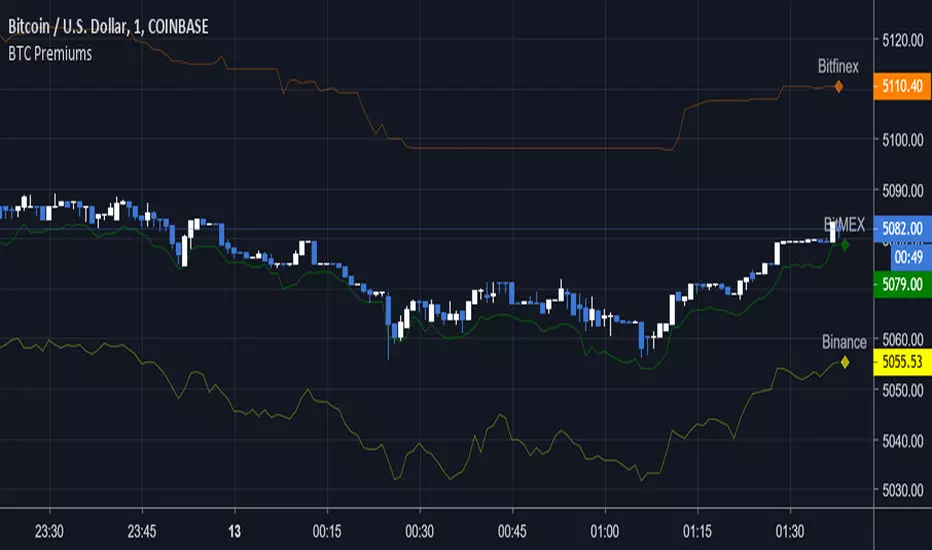
BTC Exchange PremiumIt shows BTC premium between BITFINEX and BITHUMB visually.
You can set the target percentage and more exchange would be added in next version.
Green color means BITHUMB > BITFINEX, and red color is opposite.
Thanks.

BTC SKVPrivate indicator,
I don't sell/rent indicators, i do it for myself and to share with the people I work with.
This indicator is a clone of @everget so i can't make it open source.
If you would like to get it, you can buy it =>
Trust me it can take many hours/days to make a indicator, this one in particulary will need some update in the futur, paid indicators with support can save you time & money.
Thanks to @everget for his idea, and aslo for all the free code that he share.
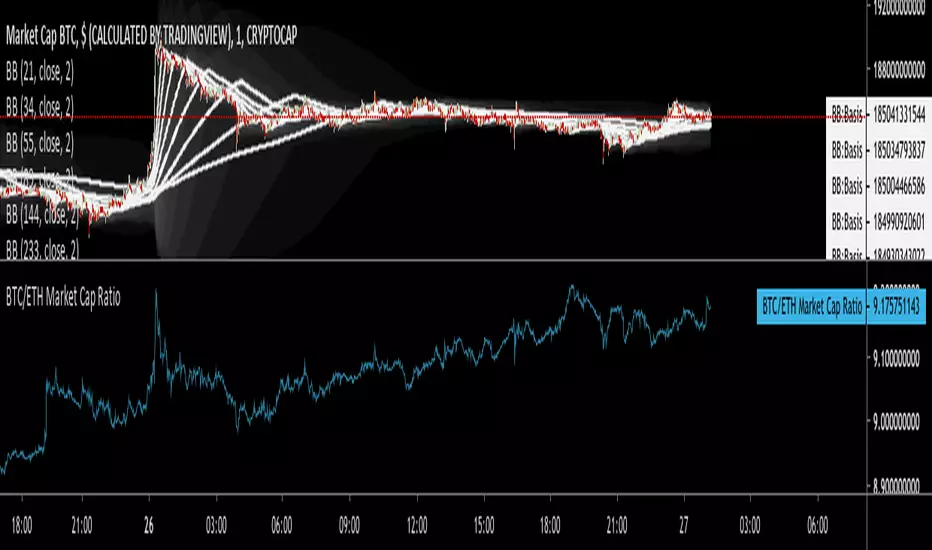
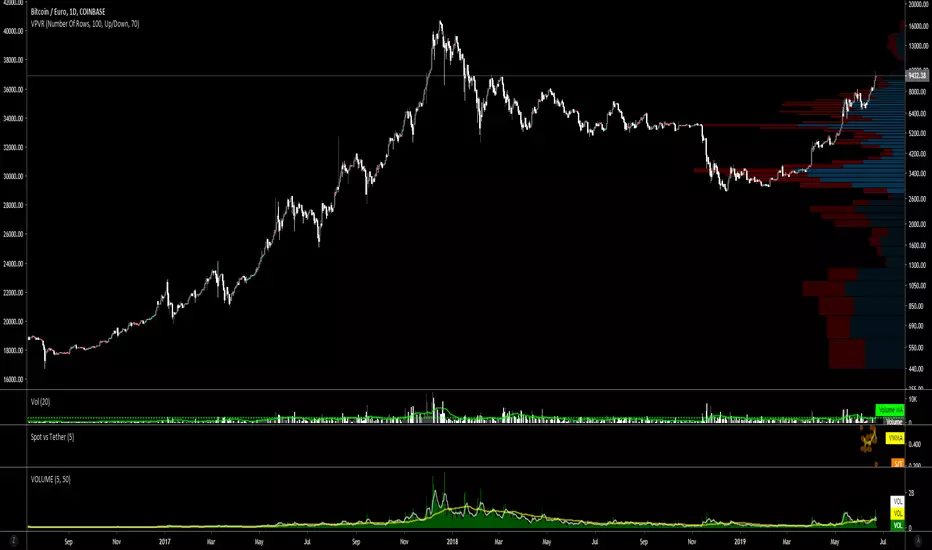
BTC Spot vs Tether Volumespot_volume / tether_volume
spot = Coinbase + bitFlyer + Kraken + Bitstamp
tether = Bitfinex + binance + Huobi + HitBTC

BTC Multi-Premiums — SharkCIAShows the price of BTC on multiple exchanges, helps to see which is leading in price and if the current price is above or below average.
For use on COINBASE:BTCUSD unless you customize it
To use on other platforms (Bitfinex, BitMEX, etc) go to options and enable "Show Coinbase" then hide whatever exchange you're currently on.
To disable exchanges, uncheck them under the Styles tab.

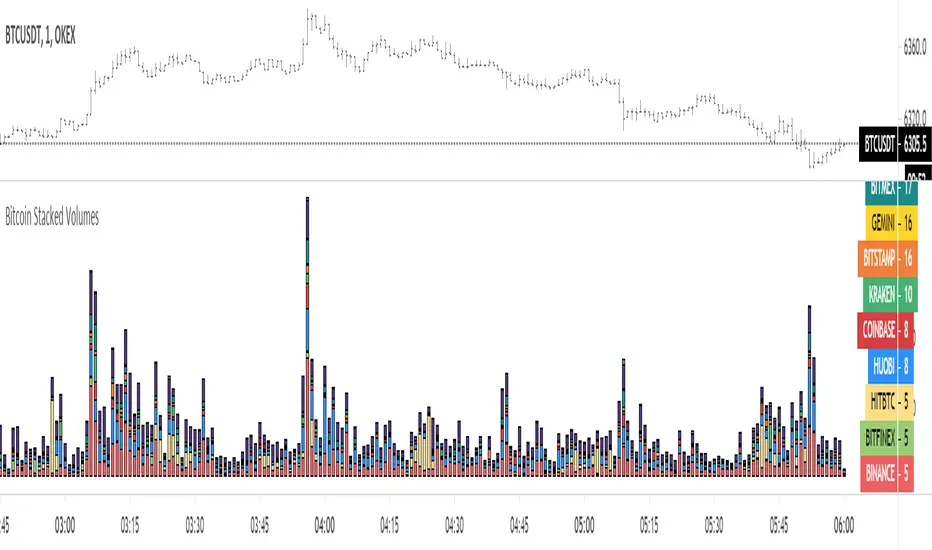
BTC Volume Stacked [v2018-11-17] @ LekkerCryptisch.nlCombine the volume of 8 BTCUSD(T) exchanges in one graph.
Two use cases:
1) Stack the absolute volume to see the combined volume in BTC over time.
2) Stack the relative volume to see the relative size of exchange change over time.


BTC/USD Margin Shorts and Long on BitfinexThis script denotes the condition of margin traders on Btifinex exchange.
- Yellow Crosses mean both shorts and longs are increasing market is getting volatile
- Gray Crosses means margin traders undecided on that candle
- Green Crosses mean longs are increasing and shorts are being pulled out
- Red Crosses mean Longs are being pulled out and shorts being put in
This is the script for BTC/USD margin longs and shorts
I hope you find this small script useful.
Have a great day!

BTC Weighted Composite IndexThis script was written to complement my custom built equal weighted btc composite indice:
type the following text as the symbol:
~~
(BITMEX:XBTUSD*42.74+BINANCE:BTCUSDT*31.41+BITFINEX:BTCUSD*23.47+COINBASE:BTCUSD*8.1+BITSTAMP:BTCUSD*8.2+KRAKEN:XBTUSD*3.9+POLONIEX:BTCUSDT*1.1+GEMINI:BTCUSD*2.8+BITTREX:BTCUSDT*1.1)/122.82
~~
by applying this script to the above symbol: it shows total volume, in $ amounts across the 9 exchanges.