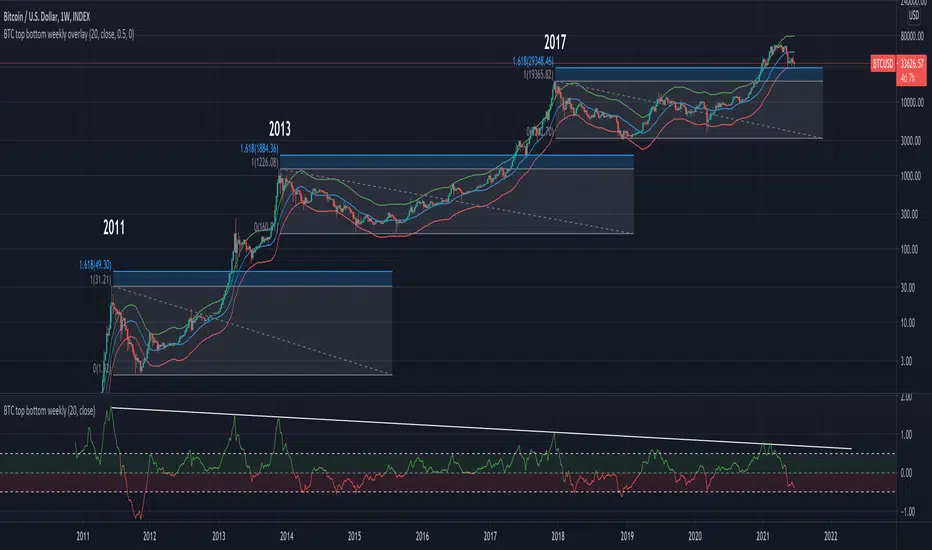
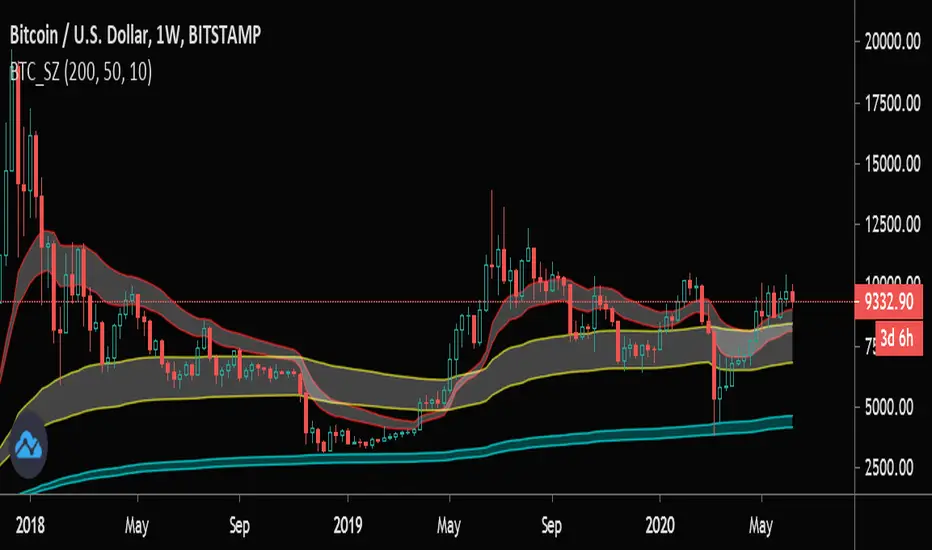
BTC top bottom weekly bandsThis indicator is based on the 20 weekly simple moving average and it could be used to help finding potential tops and bottoms on a weekly BTC chart.
When using the provided "coef" parameter set to the default of 0.5 it shows how most bottoms since 2013 have hit the lower band of this indicator.
The lower band is calculated as exp(coef) * sma(close)
Instructions:
- Use with the symbol INDEX:BTCUSD so you can see the price since 2010
- Set the timeframe to weekly
- Use logarithmic chart (toggle "log" on)
Optionals:
- change the coef to 0.6 for a more conservative bottom
- change the coef to 0.4 for a more conservative top
Поиск скриптов по запросу "BTC"
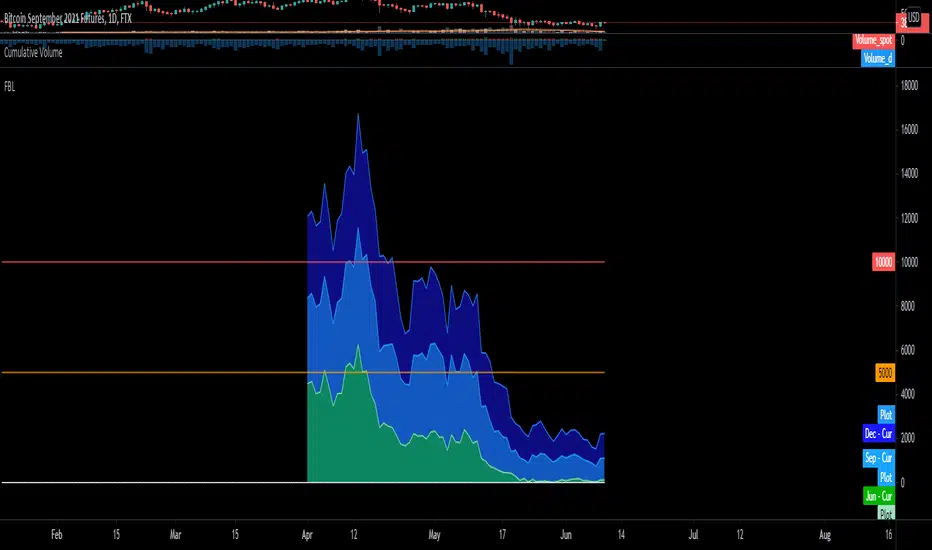
BTC FTX Futures PremiumsThis indicator shows the future BTC premiums on FTX.
The purple area is the Daily December Futures contract subtracted by the current price.
The blue area is the Daily September futures contract subtracted by the current price.
The green area is the Daily June futures contract subtracted by the current price.
You can use this to try and understand market sentiment.
If the current price dumps but the premium remains the same it likely means that sentiment is unchanged.
The opposite is true, if the price pumps and the premium is the same it means the market likely wasn't convinced by the movement.
The difference between the current price and the futures price can help determine how bullish or bearish a market or at extremes the level of euphoria.
BTC COT Delta BBitcoin CME COT Delta Strategy
---------------------------------------
Reading 4 largest long positions and 4 largest short positions, this script uses (shorts - longs) to produce a long/short signal.
• When delta <= buy threshold, a "long" signal will appear on the chart.
• When shorts >= sell threshold, a "short" signal will appear on the chart.
To see the indicator below, since it's not possible to mix the two, use this script:
** This is not a trading advice, it's for research purposes only. Do not trade based upon these signals.

BTC SWING ZONESHigh Time Frame EVWMA Envelopes for BTC spot. Should only be used on Weekly time frame and higher.
BTFD and Chill!

BTC Network VolumeThis script shows the BTC network volume. It can be used to help detect spikes and correlate them with price action.

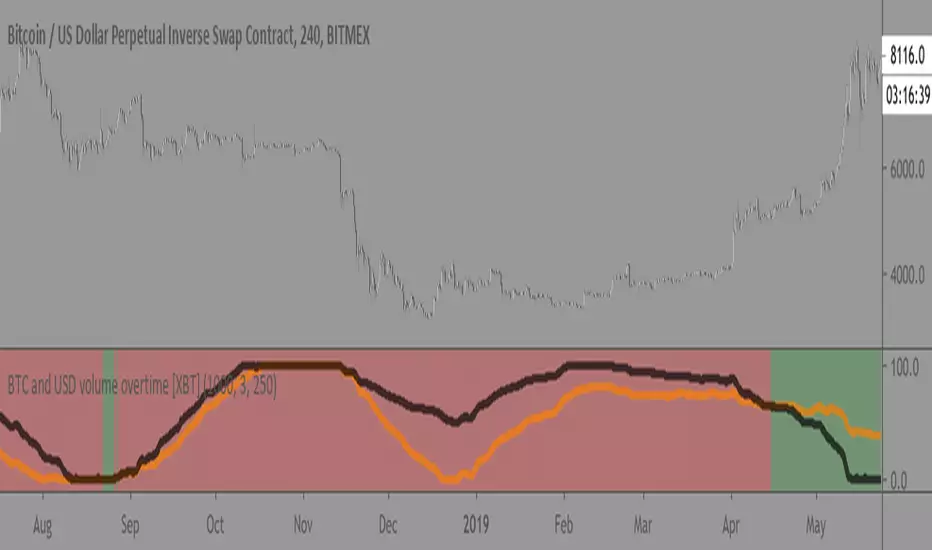
BTC and USD volume overtime [XBT]Compares BTC volume vs USD volume overtime
Best used on 4hr timeframe. Not really some crazy alpha but good overview/statistic to keep track of.
(make sure to use on XBTUSD pair since it isnt using security calls to call the data)
Enjoy!
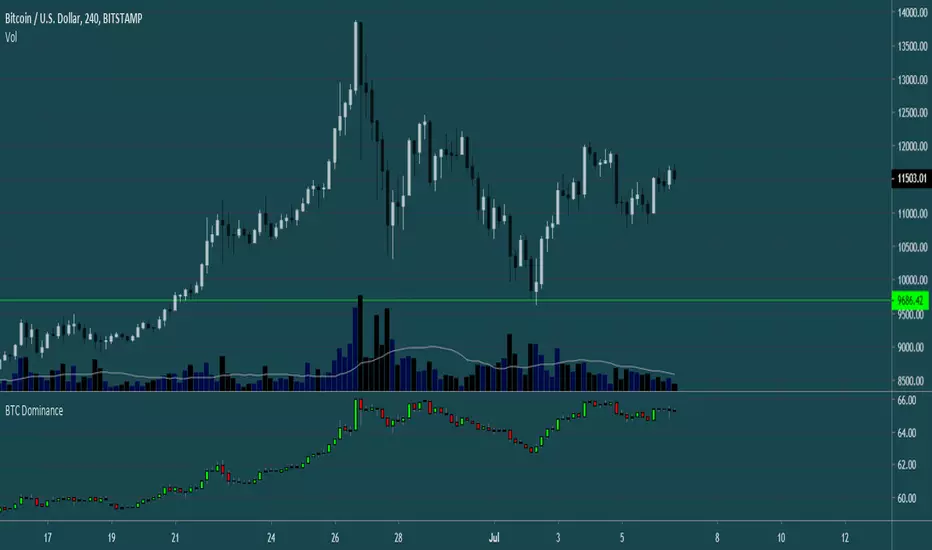
BTC DominanceThis Script plots the BTC Dominance chart in an indicator window, so you don't have to bother with tabs as much when doing your analysis.
tips are always welcome at: (38uGQJDDZDL6wX48x4gYTccPeQ3ZHVYmY4)
I hope you enjoy the script :)
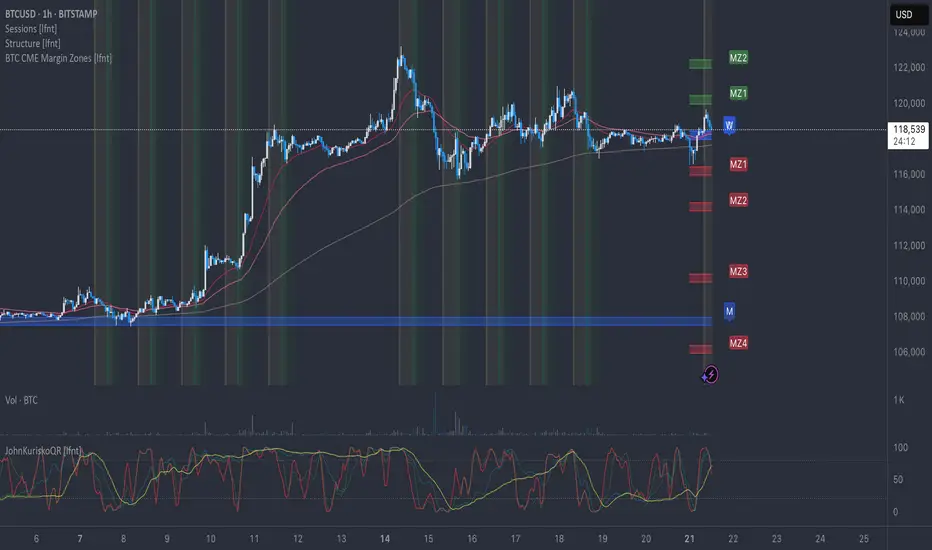
BTC CME Margin Zones [lfnt]This script calculates specific price zones based on the
- daily, weekly and monthly open and the
- daily maintenance margins of CME BTC futures contracts.
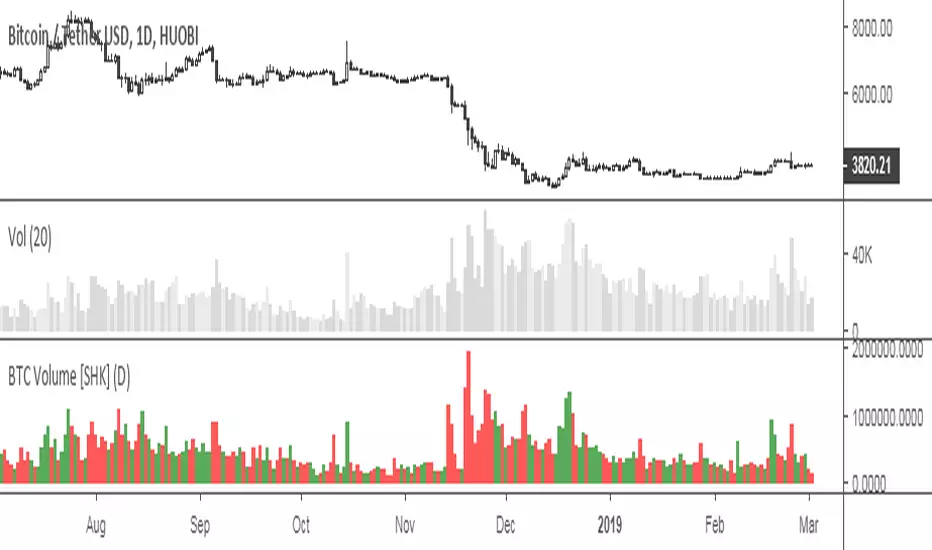
BTC Average Volume (Multi Exchange)Multi-Exchange BTC Volume: Bitfinex, Bitmex, Bitstamp, Binance, and Coinbase are included for now.

BTC exchange trade vol / on-chain transaction volThis Bitcoin indicator shows the percentage that the exchange traded volume is from the sum of the exchange traded volume + on-chain transaction volume.
The thin red line is the non-smoothed value calculated from daily volumes.
The thick black line is the 7-day EMA-smoothed value.
The exchange traded volume and the on-chain transaction volume are reported by Quandl and have a 1D resolution - so it is best to use this indicator on the daily time frame.
When the value is high, it shows the the interest of traders is high and they are intensely trading BTC. When the indicator is low, it means that BTC is "dormant": it is used for transfers, but not so much for trading - traders forgot about it for a while - which may be a good time to accumulate if the economy is in a general bull market.

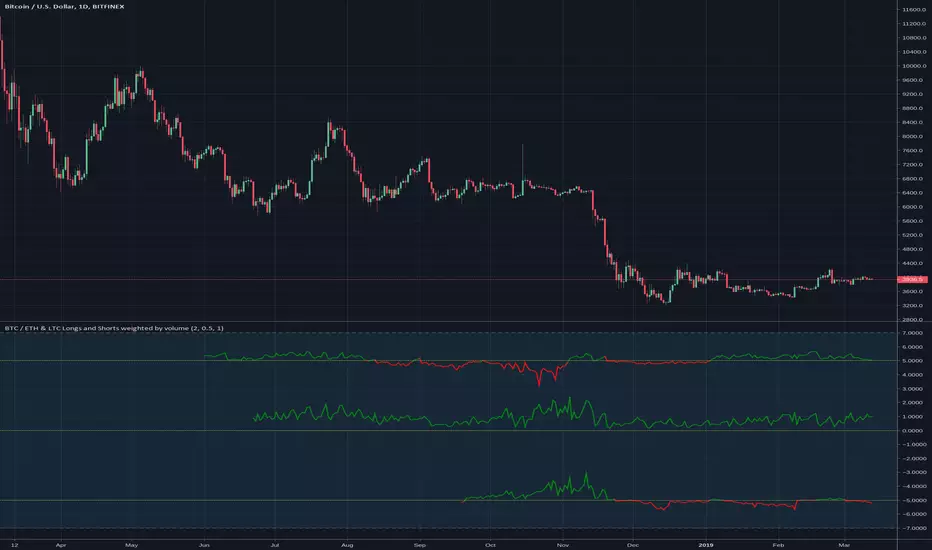
BTC / ETH & LTC Longs and Shorts weighted by volumeMy personal crypto market breadth.
The long and short contract come from Bitfinex, the daily volume for weighting is used from four different exchanges to average the result.
A line above the center line means more open long contracts (green) than open short contracts (red).
The upper indicator shows BTC ratio, the middle one ETH and the lower one LTC.
BTC Aggregate USD Volumeaggregated USD volume of BTC from Bittrex, Poloniex, OkCoin, Gemini, Binance, Bitstamp, Kraken, Bitfinex, Bitmex (leveraged), and Coinbase

BTC ETH RatioBTCUSD / ETHUSD Ratio.
You might find patterns when to move from BTC to ETH and vice versa.
# Open Source
The code is open source @ github.com and uses the commonpine library github.com

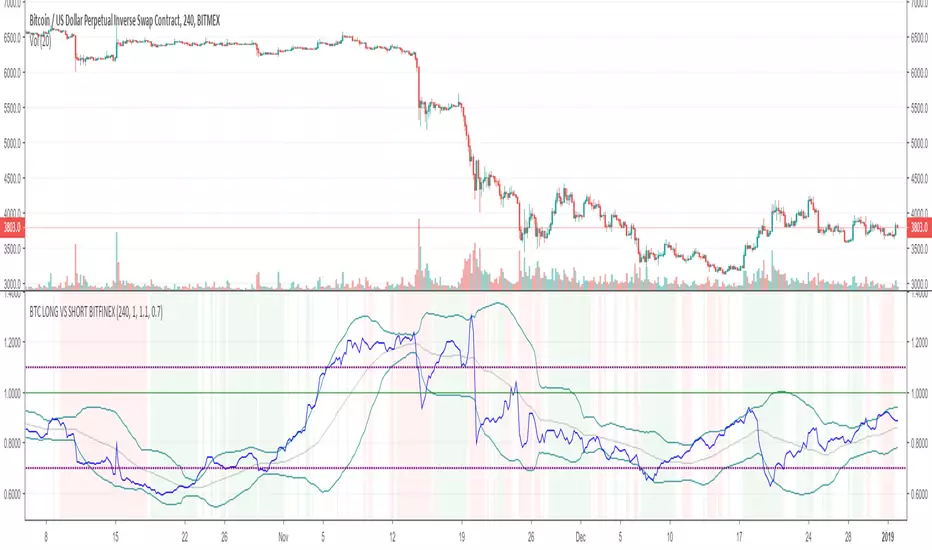
BTC LONGS VS SHORTS (With Demand of USDT)General idea is like this:
Go long when RULE 1 and RULE 2 are true:
RULE 1 - when USDT is in high demand (background is green)
RULE 2 - when Longs/Shorts is just recovered from Lower Bollinger Band
go short when the opposite is true.
you should also be careful and be prepared for a rise / fall when is below / above the purple dotted lines
you may want to ignore RULE1 since Bitmex doesn't use USDT to trade
This seems to work for the recent bear market while prices is driven largely by BTC margin or futures trading.
The rationale is that when a lot of people go short, the whales or the exchanges (who are of course unethical) will try to do the opposite to liquidate the accounts of retail traders.
BTC LONGS VS SHORTS (With Demand of USDT)General idea is like this:
go long when RULE 1 and RULE 2 are true:
RULE 1 - when USDT is in high demand (background is green)
RULE 2 - when Longs/Shorts is just recovered from Lower Bollinger Band
go short when the opposite is true.
This seems to work for the recent bear market while prices is driven largely by BTC margin or futures trading.
The rationale is that when a lot of people go short, the whales or the exchanges (who are of course unethical) will try to do the opposite to liquidate the accounts of retail traders.

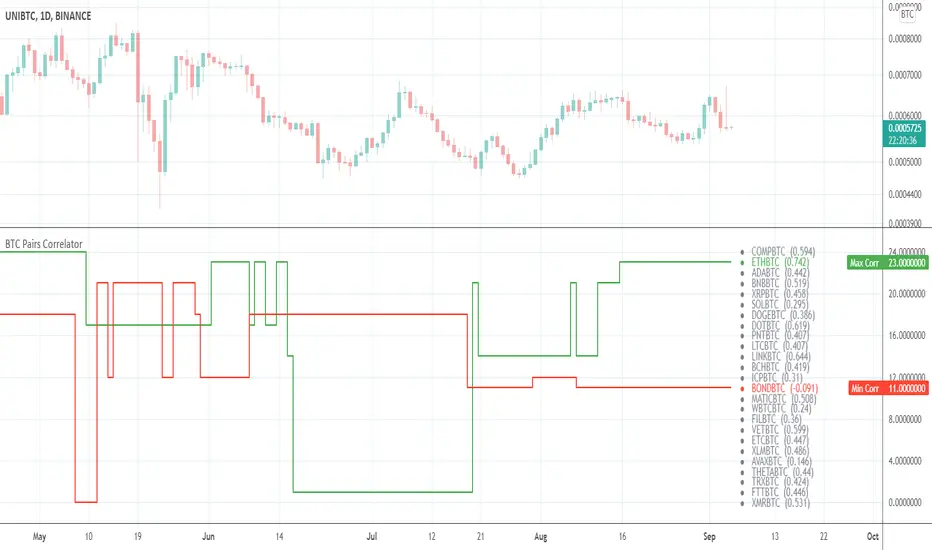
BTC Pairs CorrelatorHey there!
This tool helps to identify the best positive and negative correlated pairs from 38 */BTC cryptocurrency pairs.
By default it will find the best correlations for your current ticker.
If you are a newbie in Correlation Analysis you can find a brief explanation here .
Settings
Lookback for correlations (default: 14 )
Option to use or not to use current ticker (default: true )
You can switch to a custom ticker (default: BTCUSDT )
Choose as many pairs as you want from 38 available pairs.
Available pairs
ADABTC
BATBTC
BCDBTC
BCHBTC
BCNBTC
BNBBTC
BSVBTC
BTGBTC
DASHBTC
DCRBTC
DGBBTC
DOGEBTC
EOSBTC
ETCBTC
ETHBTC
LSKBTC
LTCBTC
IOTABTC
MKRBTC
NANOBTC
NEOBTC
OMGBTC
ONTBTC
PAXBTC
QTMBTC
TRXBTC
TUSDBTC
USDCBTC
VETBTC
WAVESBTC
XEMBTC
XLMBTC
XMRBTC
XRPBTC
XTZBTC
ZECBTC
ZILBTC
ZRXBTC
Good luck!
BTC Exchanges Volume [SHK]Useful script to calculate sum of BTC ( Bitcoin ) volumes on different exchanges.
Supported Exchanges:
Coinbase
Bitfinex
Bitmex
Houbi
CEX
Bitstamp
Binance
BitFlyer
Poloniex
Bittrex
Flyer
OkEx
Poloniex
Gemini
HitBTC
VolumeChart BTC Volume Powered by BotBoys [v09/11/2018]Btc global volume by volumeChart team (BotBoys).
Takes volumes of all exchanges with BTC.
It includes Europe, EEUU, Asia and South-America.

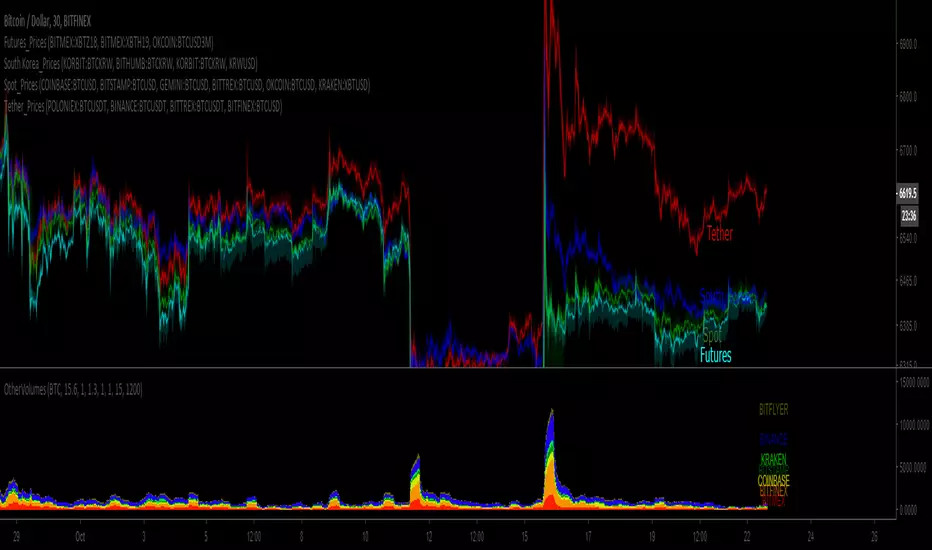
BTC South Korea_PricesSince BTC prices are diverging, this set of 4 indicators charts volume-weighted prices for different exchanges:
Spot, Tether, Futures and South Korea.
I tried doing EUR & JPY, but the divergence is minimal so its a little pointless.
Here is the 4 links:

BTC Futures_PricesSince BTC prices are diverging, this set of 4 indicators charts volume-weighted prices for different exchanges:
Spot, Tether, Futures and South Korea.
I tried doing EUR & JPY, but the divergence is minimal so its a little pointless.
Here is the 4 links:

BTC Spot_PricesSince BTC prices are diverging, this set of 4 indicators charts volume-weighted prices for different exchanges:
Spot, Tether, Futures and South Korea.
I tried doing EUR & JPY, but the divergence is minimal so its a little pointless.
Here is the 4 links: