J12Matic Builder by galgoomA flexible Renko/tick strategy that lets you choose between two entry engines (Multi-Source 3-way or QBand+Moneyball), with a unified trailing/TP exit engine, NY-time trading windows with auto-flatten, daily profit/loss and trade-count limits (HALT mode), and clean webhook routing using {{strategy.order.alert_message}}.
Highlights
Two entry engines
Multi-Source (3): up to three long/short sources with Single / Dual / Triple logic and optional lookback.
QBand + Moneyball: Gate → Trigger workflow with timing windows, OR/AND trigger modes, per-window caps, optional same-bar fire.
Unified exit engine: Trailing by Bricks or Ticks, plus optional static TP/SL.
Session control (NY time): Evening / Overnight / NY Session windows; auto-flatten at end of any enabled window.
Day controls: Profit/Loss (USD) and Trade-count limits. When hit, strategy HALTS new entries, shows an on-chart label/background.
Alert routing designed for webhooks: Every order sets alert_message= so you can run alerts with:
Condition: this strategy
Notify on: Order fills only
Message: {{strategy.order.alert_message}}
Default JSONs or Custom payloads: If a Custom field is blank, a sensible default JSON is sent. Fill a field to override.
How to set up alerts (the 15-second version)
Create a TradingView alert with this strategy as Condition.
Notify on: Order fills only.
Message: {{strategy.order.alert_message}} (exactly).
If you want your own payloads, paste them into Inputs → 08) Custom Alert Payloads.
Leave blank → the strategy sends a default JSON.
Fill in → your text is sent as-is.
Note: Anything you type into the alert dialog’s Message box is ignored except the {{strategy.order.alert_message}} token, which forwards the payload supplied by the strategy at order time.
Publishing notes / best practices
Renko users: Make sure “Renko Brick Size” in Inputs matches your chart’s brick size exactly.
Ticks vs Bricks: Exit distances switch instantly when you toggle Exit Units.
Same-bar flips: If enabled, a new opposite signal will first close the open trade (with its exit payload), then enter the new side.
HALT mode: When day profit/loss limit or trade-count limit triggers, new entries are blocked for the rest of the session day. You’ll see a label and a soft background tint.
Session end flatten: Auto-closes positions at window ends; these exits use the “End of Session Window Exit” payload.
Bar magnifier: Strategy is configured for on-close execution; you can enable Bar Magnifier in Properties if needed.
Default JSONs (used when a Custom field is empty)
Open: {"event":"open","side":"long|short","symbol":""}
Close: {"event":"close","side":"long|short|flat","reason":"tp|sl|flip|session|limit_profit|limit_loss","symbol":""}
You can paste any text/JSON into the Custom fields; it will be forwarded as-is when that event occurs.
Input sections — user guide
01) Entries & Signals
Entry Logic: Choose Multi-Source (3) or QBand + Moneyball (pick one).
Enable Long/Short Signals: Master on/off switches for entering long/short.
Flip on opposite signal: If enabled, a new opposite signal will close the current position first, then open the other side.
Signal Logic (Multi-Source):
Single: any 1 of the 3 sources > 0
Dual: Source1 AND Source2 > 0
Triple (default): 1 AND 2 AND 3 > 0
Long/Short Signal Sources 1–3: Provide up to three series (often indicators). A positive value (> 0) is treated as a “pulse”.
Use Lookback: Keeps a source “true” for N bars after it pulses (helps catch late triggers).
Long/Short Lookback (bars): How many bars to remember that pulse.
01b) QBands + Moneyball (Gate -> Trigger)
Allow same-bar Gate->Trigger: If ON, a trigger can fire on the same bar as the gate pulse.
Trigger must fire within N bars after Gate: Size of the gate window (in bars).
Max signals per window (0 = unlimited): Cap the number of entries allowed while a gate window is open.
Buy/Sell Source 1 – Gate: Gate pulse sources that open the buy/sell window (often a regime/zone, e.g., QBands bull/bear).
Trigger Pulse Mode (Buy/Sell): How to detect a trigger pulse from the trigger sources (Change / Appear / Rise>0 / Fall<0).
Trigger A/B sources + Extend Bars: Primary/secondary triggers plus optional extension to persist their pulse for N bars.
Trigger Mode: Pick S2 only, S3 only, S2 OR S3, or S2 AND S3. AND mode remembers both pulses inside the window before firing.
02) Exit Units (Trailing/TP)
Exit Units: Choose Bricks (Renko) or Ticks. All distances below switch accordingly.
03) Tick-based Trailing / Stops (active when Exit Units = Ticks)
Initial SL (ticks): Starting stop distance from entry.
Start Trailing After (ticks): Start trailing once price moves this far in your favor.
Trailing Distance (ticks): Offset of the trailing stop from peak/trough once trailing begins.
Take Profit (ticks): Optional static TP distance.
Stop Loss (ticks): Optional static SL distance (overrides trailing if enabled).
04) Brick-based Trailing / Stops (active when Exit Units = Bricks)
Renko Brick Size: Must match your chart’s brick size.
Initial SL / Start Trailing After / Trailing Distance (bricks): Same definitions as tick mode, measured in bricks.
Take Profit / Stop Loss (bricks): Optional static distances.
05) TP / SL Switch
Enable Static Take Profit: If ON, closes the trade at the fixed TP distance.
Enable Static Stop Loss (Overrides Trailing): If ON, trailing is disabled and a fixed SL is used.
06) Trading Windows (NY time)
Use Trading Windows: Master toggle for all windows.
Evening / Overnight / NY Session: Define each session in NY time.
Flatten at End of : Auto-close any open position when a window ends (sends the Session Exit payload).
07) Day Controls & Limits
Enable Profit Limits / Profit Limit (Dollars): When daily net PnL ≥ limit → auto-flatten and HALT.
Enable Loss Limits / Loss Limit (Dollars): When daily net PnL ≤ −limit → auto-flatten and HALT.
Enable Trade Count Limits / Number of Trades Allowed: After N entries, HALT new entries (does not auto-flatten).
On-chart HUD: A label and soft background tint appear when HALTED; a compact status table shows Day PnL, trade count, and mode.
08) Custom Alert Payloads (used as strategy.order.alert_message)
Long/Short Entry: Payload sent on entries (if blank, a default open JSON is sent).
Regular Long/Short Exit: Payload sent on closes from SL/TP/flip (if blank, a default close JSON is sent).
End of Session Window Exit: Payload sent when any enabled window ends and positions are flattened.
Profit/Loss/Trade Limit Close: Payload sent when daily profit/loss limit causes auto-flatten.
Tip: Any tokens you include here are forwarded “as is”. If your downstream expects variables, do the substitution on the receiver side.
Known limitations
No bracket orders from Pine: This strategy doesn’t create OCO/attached brackets on the broker; it simulates exits with strategy logic and forwards your payloads for external automation.
alert_message is per order only: Alerts fire on order events. General status pings aren’t sent unless you wire a separate indicator/alert.
Renko specifics: Backtests on synthetic Renko can differ from live execution. Always forward-test on your instrument and settings.
Quick checklist before you publish
✅ Brick size in Inputs matches your Renko chart
✅ Exit Units set to Bricks or Ticks as you intend
✅ Day limits/Windows toggled as you want
✅ Custom payloads filled (or leave blank to use defaults)
✅ Your alert uses Order fills only + {{strategy.order.alert_message}}
Поиск скриптов по запросу "Candlestick"

ORB FVG Strategy with telegram V6.1Summary
Intraday NY-session strategy with Opening-Range bias (09:30–10:00 NY), FVG entries (incl. optional HTF FVGs), momentum filters (LinReg slope & Williams %R), limit entries inside the zone, SL from FVG anchors, and TP via risk-reward. Includes session/trade caps, pending-order handling, auto-cancel at NY time, and optional Telegram webhook alerts.
Feature Overview
Opening Range & Bias: OR high/low built until 10:00 NY, then frozen. Bias from confirmed 5-minute candles (modes: Body Close, Complete Candle, Wick Only).
FVG Scanner: Bull/bear FVGs (choose wick or body gaps), min size, auto-extend, mitigation cleanup (touch or 50%).
HTF FVG (10 min): Optional – displayed after ≥ 2 consecutive FVGs; cleans up on touch/50%.
Entry/SL/TP: Entry at X% fill (+extra %) within the FVG; SL from FVG candle / FVG-1 / FVG-2 (smart) + buffer; TP via risk-reward.
Momentum Filters: LinReg slope (MLL) + Williams %R with threshold/slope filters (individually switchable).
Intrabar Mode (optional): Immediate Open/intrabar entry on touch (calc_on_every_tick=true) or classic bar-close confirmation (toggle).
Trade Management: Max trades/day, pending cap, auto-cancel at defined NY time, pause after first winner (optional).
Telegram: Programmatic alerts via alert() with Telegram-ready JSON payload.
Parameters (compact)
Group Parameter Purpose
Sessions Trading session, Opening range Trading/OR window (internal NY TZ)
Bias Body Close / Complete Candle / Wick Only Bias confirmation relative to OR
Liquidity LQ session, lookback days, cleanup points, show lines Intraday liquidity marks & cleanup
FVG Min size, wick/body, colors, extend, cleanup Detection/visualization & validity
HTF FVG (10 m) Toggle/Display/Colors Conservative HTF filter/POI
Entry Fill %, extra %, max pending, validity (bars), cancel time, intrabar switch Execution timing, order caps, auto-cancel
Stop Loss Source: Candle / -1 / -2 (smart), buffer (points) SL anchor from FVG history + safety offset
Take Profit Risk-Reward (R:R) Target calculation
Momentum LinReg length/min slope, W%R length/min slope, HUD Trend/momentum filters
Trade Mgmt Max trades/day, pause after win Daily cap / risk cooldown
Telegram Enabled, tester, interval, channel id Webhook output & test signals
Debug & Info Debug panel, rejection reasons On-chart status/diagnostics
Alerts / Telegram Webhook (Quick Setup)
Create an alert with Condition: “Any alert() function call”.
Webhook URL: api.telegram.org
Message: leave empty (the strategy provides JSON via alert() – includes chat_id, parse_mode, text).
Ensure your bot can post to the channel and the chat_id is valid.
Repainting & Backtesting
HTF series via lookahead_off on closed higher-TF candles; FVG detection on confirmed bars (barstate.isconfirmed).
Intrabar/Open entries allow earlier fills but typically cause differences between backtest and live (tick granularity/slippage, limit touch on bar OHLC).
For reproducibility, trade without intrabar (bar-close only).
Limitations
No full tick simulation; limit fills rely on bar OHLC.
Liquidity “cleanup” is rule-based (not an orderbook).
Telegram depends on correct webhook configuration.
Tips
Timeframes: M5 (intrabar)
Start with modest R:R (e.g., 1.5–2.0) and tune filters carefully.
Disclaimer
No financial advice. Past results do not guarantee future performance. Use responsibly and follow Public Library rules.
License / Credits
© 2025 Lean Trading (Lennart Pomreinke). License: MPL-2.0.
Changelog
V06.1: Intrabar switch (Open/intrabar vs bar-close), Telegram sanitizer & tester, HTF-FVG cleanup, refined pending/cancel logic, debug panel (status & rejections).

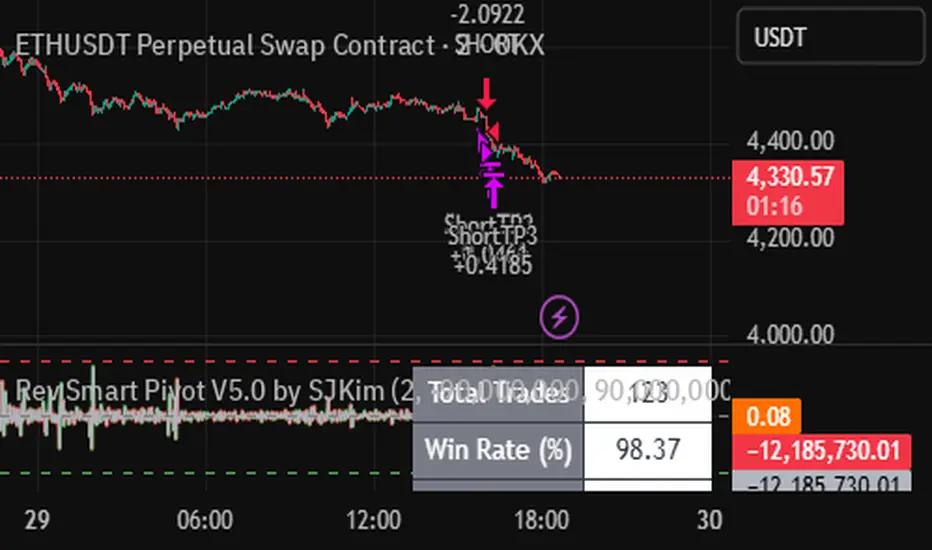
Nor Smart Pivot V5.0 by SJKimNor Smart Pivot V5.0 by SJKim.
Nor Smart Pivot V5.0 by SJKim.
Nor Smart Pivot V5.0 by SJKim.
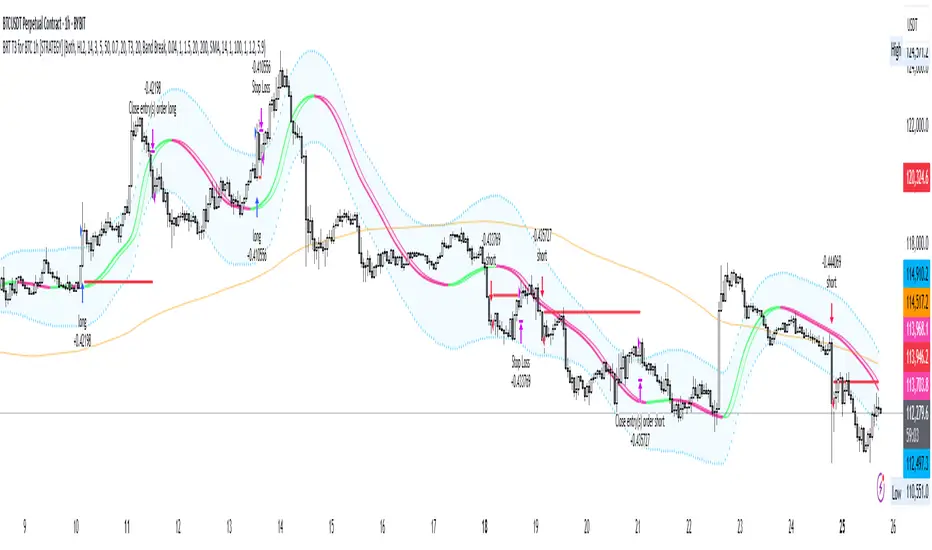
BRT T3 for BTC 1h [STRATEGY]## 📊 BRT T3 Adaptive Strategy for BTC 1H
STRATEGY DESCRIPTION
Professional trading strategy based on the adaptive T3 (Tillson T3) indicator with dynamic length controlled by the Relative Strength Index (RSI) . The strategy is specifically designed for Bitcoin trading on the hourly timeframe and includes a comprehensive filter system to minimize false signals.
═════════════════════════════════════════
🔥 UNIQUE CODE FEATURES
1. RSI-Adaptive Architecture:
• Innovative Approach: Unlike standard MA strategies with fixed periods, our code dynamically adjusts the moving average length based on RSI
• Smart Formula: len = minLen + (maxLen - minLen) * (1 - RSI/100) - automatically accelerates response in extreme zones
• Result: Strategy adapts to market conditions without manual reconfiguration
2. Modified Ichimoku Cloud:
• Unique Calculation: Instead of classic high/low, uses ATR-based method
• Dynamic Levels: Cloud is built based on volatility, not fixed periods
• Advantage: More accurate trend determination in highly volatile cryptocurrency markets
3. Hybrid Signal System:
• Dual-mode Generation: Switch between classic MA crossovers and volatility band breakouts
• Multi-stage Confirmation: Optional signal verification across N forward bars
• Effect: 40-60% reduction in false signals compared to simple MA strategies
4. All-in-One Solution:
• 8 MA Types in One Code: The only strategy on TradingView with complete implementation of T3, EMA, SMA, WMA, VWMA, HMA, RMA, DEMA
• Custom Functions: All MAs calculated through custom functions supporting series int
• Versatility: One code replaces 8 different strategies
5. Intelligent Filtering:
Combination of 4 independent filters:
├── Volume Filter (dynamic multiplier)
├── Trend Filter (adaptive period)
├── ATR Filter (volatility)
└── Ichimoku Filter (cloud trend)
• Unique Logic: Each filter can work independently or in combination
• Master Switch: Single control for all filters
6. Advanced Risk Management:
• Smart Stops: SL/TP levels are stored in variables and not recalculated on every bar
• Slippage Protection: Checks both close and high/low for stop triggers
• Visualization: Dynamic display of levels only for active positions
7. Performance Optimization:
• Efficient Loops: Minimized calculations through intermediate result storage
• Conditional Visualization: Element rendering only when necessary
• Clean Code: Structured organization with clear logical block separation
═════════════════════════════════════════
💎 TECHNICAL INNOVATIONS
Adaptation Algorithm (exclusive development):
// Dynamic length based on RSI
rsi_scale = 1.0 - rsi / 100.0
len_adaptive = minLen + (maxLen - minLen) * rsi_scale
ATR-based Ichimoku (unique modification):
// Instead of classic (highest + lowest) / 2
// Using ATR for dynamic levels
upper := close < upper ? min(hl2 + atr*mult, upper ) : hl2 + atr*mult
lower := close > lower ? max(hl2 - atr*mult, lower ) : hl2 - atr*mult
Multi-MA Architecture (complete implementation):
• Each MA type has its own optimized function
• Support for series int for dynamic length
• Unified selection interface via switch statement
═════════════════════════════════════════
🎯 KEY FEATURES
• Adaptive System: Moving average length automatically adjusts based on RSI, providing quick response in trending movements and stability in sideways markets
• 8 Moving Average Types: T3, EMA, SMA, WMA, VWMA, HMA, RMA, DEMA - ability to choose the optimal type for different market conditions
• Multi-level Filtering:
- Volume Filter - signal confirmation with increased activity
- Trend Filter - trading in the direction of the main trend
- ATR Filter - accounting for market volatility
- Ichimoku Cloud - additional trend direction confirmation
• Professional Risk Management: Customizable stop-loss and take-profit levels
═════════════════════════════════════════
⚙️ HOW IT WORKS
1. Signal Generation:
• Original Mode: Classic MA crossover signals with lagged version
• Band Break Mode: Volatility band breakouts (based on standard deviation)
2. RSI Adaptation:
• High RSI (overbought) → uses short MA length for quick response
• Low RSI (oversold) → uses long MA for noise smoothing
• Adaptation range is configured by Min/Max length parameters
3. Filter System:
• Each filter can be enabled/disabled independently
• Signal is generated only when passing all active filters
• Ichimoku filter blocks counter-trend trades
═════════════════════════════════════════
📈 STRATEGY PARAMETERS
Main Settings:
• Strategy Type: Long Only / Short Only / Both
• Data Source: Close, Open, High, Low, HL2, HLC3, OHLC4
RSI Settings:
• RSI Length: Calculation period (default 14)
• RSI Smoothing: Smoothing to reduce noise
T3/MA Settings:
• Min/Max Length: Adaptive length range (5-50)
• Volume Factor: T3 smoothing coefficient (0.7)
• MA Type: Moving average type selection
Filters:
• Volume Filter: Volume multiplier (1.5x average)
• Trend Filter: Trend MA period (200)
• ATR Filter: Minimum volatility for entry
• Ichimoku Filter: Cloud for trend determination
Risk Management:
• Stop Loss: Percentage from entry price (1.2%)
• Take Profit: Percentage from entry price (5.9%)
• Position Size: 50,000 USDT (effective leverage 5x)
═════════════════════════════════════════
💡 USAGE RECOMMENDATIONS
Optimal Conditions:
• Timeframe: 1H (developed and optimized)
• Instrument: BTC/USDT and other liquid cryptocurrencies
• Market Conditions: Trending and moderately volatile markets
Customize to Your Style:
1. Conservative: Increase signal confirmation period, enable all filters
2. Aggressive: Reduce filters, use Band Break mode
3. Scalping: Decrease Min/Max length, disable trend filter
═════════════════════════════════════════
📊 VISUALIZATION
Strategy displays:
• Main MA Line - changes color depending on direction
• Lag Line - for visualizing crossover moment
• Volatility Bands - upper and lower boundaries
• Trend MA - orange line (200 periods)
• SL/TP Levels - red and green lines for open positions
═════════════════════════════════════════
🔔 ALERTS
Strategy supports alert configuration for:
• Long position entry signals
• Short position entry signals
• Position exit signals
• Ichimoku line crossings
═════════════════════════════════════════
⚠️ RISK WARNING
IMPORTANT NOTICE: Trading in financial markets involves substantial risk of capital loss. Past performance presented in this strategy is based solely on historical data and under no circumstances constitutes a guarantee of future returns.
The strategy author is not responsible for:
• Any direct or indirect financial losses resulting from the use of this strategy
• Trading decisions made based on strategy signals
• Interpretation of backtesting results as a forecast of future performance
This strategy is provided exclusively for educational and research purposes. Backtesting results are affected by numerous factors including but not limited to: slippage, spread, commissions, market liquidity, and technical failures.
Before using the strategy in live trading:
• Conduct your own testing on a demo account
• Ensure understanding of all parameters and logic
• Only use funds you can afford to lose
• Consider consulting with a qualified financial advisor
DISCLAIMER: By using this strategy, you acknowledge and accept all risks associated with financial market trading and confirm that the author does not provide investment advice and bears no fiduciary responsibility to users.
═════════════════════════════════════════
🛠 TECHNICAL SUPPORT
For questions about setup and optimization:
• Leave comments under the publication
• Follow strategy updates
• Study the code for deep understanding of logic
═════════════════════════════════════════
📝 VERSION AND UPDATES
Version: 1.0.0
Pine Script: v6
Last Updated: 2025
Changelog:
• Added support for 8 MA types
• Integrated Ichimoku Cloud filter
• Optimized risk management system
• Improved signal visualization
═════════════════════════════════════════
© 2025 BRT Trading Systems
Strategy is protected by copyright. Commercial use without author's permission is prohibited.
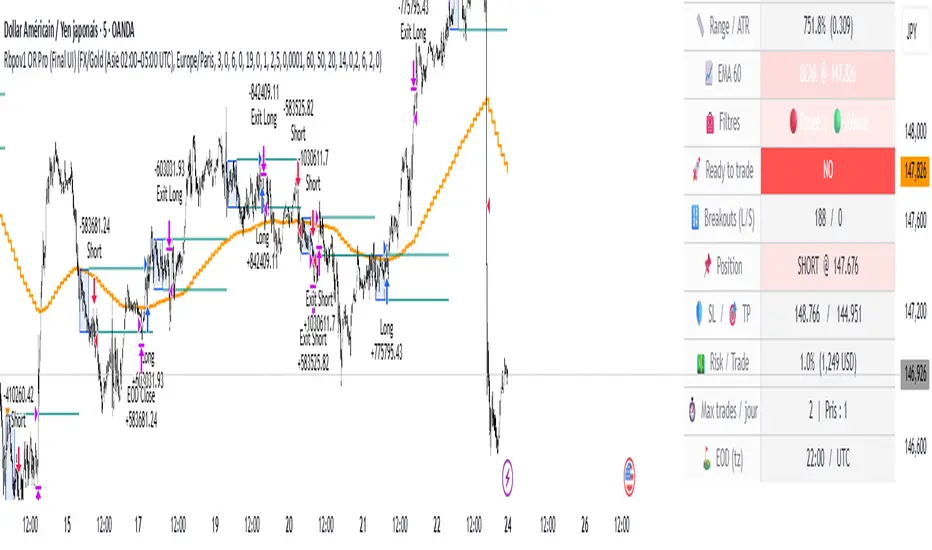
Rbpov1 – Opening Range Multi-Actifs Final📌 Strategy Bio – Rbpov1 Opening Range Pro
🎯 Core Concept
The Rbpov1 Opening Range Pro is an advanced algorithmic trading system built around the opening range breakout concept.
It is based on the observation that, after a period of consolidation (the opening range), markets often generate strong directional moves once the range is broken.
This strategy is designed to be multi-asset (Forex, indices, commodities, crypto) and multi-timeframe, with the following key principles:
A reference range (default: 03:00 → 06:00 UTC+2, customizable).
Trade entries are taken only after the range closes.
Smart filtering (trend, volatility, volume) to reduce false signals.
Strict risk management in USD, with Stop Loss and Take Profit defined in multiples of R.
Automatic end-of-day flat rule: all positions are closed by session end.
⚙️ Filters & Conditions
🔹 1. Trend Filter (EMA HTF)
A 21-period EMA is applied to a higher timeframe (default: H4).
If price is above EMA, only longs are allowed.
If price is below EMA, only shorts are allowed.
👉 This aligns intraday trades with the dominant trend.
🔹 2. Volatility Filter (ATR)
Uses a 14-period ATR to validate range conditions.
Opening range is valid only if:
Range > minATR × ATR
Range < maxATR × ATR
Default: minATR = 0.2, maxATR = 6.0.
👉 Filters out noise (tiny ranges) or overextended volatility.
🔹 3. Volume Filter (Optional)
Breakout candle must show higher volume than the average (default SMA 20).
Prevents low-liquidity breakouts.
🔹 4. Session & Trading Rules
No trades during weekends (Forex).
Maximum X trades per day (default: 2).
Positions are force-closed at EOD (default: 19:00 UTC+2).
💰 Risk Management
Dynamic position sizing in USD (capital × risk%).
Stop Loss automatically set at the opposite side of the range (with optional buffer).
Take Profit in multiples of R (default: 1.5R).
Equity-based recalculation ensures consistency as account grows.
📊 Key Benefits
✅ Professional and modular architecture.
✅ Works across Forex, indices, gold, and crypto.
✅ Smart filtering for cleaner signals.
✅ Robust and consistent risk management.
✅ Automatic end-of-day flattening (no overnight risk).
✅ Modern and visual dashboard interface for readability.
🏆 Use Cases
Forex (USD/JPY, EUR/USD, GBP/USD) → Asian session ranges.
Indices (NAS100, US30, DAX) → NYSE opening ranges.
Gold (XAU/USD) → Tokyo or pre-London ranges.
Crypto (BTC, ETH) → Tailored to volatility peaks.
Scott's DBOthis is a unique version of a daily breakout strategy, using custom signals, special handling of trading logic, and built to work with traders post for actual trading. Credit to: for the base indicator

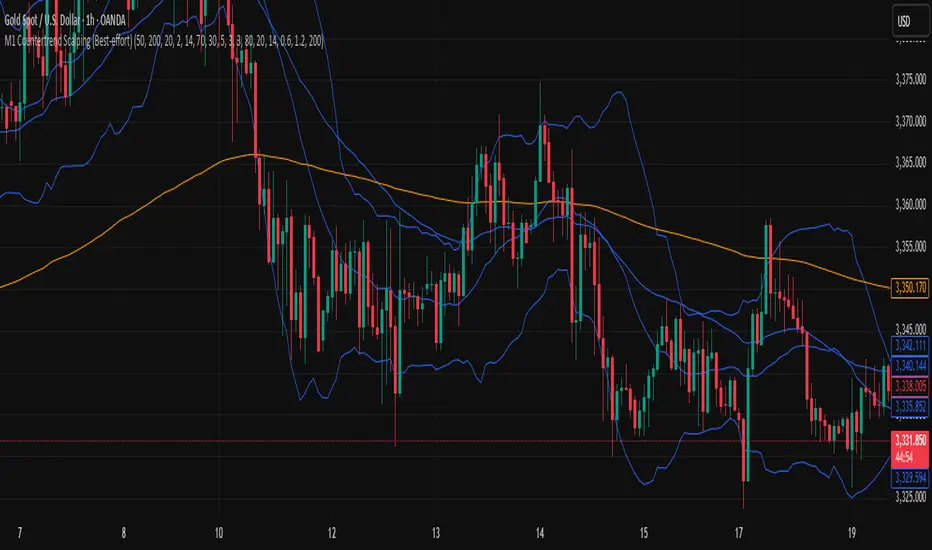
M1 Countertrend Scalping (Best-effort)M1 Countertrend Scalping (Best-effort)
M1 Countertrend Scalping (Best-effort)
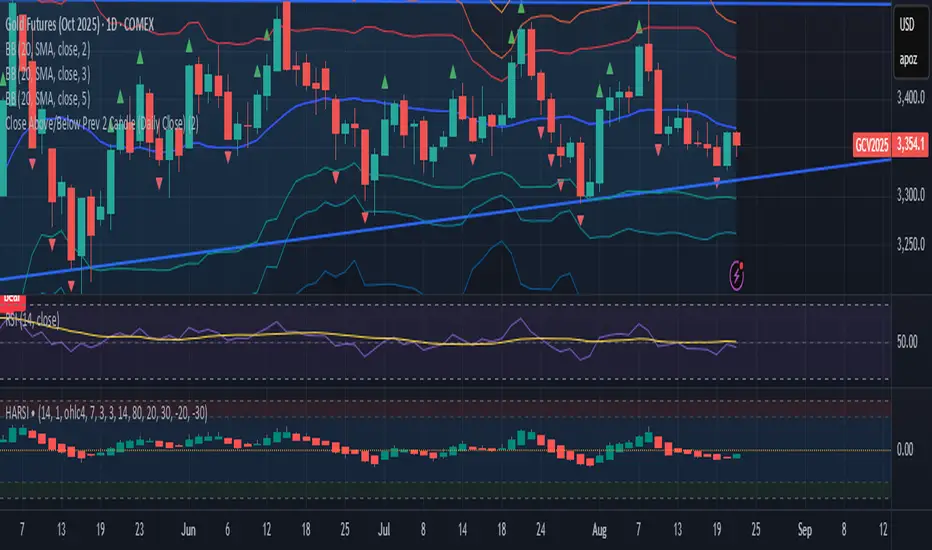
Close Above/Below Prev 2 Candle (Daily Close)This strategy identifies potential trend continuation or breakout signals by analyzing the daily candle closes relative to the previous two daily candles. It generates clear alerts and trade signals only after the daily candle has fully closed, reducing false intraday triggers.
How it works:
Long Entry (Bullish Signal): Triggered when the daily candle closes above the highs of the previous two daily candles.
Short Entry (Bearish Signal): Triggered when the daily candle closes below the lows of the previous two daily candles.
Visual Indicators: Green triangles indicate bullish signals, red triangles indicate bearish signals.
Strategy Features:
Optional long and short entries with configurable risk/reward ratio.
Automatic stop-loss and take-profit calculation based on candle structure.
Works on intraday charts using daily candle analysis.
Alerts:
Alerts trigger only after the daily candle closes above/below the previous two daily candles.
Helps traders receive precise notifications for potential breakout trades.
Benefits:
Reduces noise by using daily candle closes.
Easy to integrate with other swing or trend strategies.
Provides clear visual and alert signals for both bullish and bearish setups.
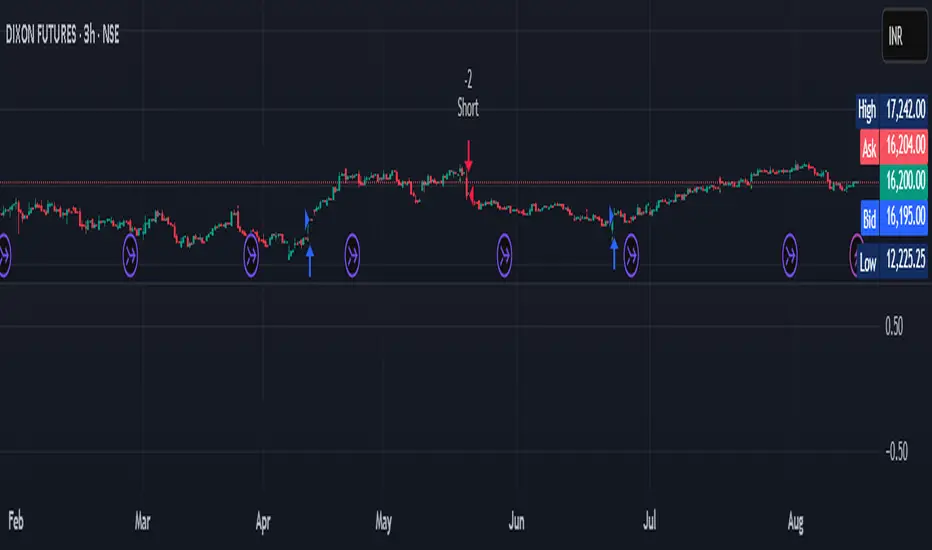
ROPSON AI Ultra 3.27 How It Takes a Long (Buy) Position
The code will only enter a long position when two conditions are met simultaneously. Both must be true for a buy signal to be generated:
The current candle's close price crosses above the previous candle's high. This is the breakout signal. It indicates strong upward momentum.
The current candle's close price is above the 200 EMA. This is the trend filter. The 200 EMA (Exponential Moving Average) is a widely used indicator for long-term trend. If the price is above it, the market is considered to be in an uptrend.
By requiring both conditions, the strategy aims to enter trades that have both short-term momentum (the breakout) and long-term trend confirmation (the EMA filter).
How It Takes a Short (Sell) Position
Similarly, a short position is only entered when both of these conditions are true at the same time:
The current candle's close price crosses below the previous candle's low. This is the breakdown signal, indicating strong downward momentum.
The current candle's close price is below the 200 EMA. This confirms that the market is in a downtrend.

Imbalance RSI Divergence Strategy# Imbalance RSI Divergence Strategy - User Guide
## What is This Strategy?
This strategy identifies **imbalance** zones in the market and combines them with **RSI divergence** to generate trading signals. It aims to capitalize on price gaps left by institutional investors and large volume movements.
### Main Settings
- **RSI Period (14)**: Period used for RSI calculation. Lower values = more sensitive, higher values = more stable signals.
- **ATR Period (10)**: Period for volatility measurement using Average True Range.
- **ATR Stop Loss Multiplier (2.0)**: How many ATR units to use for stop loss calculation.
- **Risk:Reward Ratio (4.0)**: Risk-reward ratio. 2.0 = 2 units of reward for 1 unit of risk.
- **Use RSI Divergence Filter (true)**: Enables/disables the RSI divergence filter.
### Imbalance Filters
- **Minimum Imbalance Size (ATR) (0.3)**: Minimum imbalance size in ATR units to filter out small imbalances.
- **Enable Lookback Limit (false)**: Activates historical lookback limitations.
- **Maximum Lookback Bars (300)**: Maximum number of bars to look back.
### Visual Settings
- **Show Imbalance Size**: Displays imbalance size in ATR units.
- **Show RSI Divergence Lines**: Shows/hides divergence lines.
- **Divergence Line Colors**: Colors for bullish/bearish divergence lines.
### Volatility-Based Adjustments
- **Low volatility markets**:
- Minimum Imbalance Size: 0.2-0.4 ATR
- ATR Stop Loss Multiplier: 1.5-2.0
- **High volatility markets**:
- Minimum Imbalance Size: 0.5-1.0 ATR
- ATR Stop Loss Multiplier: 2.5-3.5
### Risk Tolerance
- **Conservative approach**:
- Risk:Reward Ratio: 2.0-3.0
- RSI Divergence Filter: Enabled
- Minimum Imbalance Size: Higher (0.5+ ATR)
- **Aggressive approach**:
- Risk:Reward Ratio: 4.0-6.0
- Minimum Imbalance Size: Lower (0.2-0.3 ATR)
###Market Conditions
- **Trending markets**: Higher RSI Period (21-28)
- **Sideways markets**: Lower RSI Period (10-14)
- **Volatile markets**: Higher ATR Multiplier
## Recommended Testing Procedure
1. **Start with default settings** and backtest on 3-6 months of historical data
2. **Adjust RSI Period** to see which value produces better results
3. **Optimize ATR Multiplier** for stop loss levels
4. **Test different Risk:Reward ratios** comparatively
5. **Fine-tune Minimum Imbalance Size** to improve signal quality
## Important Considerations
- **False positive signals**: Imbalances may be less reliable during low volatility periods
- **Market openings**: First hours often produce more imbalances but can be riskier
- **News events**: Consider disabling strategy during major news releases
- **Backtesting**: Test across different market conditions (trending, sideways, volatile)
## Recommended Settings for Beginners
**Safe settings for new users:**
- RSI Period: 14
- ATR Period: 14
- ATR Stop Loss Multiplier: 2.5
- Risk:Reward Ratio: 3.0
- Minimum Imbalance Size: 0.5 ATR
- RSI Divergence Filter: Enabled
## Advanced Tips
### Signal Quality Improvement
- **Combine with market structure**: Look for imbalances near key support/resistance levels
- **Volume confirmation**: Higher volume during imbalance formation increases reliability
- **Multiple timeframe analysis**: Confirm signals on higher timeframes
### Risk Management
- **Position sizing**: Never risk more than 1-2% of account per trade
- **Maximum drawdown**: Set overall stop loss for the strategy
- **Market hours**: Consider avoiding low liquidity periods
### Performance Monitoring
- **Win rate**: Track percentage of profitable trades
- **Average R:R**: Monitor actual risk-reward achieved vs. target
- **Maximum consecutive losses**: Set alerts for strategy review
This strategy works best when combined with proper risk management and market analysis. Always backtest thoroughly before using real money and adjust parameters based on your specific market and trading style.

Hassi XAUUSD Advanced FVG EMA/BOS/RSI/Volume + Session FilterWhat it does :
This strategy automates a popular ICT-style idea on XAUUSD (Gold): trade only when price taps back into a Fair Value Gap (FVG), but filter entries with trend, structure, momentum, volume, and session rules. It manages risk with fixed TP/SL (points) and shows a compact backtest panel on chart.
Core Logic
1) Market Structure (BOS)
Detects recent swing highs/lows and flags a Break of Structure:
BOS Up when price breaks the latest swing high.
BOS Down when price breaks the latest swing low.
2) FVG Detection (3-candle)
Bullish FVG when low > high and low > high .
Bearish FVG when high < low and high < low .
The most recent qualifying gap is drawn as a shaded box (optional).
3) Bias & Filters
Trend Bias: price vs EMA (default 200). Longs only above EMA; shorts only below.
Momentum: optional RSI filter (default 14); avoid longs in OB & shorts in OS.
Volume: optional filter requiring current volume > SMA(20) × multiplier.
Sessions: optional London / New York (PKT) time windows.
Entries & Exits
Long Entry (all must be true)
Above EMA, RSI bullish, volume ok, session ok, BOS Up.
A recent Bullish FVG exists (within N bars).
Price taps back into the FVG (low ≤ top & close > bottom) with a bullish candle.
Short Entry (mirror)
Below EMA, RSI bearish, volume ok, session ok, BOS Down.
A recent Bearish FVG exists (within N bars).
Price taps (high ≥ bottom & close < top) with a bearish candle.
Risk / R:R
Exits use fixed points on XAUUSD (default TP 100, SL 50).
On many gold feeds 1.0 = 10 points; inputs convert to price automatically.
“One-trade-at-a-time”: a new signal won’t fire until the previous position is flat.
Chart Labels
On entry, the script plots BUY/SELL plus fixed TP/SL lines & labels anchored to the entry bar (they don’t drift with price).
Visuals & Tools
EMA line (green/red by bias).
Swing points (tiny triangles) to see structure.
FVG boxes (green/red, optional).
Session shading (subtle blue overlay).
Stats Panel (top-right):
Total Trades, TP Hits, SL Hits, Win Rate, Profit Factor, Net P&L.
Inputs (quick guide)
EMA Length (default 200)
Swing Lookback for BOS (default 5)
FVG Box Length (how far the zone extends to the right)
TP / SL (points) for XAUUSD + display Risk:Reward
Sessions (PKT): London & New York windows + toggle
Filters: Volume (multiplier), RSI (length, OB/OS)
Visibility: show/hide FVG boxes & TP/SL drawings
Alerts
Buy Signal / Sell Signal on valid entries
Position Opened / Position Closed notifications
Best Practices & Notes
Designed for XAUUSD 15-minute. You can test other timeframes, but retune TP/SL points and filters accordingly.
Broker ticks differ: if your symbol steps are not 0.1, adjust TP/SL points.
Use with a HTF confluence (e.g., D1/4H bias, key S/R, news awareness).
Backtests are approximations; real results vary with spreads, slippage, and execution.
Disclaimer: This tool is for educational purposes. It is not financial advice. Always test before using on live capital.

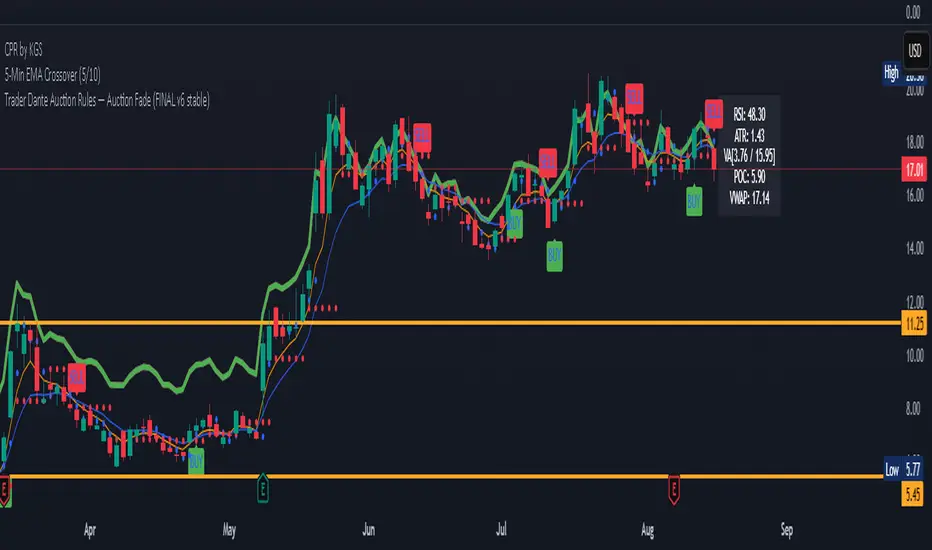
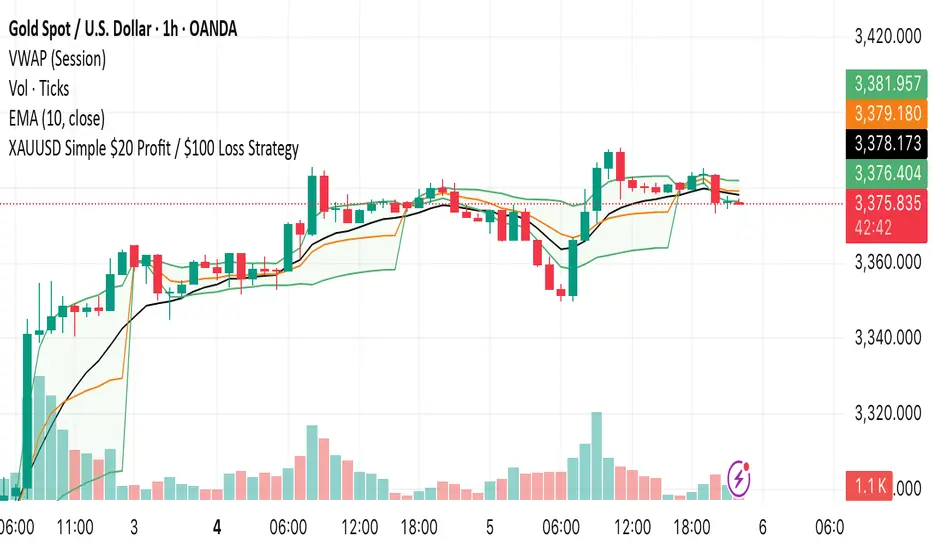
Auction Market Theory: Value Area & VWAP Fade - DashboardAn "Auction Market Theory" dashboard is a visual summary of the market's state according to the principles of Auction Market Theory. It consolidates key metrics like the Value Area (VA), Point of Control (POC), and Volume-Weighted Average Price (VWAP) into a single, easy-to-read panel on your chart.
What a Dashboard Shows
The purpose of the dashboard is to give traders a quick, real-time snapshot of the market's auction process. It helps you answer critical questions like:
Where is the market's "fair value"? This is shown by the Value Area (VA) range.
Where is the most volume concentrated? This is the Point of Control (POC), the price that acts as a gravitational center.
How are market participants currently positioned? The VWAP provides a measure of the average price paid, weighted by volume. Price trading above VWAP suggests a bullish volume bias, while price below suggests a bearish bias.
Is the market in a state of balance or imbalance? The relationship between the current price and these key levels helps to quickly determine if the market is accepting a price range (balance) or rejecting it (imbalance/trend).
How to Interpret the Dashboard
Value Area (VA) & Point of Control (POC)
These metrics are derived from a volume profile and are the foundation of the auction theory dashboard. The dashboard displays the VA's low and high, as well as the POC. These levels define the market's "accepted" price range for a given period.
VWAP
VWAP acts as a real-time moving average that is more responsive to volume than a standard moving average. It's often used as an intraday anchor. When price is significantly stretched from the VWAP (and its standard deviation bands), it's a signal of a potential over-extension and a target for a mean-reversion trade.
Dashboard's Role in Trading
The dashboard is not an entry signal itself, but a contextual tool. It provides the framework for your trading decisions. For a "fade the edge" strategy, you would use the dashboard to:
Identify the edges: See the exact price levels of the VA and VWAP bands.
Wait for the stretch: Look for price to move beyond those edges.
Confirm the reversal: Only then would you look at other indicators (like RSI or volume spikes) for an entry signal.
Manage the trade: Use the POC as a potential take-profit target, as price has a high probability of returning to this point of volume consensus.
Volume Spike Strategy by CzechroninThis strategy uses VOlume spikes to enter big trades
~
Czechronin
MACD EMA 200 Strategy (Roche 5min Scalp)Free to use, stay blessed.
I don't believe charging for something that everyone can use.
Please enjoy it.

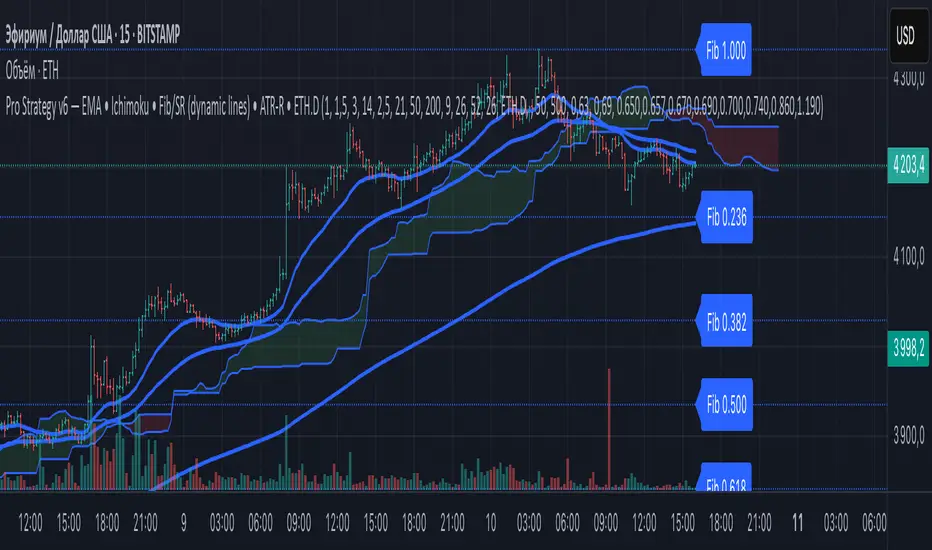
ZapTeam Pro Strategy v6 — EMA The Pro Strategy v6 script is a versatile trading strategy for TradingView that combines trend indicators, filters, and levels.
Main features:
EMA 21, EMA 50, EMA 200 — trend detection and entry signals via EMA crossovers.
Ichimoku Cloud (optional) — trend filtering and price position relative to the cloud.
ETH Dominance filter (optional) — filters trades based on Ethereum dominance (ETH.D).
ATR Stop-Loss — dynamic stop-loss based on volatility.
Two take-profits (TP1 and TP2) with optional 50/50 split.
Dynamic Fibonacci Levels — automatic or manual swings, with 1.272 and 1.618 extensions.
Custom S/R Levels — user-defined support/resistance levels.
Level lines extend across the chart and automatically adjust when zooming or panning.
Designed for trading in trending market conditions on any timeframe.
The strategy calculates position size based on percentage risk per equity.
CP Strat ORBnew york opening range breakout and retest allows you to enter a trade with a better clarity if the price comes back and retest the range

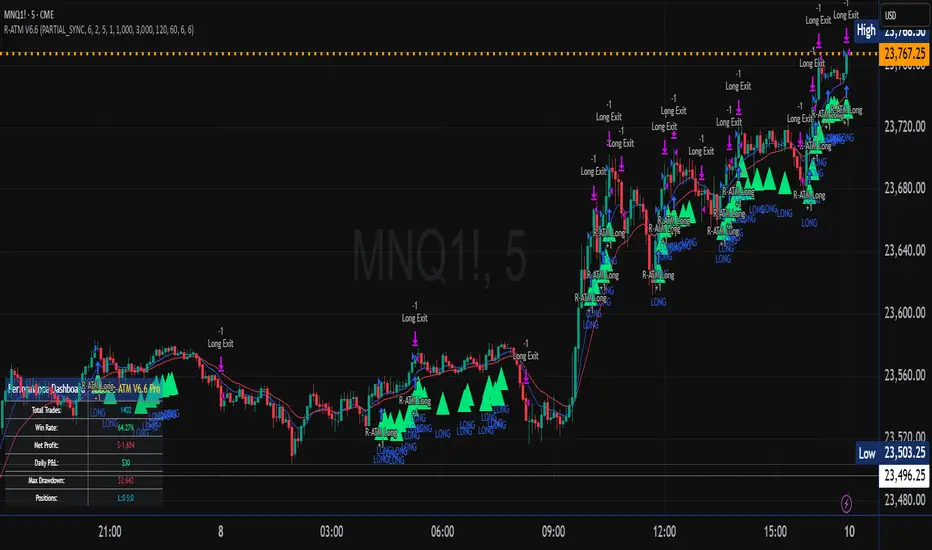
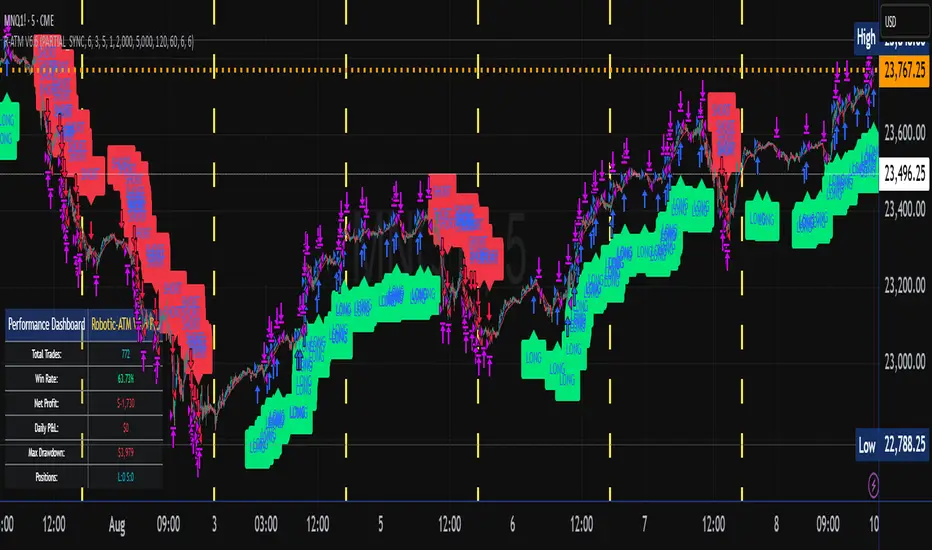
Robotic-ATM V6.6 Professional🤖 Robotic-ATM V6.6 Pro - Advanced Multi-Indicator Algorithmic Trading Strategy
Professional algo system combining 4 proven indicators: R-ATM KISS V5 trend detection, LG_TRSpeed momentum analysis, R-ATM Oscillator scoring, WaveTrend wave analysis. Features 3 signal modes (ALL_IMMEDIATE/ALL_SYNC/PARTIAL_SYNC), advanced risk mgmt with stop-loss/profit targets, daily P&L limits, position controls, and volatility filtering. Real-time dashboard tracks trades, win rate, profit/loss, and drawdown. $300/month subscription, 21-day FREE trial, cancel anytime. 3+3 months free when paying quarterly. Educational purposes only. Past performance doesn't guarantee future results. Trading involves substantial risk. Only trade with capital you can afford to lose. Contact: support@robotic-atm.com | robotic-atm.com | Robotic-ATM Inc.
Robotic-ATM V6.6.3/IO🤖 Robotic-ATM V6.6 3.3 IO - Advanced Multi-Indicator Algorithmic Trading Strategy
Professional algo system combining 4 proven indicators: R-ATM KISS V5 trend detection, LG_TRSpeed momentum analysis, R-ATM Oscillator scoring, WaveTrend wave analysis. Features 3 signal modes (ALL_IMMEDIATE/ALL_SYNC/PARTIAL_SYNC), advanced risk mgmt with stop-loss/profit targets, daily P&L limits, position controls, and volatility filtering. Real-time dashboard tracks trades, win rate, profit/loss, and drawdown. $300/month subscription, 21-day FREE trial, cancel anytime. 3+3 months free when paying quarterly. Educational purposes only. Past performance doesn't guarantee future results. Trading involves substantial risk. Only trade with capital you can afford to lose. Contact: sales@robotic-atm.com | robotic-atm.com | Robotic-ATM Inc.
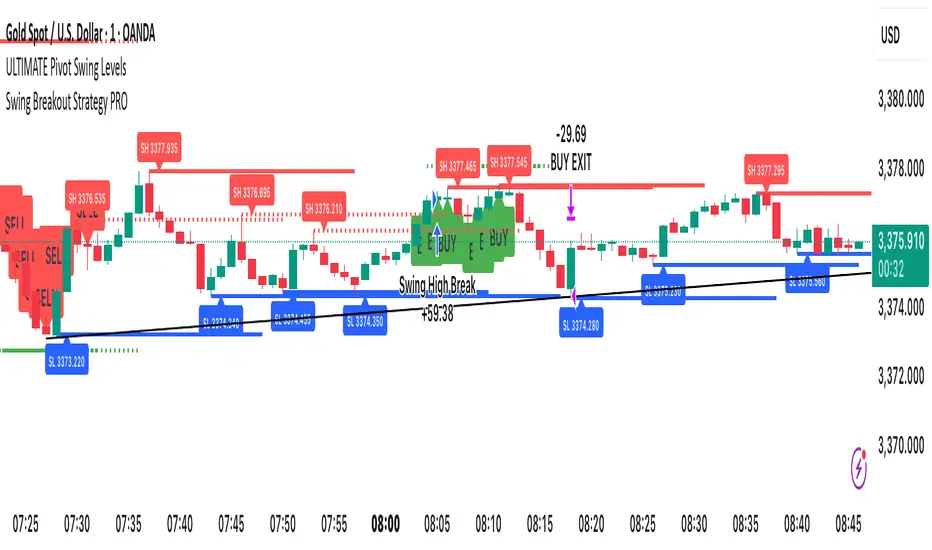
Swing Breakout Strategy PRO“Swing Strategy Pro”
A powerful trading tool designed for price action & swing traders. This indicator automatically detects swing highs and lows and generates precise Buy & Sell signals based on breakout confirmations.
✅ How It Works:
• Buy signal: When swing high breaks with confirmation candle
• Sell signal: When swing low breaks with confirmation candle
• Target = Distance between recent swing high & low
• Stop Loss = Opposite swing level
📌 Perfect for Breakout Trading, Swing Entries, and Trend Continuation strategies.
🎯 Fully automated with visual alerts & clean chart design.
AI - Williams Alligator Strategy (ATR Stop-Loss) AlertsAI - Williams Alligator Strategy (ATR Stop-Loss) with Alerts
