Three Outside Down Strategy This is a three candlestick bearish reversal pattern consisting of a bearish
engulfing pattern formed by the first two candlesticks then followed by a down
candlestick with a lower close than the prior candlestick.
WARNING:
- This script to change bars colors.
Поиск скриптов по запросу "Candlestick"

Directional filter VERSION 2The idea is to make it more visible if the moment is to seek buying or selling, based on moving averages, being SMA 21 and EMA 9.
best BUYBAR has the EMA9 and SMA21 rising and closing above them. "relevance A"
best SELLBAR has the EMA9 and SMA21 dropping and closing below them. "relevance A"
Conditions for all colors of the candlesticks:
BuyBar A = price closes above EMA9 and SMA21 with EMA9 and SMA21 rising.
BuyBar B = price closes above SMA21 with SMA21 rising OR price closes above EMA9 and SMA21.
BuyBar C = price closes above EMA9 with EMA9 rising and SMA21 falling.
BuyBar Neutral = close> open.
SellBar A = price closes below EMA9 and SMA21 with EMA9 and SMA21 falling.
SellBar B = price closes below SMA21 with SMA21 falling OR price closes below EMA9 and SMA21.
SellBar C = price closes below EMA9 with EMA9 falling and SMA21 rising.
SellBar Neutral = close abertura.
SellBar A = preço fecha abaixo de EMA9 e SMA21 com EMA9 e SMA21 caindo.
SellBar B = preço fecha abaixo de SMA21 com SMA21 caindo OU preço fecha abaixo de EMA9 e SMA21.
SellBar C = preço fecha abaixo de EMA9 com EMA9 caindo e SMA21 subindo.
SellBar Neutral = fechamento < abertura.
As medias moveis também alteram de acordo com a direção em que estão:
EMA 9 subindo = azul
EMA 9 caindo = laranja
SMA 21 subindo = verde
SMA21 caindo = vermelho

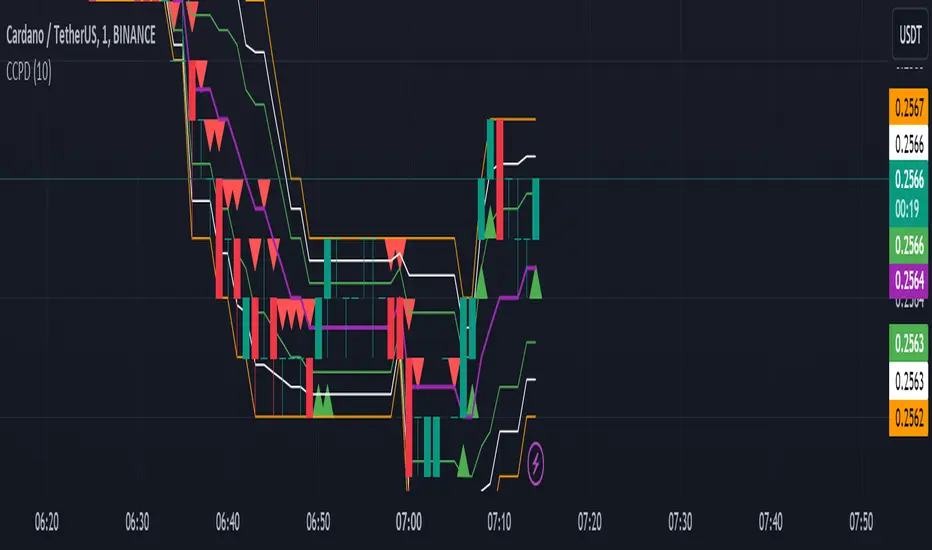
CCPD Candle Color Price DetectorThe "CCPD Candle Color Price Detector" is a custom indicator developed for TradingView, a popular platform for technical analysis and trading. This indicator assists traders in identifying potential trend reversals and assessing market sentiment based on candlestick color changes and key price levels.
This indicator operates as follows:
Color Change Detection: It primarily focuses on the color of candlesticks (green for bullish and red for bearish). When a candlestick closes higher than it opens, it is considered green (bullish), and when it closes lower, it is red (bearish).
High and Low Analysis: The indicator calculates the highest high and lowest low over a user-defined number of bars (specified by the 'Bars for High/Low' input parameter). This helps identify recent price extremes.
Midpoint Calculation: It then computes the midpoint between the highest high and lowest low, effectively determining a central reference point within the specified period.
Signal Generation: Buy and sell signals are generated based on the relationship between the current candlestick's close price, the midpoint, and the candlestick color. Buy signals occur when a green candle closes above the midpoint, suggesting potential bullish momentum. Conversely, sell signals trigger when a red candle closes below the midpoint, indicating possible bearish pressure.
Visualization: The indicator visualizes the highest high, lowest low, midpoint, and additional lines to aid in understanding the price action and potential reversal points.
Alerts: It provides alerts for buy and sell signals, allowing traders to receive notifications when potential trading opportunities arise.
Usage:
Traders can utilize the "CCPD Candle Color Price Detector" in the following ways:
Trend Reversal Identification: This indicator can help traders spot potential trend reversals by signaling when candlestick colors change and close near the midpoint. Buy and sell signals offer entry points for trades based on these reversals.
Confirmation Tool: It can be used in conjunction with other technical analysis tools to confirm trading decisions. For example, a buy signal from this indicator, coupled with a bullish trendline break or a bounce from a key support level, may provide a stronger bullish signal.
Risk Management: By understanding potential reversal points and using stop-loss orders, traders can better manage their risk and protect their capital when entering positions based on the indicator's signals.
Customization: The indicator allows users to adjust the number of bars for high/low calculations, making it adaptable to different trading strategies and timeframes.
In summary, the "CCPD Candle Color Price Detector" is a versatile indicator that can aid traders in spotting potential trend changes, enhancing trading decisions, and managing risk effectively. However, like any trading tool, it should be used in conjunction with other analysis methods and risk management strategies for optimal results.
ICMCBased on basic Nimblr TA, Momentum Candles combined with Breakout/Breakdown can detect a change in trend direction.
Nimblr mainly categorizes candlesticks into Momentum (Body > 50%) and Indecision (Body < 50%) candlesticks.
⁕ shows Momentum Candles, others are Indecision Candles
↑ shows Breakout
↓ shows Breakdown
Yellow lines show the current Indecision candle and white lines the past Indecision candle.

Cryptocurrency Dual-System Color-Changing Moving AveragesCryptocurrency Dual-System Color-Changing Moving Averages: Advanced Multi-Timeframe Trend Analysis
Innovative Core Concept
Our indicator introduces a revolutionary approach to trend analysis by integrating dual moving average systems with intelligent visual feedback mechanisms. Unlike traditional moving average indicators that simply display lines or basic crossovers, our system provides dynamic, multi-dimensional trend intelligence through three key innovations:
Dual Independent Moving Average Systems - Two complete 7-period moving average systems operate simultaneously, offering independent trend confirmation while maintaining visual harmony through unified color coding.
Intelligent Color-Changing Algorithm - Each moving average dynamically changes color based on its individual trend strength, creating a visual heatmap of momentum across different timeframes.
Holistic Market State Visualization - The entire candlestick chart changes color based on overall trend alignment, providing immediate visual confirmation of market regimes.
Comprehensive Functionality and Implementation
What It Does
This indicator performs multi-timeframe trend analysis across 14 moving averages (7 for each system), calculating individual trend strength for each line and determining overall market alignment to provide clear visual signals for different market conditions.
How It Works
Primary Trend Strength Calculation:
For each moving average, the indicator calculates a proprietary trend strength value by analyzing the net directional movement over a user-defined lookback period. This quantifies whether the moving average is consistently rising, falling, or consolidating.
Color Coding Logic:
Blue: Moving average shows strong upward momentum (trend strength exceeds positive threshold)
Orange: Moving average shows strong downward momentum (trend strength falls below negative threshold)
Gray: Moving average shows neutral/consolidating behavior
Market Regime Detection:
The system analyzes the alignment of three key moving averages (short-term, medium-term, and long-term) from the Main MA System to determine the overall market state:
Bullish Alignment: Short-term MA > Medium-term MA > Long-term MA (candlesticks turn blue)
Bearish Alignment: Short-term MA < Medium-term MA < Long-term MA (candlesticks turn orange)
Consolidation: No clear alignment pattern (candlesticks turn white)
Implementation Methodology
Our approach combines several established technical analysis concepts with unique enhancements:
Multiple Timeframe Analysis (MTFA) - We simultaneously analyze 7 different time periods (21, 55, 89, 144, 200, 450, 800) to capture trend dynamics across short, medium, and long time horizons.
Trend Strength Quantification - Instead of relying on simple crossovers, we calculate a proprietary trend strength metric that measures both direction and momentum consistency.
Visual Pattern Recognition Enhancement - By color-coding both the moving averages and the price bars, we leverage human visual processing capabilities to quickly identify market states and potential reversals.
Dual Confirmation System - The two independent moving average systems (Main System and EMA System) provide layered confirmation, reducing false signals and increasing reliability.
Practical Application and Usage Guidelines
Setup and Configuration
Main Moving Average System:
Configure your preferred moving average type (SMA, EMA, WMA, or HMA) and select which of the 7 periods to display. Each period can be individually enabled or disabled based on your analysis needs.
EMA System Configuration:
The secondary EMA system provides additional trend confirmation. Adjust its transparency to visually distinguish it from the Main System while maintaining chart clarity.
Trend Sensitivity Adjustment:
The "Trend Strength Threshold" parameter allows fine-tuning of color change sensitivity. Lower values make the indicator more responsive to minor trends, while higher values require stronger momentum for color changes.
Strategic Trading Applications
1. Trend Identification and Confirmation Strategy
Bullish Confirmation: Look for predominantly blue moving averages across multiple timeframes accompanied by blue candlesticks
Bearish Confirmation: Look for predominantly orange moving averages across multiple timeframes accompanied by orange candlesticks
Trend Weakness Detection: Watch for moving averages changing from blue to gray/orange or from orange to gray/blue
2. Multi-Timeframe Alignment Trading
High-Probability Entries: Enter positions when all three key timeframes (short, medium, long) align in the same direction
Exit Signals: Consider reducing positions when timeframes begin to diverge or when candlestick color changes to white (consolidation)
3. Support and Resistance Identification
Moving averages serve as dynamic support/resistance levels
Color changes at these levels indicate whether support/resistance is strengthening or weakening
4. Market Regime Adaptation
Trend-Following Mode: During blue/orange candlestick periods, employ trend-following strategies
Range-Trading Mode: During white candlestick periods, employ range-bound or mean-reversion strategies
Core Philosophical Framework and Calculation Logic
Underlying Technical Analysis Principles
Our indicator is built upon the principle that trends exist simultaneously across multiple timeframes, and the convergence or divergence of these timeframes provides valuable information about trend strength and potential reversals.
Calculation Methodology
Trend Strength Formula:
For each moving average, we calculate:
Sum of upward movements over the lookback period
Sum of downward movements over the lookback period
Net directional bias as a normalized value between -1 and +1
This approach provides a more nuanced understanding of trend momentum compared to simple directional analysis.
Threshold-Based Classification:
Values above the positive threshold indicate sustainable upward momentum
Values below the negative threshold indicate sustainable downward momentum
Values within the threshold range indicate consolidation or weak trends
Why This Approach Is Effective
Early Warning System: Color changes in individual moving averages often precede overall market regime changes, providing early reversal signals.
Noise Reduction: By requiring alignment across multiple timeframes for candlestick coloring, we filter out false signals common in single-timeframe analysis.
Visual Processing Efficiency: The color-coded system allows rapid interpretation of complex multi-timeframe information, reducing cognitive load during fast market conditions.
Adaptability: Configurable parameters allow adjustment for different market conditions (high volatility vs. low volatility) and trading styles (scalping vs. position trading).
This indicator is particularly valuable for cryptocurrency trading due to the market's characteristic high volatility and strong trend tendencies. By providing clear visual cues about trend strength and alignment across multiple timeframes, it helps traders remain aligned with the dominant market direction while avoiding periods of choppy, directionless price action.
The system's dual-layer confirmation (moving average colors + candlestick colors) creates a robust framework for identifying high-probability trading opportunities while maintaining flexibility to adapt to changing market conditions.

Trend Confirmation StrategyComprehensive Trend Confirmation System
Indicator Features (Professional Description):
Comprehensive Trend Confirmation System is a versatile indicator meticulously designed to identify and confirm trend-based trading opportunities with exceptional efficiency. By seamlessly integrating analysis from a suite of leading technical tools, it aims to provide superior accuracy and reliability for informed trading decisions.
Key Features:
Intelligent Trend Identification: A robust trend analysis system that considers:
Adjustable Moving Averages: Utilizes three customizable moving average periods (fast, medium, slow) with user-selectable lengths and types (SMA, EMA, WMA, VWMA) to accurately determine the prevailing trend across different timeframes.
In-depth Price Action Analysis: Examines the formation of Higher Highs/Higher Lows (uptrend) and Lower Highs/Lower Lows (downtrend) to validate price direction.
Average Directional Index (ADX) with Adjustable Threshold: Measures the strength of a trend and employs the comparison between +DI and -DI to pinpoint the dominant momentum, featuring a customizable threshold to filter out weak signals.
Multi-Factor Signal Confirmation System: Enhances the reliability of trading signals through verification from four distinct confirmation tools:
Volume Analysis with Average Reference: Assesses whether trading volume supports price movements by comparing it to historical averages.
Relative Strength Index (RSI) with Reference Levels: Measures price momentum and identifies overbought/oversold conditions to confirm trend strength.
Moving Average Convergence Divergence (MACD) Divergence and Crossovers: Detects shifts in momentum and potential trend changes through the relationship between the MACD line and the Signal line.
Stochastic Oscillator with Reference Levels: Measures the current price's position relative to its historical range to evaluate overbought/oversold conditions and potential reversal opportunities.
Intelligent Signal Generation Logic:
Buy Signal: Triggered when a strong uptrend is identified (meeting defined criteria) and confirmed by at least three out of the four confirmation tools.
Sell Signal: Triggered when a strong downtrend is identified (meeting defined criteria) and confirmed by at least three out of the four confirmation tools.
User-Friendly Visualizations:
Moving Averages (MA): Displays three MA lines on the chart with user-configurable colors (default: fast-blue, medium-orange, slow-red) for easy visual trend analysis.
Clear Buy and Sell Signal Symbols: Presents distinct green upward-pointing triangles for buy signals and red downward-pointing triangles for sell signals at the corresponding candlestick.
Dynamic Candlestick Color Coding: Candlesticks are dynamically colored green upon a buy signal and red upon a sell signal for quick identification of trading opportunities.
Highly Customizable Parameters: Users have extensive control over the indicator's parameters, including:
Lengths and types of Moving Averages.
Length and Threshold of the ADX.
Length of the RSI.
Parameters for the MACD (Fast Length, Slow Length, Signal Length).
Parameters for the Stochastic Oscillator (%K Length, %D Length, Smoothing).
Ideal For:
Traders seeking a robust tool to accurately identify and confirm market trends.
Individuals aiming to reduce false signals and enhance the precision of their trading decisions.
Traders employing trend-following strategies in markets with clear directional movement.
Important Note:
While Comprehensive Trend Confirmation System is engineered to improve trading accuracy, no indicator can guarantee 100% profitable trades. Users are advised to utilize this indicator in conjunction with relevant fundamental analysis and sound risk management practices for optimal trading outcomes.

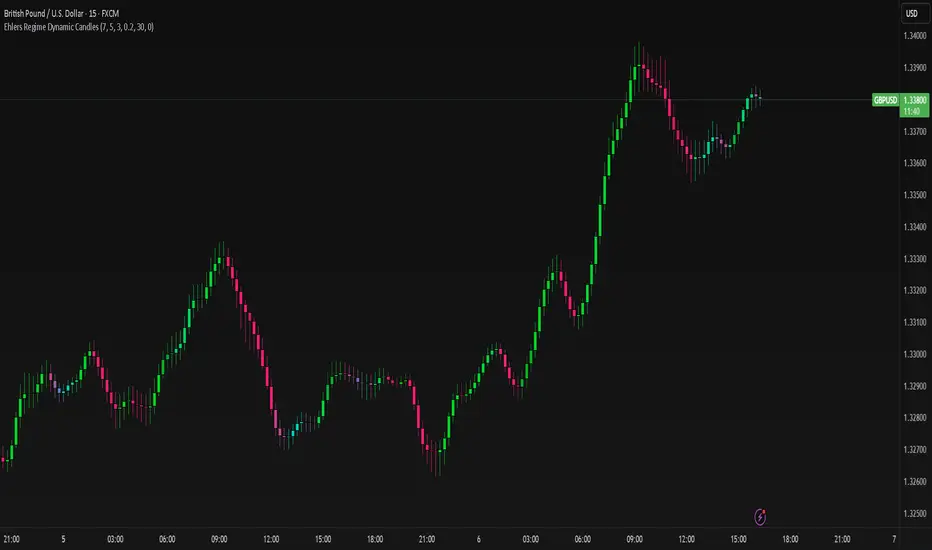
Ehlers Regime Dynamic CandlesCore Calculation Mechanism
The indicator uses advanced Ehlers signal processing techniques to identify market regimes and create dynamically colored candles that reflect market conditions.
Super Smoother Filter: Price data (open, high, low, close) is processed through an Ehlers Super Smoother Filter to reduce market noise while preserving important price movements. This creates a clearer signal for regime detection.
Autocorrelation Analysis: The core of regime detection uses autocorrelation functions at different lag periods:
Primary autocorrelation measures correlation between the current price and its previous value
Trending autocorrelation measures longer-term persistence in the data series
These values combined determine if the market is in a trending or choppy regime
(Image showing Ehlers custom candles vs default candlesticks)
Regime Strength Calculation:
-Raw signal from autocorrelation with user-defined threshold adjustment
-Adaptive scaling based on sensitivity parameter
-Optional volume validation that confirms signal strength using volume data
-Normalization to 0-1 range and smoothing for visual consistency
-Percentile ranking to provide contextually meaningful strength values
Fisher Transform: Applied to the smoothed price to identify statistical extremes, which helps adjust transparency levels during significant price movements.
Key Features & Components
Regime Detection: Identifies trending vs. choppy market conditions using Ehlers' autocorrelation techniques.
Dynamic Candle Coloring: Candles transition smoothly between three color states:
Bullish trending (typically green/teal)
Bearish trending (typically red/purple)
Choppy/neutral (typically blue/silver)
Volume Validation: Optional incorporation of volume data to confirm trend strength (stronger volume during trending periods increases confidence).
Adaptive Transparency: Candles become more opaque during statistically significant price movements based on Fisher Transform values.
Gradient Smoothing: Controls the visual transition between regime states for a more aesthetically pleasing appearance.
Customizable Colors and Style: Full control over all visual aspects including candle body/wick colors and transparency.
Configuration Options
Users can adjust the following parameters in the indicator settings:
Main Settings:
Cycle Length: Controls the lookback period for cycle detection. Lower values increase responsiveness but may introduce noise.
Gradient Smoothness: Determines how quickly colors transition when regime changes.
Trend Detection Threshold: Sets the autocorrelation strength required to classify a trend.
Trend Sensitivity: Scales regime strength calculation to produce a better distribution of values.
Use Volume: Toggles whether volume data is used to validate trend strength.
Color Settings:
Trending Regime Colors: Separate color options for bullish and bearish candle bodies and wicks.
Choppy Regime Colors: Color options for candle bodies and wicks during sideways/neutral markets.
Style Settings:
Candle Border Options: Toggle borders and adjust their color and transparency.
Adaptive Transparency: Enable/disable dynamic transparency based on statistical significance.
Base Transparency: Set the baseline transparency level for all candles.
Interpretation Notes
Color Transitions: As the market shifts between regimes, candle colors gradually transition, providing visual cues about market structure changes.
Regime Strength: The intensity of colors indicates the strength of the detected regime:
Strong trending regimes show vibrant trending colors
Weak or mixed regimes display colors closer to the choppy/neutral color
Transitions between regimes show gradient colors
Transparency Changes: More opaque candles indicate statistically significant price movements, while more transparent candles suggest routine or less significant price action.
Volume Interaction: When volume validation is enabled, trending colors become more pronounced during high volume trends and subdued during low volume periods.
Disclaimer: These are custom candles that are significantly different from normal candlesticks.
Unlike traditional candlesticks that display raw price data, these candles:
• Use Ehlers signal processing to filter and smooth price data
• Dynamically change color based on detected market regimes
• Show statistical significance through transparency
• May appear delayed compared to standard candles due to the filtering process
Traditional trading strategies dependent on candlestick patterns will not work with these.
Risk Disclaimer
Trading involves significant risk. This indicator is provided for analytical purposes only and does not constitute financial advice. Past performance is not indicative of future results. Use sound risk management practices and never trade with capital you cannot afford to lose. The Ehlers Regime Dynamic Candles indicator should be used as part of a comprehensive trading approach, not as a standalone trading system.
Engulfing Pattern & Impulse [UAlgo]The Engulfing Pattern & Impulse is a tool designed for technical traders who utilize price action and volume analysis to assess market trends and potential reversals. This indicator identifies two powerful trading signals: Engulfing Patterns and Volume Impulses, which are essential components for evaluating potential bullish or bearish market momentum.
Engulfing Patterns are classic candlestick formations often associated with reversals or trend continuations, depending on the overall trend context. This indicator highlights both bullish and bearish engulfing patterns based on configurable criteria such as trend detection settings, comparison with average body size, and a customizable body multiplier for validation. The Volume Impulse feature signals moments of significant volume compared to historical levels, which often precede substantial price movements. Together, these features provide traders with a versatile tool for better timing entry and exit points.
The indicator also offers an adaptive trend detection system, allowing traders to choose from multiple methods (e.g., SMA50 or SMA50/SMA200 combinations) to assess the trend context, making it ideal for various market conditions.
🔶Key Features
Engulfing Pattern Detection: Identifies bullish and bearish engulfing patterns with customizable parameters, including body length and average size comparison.
Configurable trend basis: Choose between SMA50 or SMA50 with SMA200 to define trend direction.
Body size multiplier: Adjust the size threshold for valid engulfing patterns, providing flexibility based on market conditions.
Volume Impulse Signal: Highlights volume spikes that meet or exceed a specified multiplier, which can indicate increased buying or selling interest.
Customizable volume period and multiplier: Allows you to tailor the volume impulse detection based on the instrument’s average volume behavior.
Trend Detection Options: Select different trend detection methods to suit various trading styles and instruments.
SMA50-based detection: Classifies the trend based on the position of price relative to the 50-period SMA.
SMA50 and SMA200 combination: Incorporates a dual-moving average approach, classifying trends based on the relationship between price, SMA50, and SMA200.
Enhanced Visualization: Distinguishes bullish and bearish signals with customizable colors, providing clear and immediate visual cues for easy interpretation.
Custom label colors: Allows you to set distinct colors for bullish, bearish, and neutral signals for quick identification.
Pattern filtering: Enable or disable specific patterns (Bullish, Bearish, or Both) based on your trading preferences.
🔶 Interpreting Indicator
Bullish Engulfing Pattern: Indicates a potential bullish reversal in a downtrend. This signal occurs when a white candlestick with a body size exceeding a specified multiplier completely engulfs the previous black candlestick. The pattern will display a “BE” label below the candle if it meets the criteria, signaling potential upward momentum.
Bearish Engulfing Pattern: Indicates a potential bearish reversal in an uptrend. A black candlestick with a body size exceeding the specified multiplier fully engulfs the previous white candlestick, signaling possible downward movement. The “BE” label appears above the candle to denote this pattern.
Volume Impulse Up: Displays a “VI” label below the candle when the volume surpasses the defined multiplier, and the price closes higher than it opened, indicating strong upward buying interest.
Volume Impulse Down: Displays a “VI” label above the candle when the volume meets or exceeds the specified threshold, and the price closes lower than it opened, signaling strong selling pressure.
Indicator uses the SMA50 and SMA200 to determine trend direction due to their popularity in technical analysis as indicators of medium- and long-term trends. The SMA50 reflects the average price over the past 50 periods, providing insight into intermediate trends, while the SMA200 is often used to identify the broader trend direction. These SMAs help traders quickly assess whether the market is in an uptrend, downtrend, or consolidation phase, enhancing decision-making for both short-term and long-term strategies.
🔶 Disclaimer
Use with Caution: This indicator is provided for educational and informational purposes only and should not be considered as financial advice. Users should exercise caution and perform their own analysis before making trading decisions based on the indicator's signals.
Not Financial Advice: The information provided by this indicator does not constitute financial advice, and the creator (UAlgo) shall not be held responsible for any trading losses incurred as a result of using this indicator.
Backtesting Recommended: Traders are encouraged to backtest the indicator thoroughly on historical data before using it in live trading to assess its performance and suitability for their trading strategies.
Risk Management: Trading involves inherent risks, and users should implement proper risk management strategies, including but not limited to stop-loss orders and position sizing, to mitigate potential losses.
No Guarantees: The accuracy and reliability of the indicator's signals cannot be guaranteed, as they are based on historical price data and past performance may not be indicative of future results.

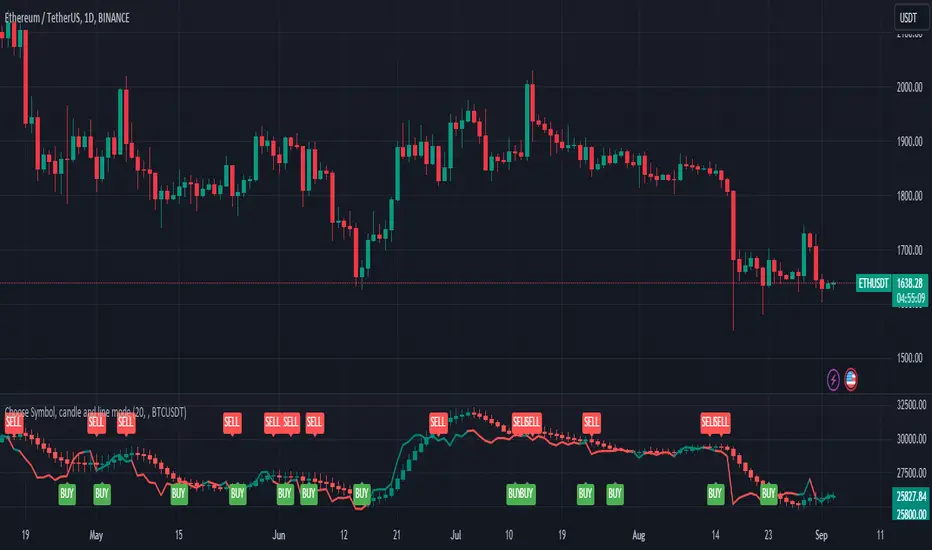
Choose Symbol, candle and line modeThis indicator plots candlesticks or line charts based on user-specified symbol and price data in the time frame. The user can also choose whether this indicator works in normal mode or Heikin-Ashi mode. Here are the features of this indicator:
1. **Trend and Normal Modes:** User can choose to operate the indicator in two different modes. In "Trend Mode" the indicator plots the moving average of the price based on the specified period length. In the "Normal Mode", it draws the opening, high, low and closing prices similar to the Heikin-Ashi candlesticks.
2. **Time Zone Selection:** User can select a different time zone to operate this indicator. By default, the current chart timeframe is used.
3. **Symbol Selection:** The indicator uses the price data from the specified symbol. The user can specify the symbol in the format "SYMBOL:PAIR".
4. **Buy-Sell Signals:** The indicator identifies buy and sell signals based on a certain period length. A buy signal occurs when the price goes above the line, while a sell signal occurs when the price goes below the line.
5. **Buy-Sell Alerts:** Alerts are sent to the user for buying and selling signals.
6. **Display on Chart:** The indicator draws candlesticks or line chart with specified modes and colors. It also marks the buying and selling points on the chart.
This indicator is used to analyze price movements in the specified symbol and time frame and to assist in buying and selling decisions. It has a user-friendly and customizable interface.
It is for idea purposes only, does not contain investment advice.
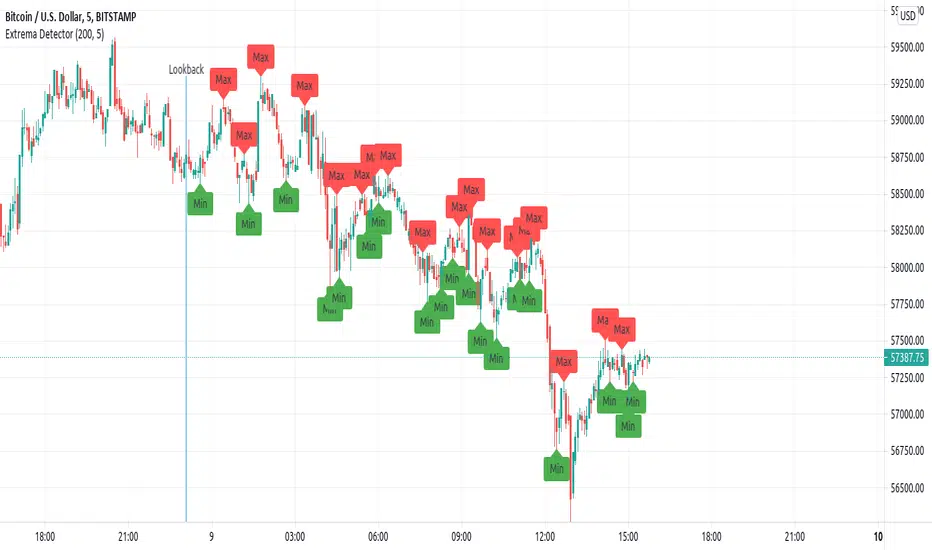
Extrema DetectorDetermines local maximums and minimums points in the chart.
Parameters:
lookback : number of candlesticks to look.
extrema_finder_sensivity : If lower, more extreme points will be found (may over-find).
Brief algorithm description:
Computes a Simple Moving Average (length= extrema_finder_sensivity ), and searches for its local extremes.
Given some SMA extreme, it looks the previous extrema_finder_sensivity candlesticks to find the highest (or lowest value).
Notes:
Is a lagged indicator: determining if the current candlestick have reach a maximum can be delayed to, at most extrema_finder_sensivity -further candlesticks.
L2 Candle Pattern ScalperLevel: 2
Background
Japanese candlesticks provide more detailed and accurate information about price movements compared to bar charts. They provide a graphical representation of the supply and demand behind the price promotions for each period. Each candlestick contains a central part that indicates the distance between the opening and closing of the security being traded, the area called the body.
Scalping is a trading strategy that aims to take advantage of minor changes in the stock price. Traders using this strategy place anywhere from 10 to a few hundred trades in a single day with the belief that small moves in the stock price are easier to catch than large ones. Traders who implement this strategy are known as scalpers. Lots of small wins can easily lead to big wins if a strict exit strategy is used to prevent big losses.
Function
L2 Candle Pattern Scalper utilizes candle pattern to decide long and short entry signal. It use inherent candles' relationship nearby to judge the market trend is up or down and decide to long or short.
Signal
buysmall --> long entry
exitred --> short entry
Pros and Cons
Pros:
1. its response is fast because OHLC candle is the raw source of market
2. it is suitable for scalping because it studies nearby candles to judge very short term trend change
Cons:
1. Mid-long term change is missing from this indicator, although I use fast and slow lines to indicate the mid-term trend.
2. No stop loss or take profit scheme is introduced.
Remarks
This is promising but need efforts to refine it.
Readme
In real life, I am a prolific inventor. I have successfully applied for more than 60 international and regional patents in the past 12 years. But in the past two years or so, I have tried to transfer my creativity to the development of trading strategies. Tradingview is the ideal platform for me. I am selecting and contributing some of the hundreds of scripts to publish in Tradingview community. Welcome everyone to interact with me to discuss these interesting pine scripts.
The scripts posted are categorized into 5 levels according to my efforts or manhours put into these works.
Level 1 : interesting script snippets or distinctive improvement from classic indicators or strategy. Level 1 scripts can usually appear in more complex indicators as a function module or element.
Level 2 : composite indicator/strategy. By selecting or combining several independent or dependent functions or sub indicators in proper way, the composite script exhibits a resonance phenomenon which can filter out noise or fake trading signal to enhance trading confidence level.
Level 3 : comprehensive indicator/strategy. They are simple trading systems based on my strategies. They are commonly containing several or all of entry signal, close signal, stop loss, take profit, re-entry, risk management, and position sizing techniques. Even some interesting fundamental and mass psychological aspects are incorporated.
Level 4 : script snippets or functions that do not disclose source code. Interesting element that can reveal market laws and work as raw material for indicators and strategies. If you find Level 1~2 scripts are helpful, Level 4 is a private version that took me far more efforts to develop.
Level 5 : indicator/strategy that do not disclose source code. private version of Level 3 script with my accumulated script processing skills or a large number of custom functions. I had a private function library built in past two years. Level 5 scripts use many of them to achieve private trading strategy.

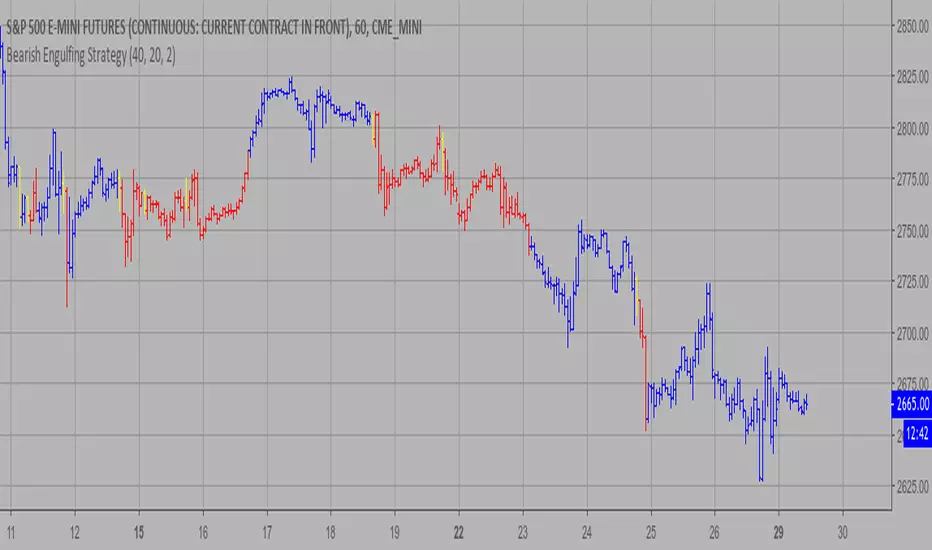
Bearish Engulfing Strategy This is a bearish candlestick reversal pattern formed by two candlesticks.
Following an uptrend, the first candlestick is a up candlestick which is
followed by a down candlestick which has a long real body that engulfs or
contains the real body of the prior bar. The Engulfing pattern is the reverse
of the Harami pattern.
WARNING:
- This script to change bars colors.
Plot Standard Candlesticks as LineThis script is to be used with Heikin Ashi or any alternative candlesticks.
It is used to show the actual price movement, (As a line), alongside the alternative candlestick's movement.
The script can be used to help read the signals sent out by the alternative candlesticks. For example, the script can be used to plot the actual price movement, (as a line), alongside Heikin Ashi to easily see how the price reacts to the Heikin Ashi Signals.
The Golden PivotsThe Golden Pivots indicator is a combination of the following:
1. Central Pivot Range
2. Floor Pivots
3. Camarilla Pivots
4. Monthly, Weekly, Daily Highs and lows
5. Candlestick Setups
All the pivot calculations are based on Secret of Pivot Boss book by Frank Ochoa.
One can also view tomorrow's central pivot range by today end of the day.

Three Inside Up Backtest This is a three candlestick bullish reversal pattern consisting of a
bullish harami pattern formed by the first 2 candlesticks then followed
by up candlestick with a higher close than the prior candlestick.
WARNING:
- For purpose educate only
- This script to change bars colors.

Three Inside Up Strategy This is a three candlestick bullish reversal pattern consisting of a
bullish harami pattern formed by the first 2 candlesticks then followed
by up candlestick with a higher close than the prior candlestick.
WARNING:
- This script to change bars colors.

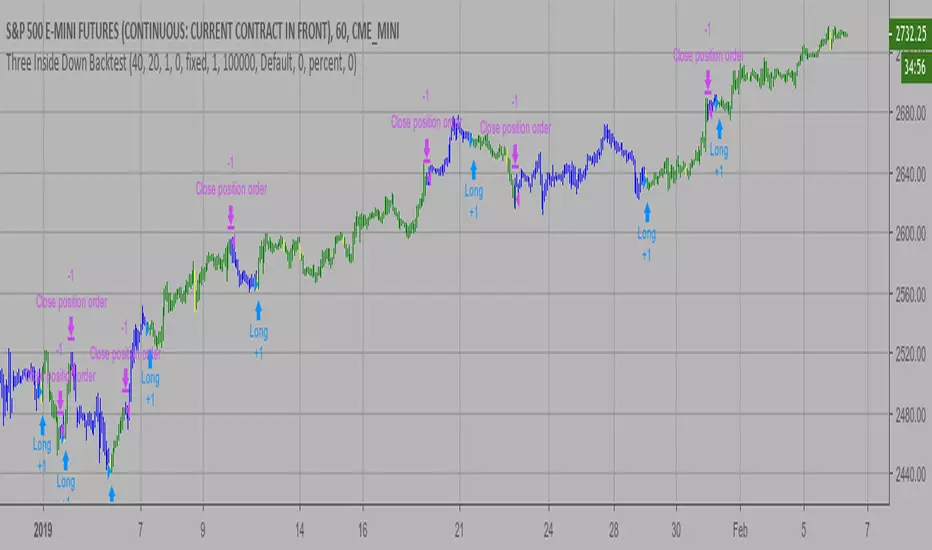
Three Inside Down Backtest This is a three candlestick bearish reversal pattern consisting of a bearish
harami pattern formed by the first 2 candlesticks then followed by down
candlestick with a lower close than the prior candlestick.
WARNING:
- For purpose educate only
- This script to change bars colors.
Dark Cloud automatic finding scriptHi
Let me introduce my Dark Cloud automatic finding script.
This is a bearish reversal pattern formed by two candlesticks within a uptrend.
Consists of an up candlestick followed by a down candlestick which opens lower
than the prior candlestick and closes below the midrange of the prior candlestick.
It is the reverse of the Piercing Line.

MACD crossover while RSI Oversold/Overbought# MACD Crossover with RSI Overbought/Oversold Indicator Explained
## Indicator Overview
This is a trading signal system that combines two classic technical indicators: **MACD (Moving Average Convergence Divergence)** and **RSI (Relative Strength Index)**. Its core logic is: MACD crossover signals are only triggered when RSI is in extreme zones (overbought/oversold), thereby filtering out many false signals and improving trading accuracy.
## Core Principles
### 1. **Dual Confirmation Mechanism**
This indicator doesn't use MACD or RSI alone, but requires both conditions to be met simultaneously:
- **Short Signal (Orange Triangle)**: MACD bearish crossover (fast line crosses below signal line) + RSI was overbought (≥71)
- **Long Signal (Green Triangle)**: MACD bullish crossover (fast line crosses above signal line) + RSI was oversold (≤29)
### 2. **RSI Memory Function**
The indicator checks the RSI values of the current and past 5 candlesticks. As long as any one of them reaches the overbought/oversold level, the condition is satisfied. This design avoids overly strict requirements, as RSI may have already left the extreme zone before the MACD crossover occurs.
```pine
wasOversold = rsi <= 29 or rsi <= 29 or ... or rsi <= 29
wasOverbought = rsi >= 71 or rsi >= 71 or ... or rsi >= 71
```
## Parameter Settings
### MACD Parameters
- **Fast MA**: 12 periods (adjustable 7-∞)
- **Slow MA**: 26 periods (adjustable 7-∞)
- **Signal Line**: 9 periods
### RSI Parameters
- **Oversold Threshold**: 29 (traditional 30)
- **Overbought Threshold**: 71 (traditional 70)
- **Calculation Period**: 14
## Visual Elements
### 1. **Signal Markers**
- 🔻 **Orange Downward Triangle**: Appears above the candlestick, labeled "overbought", indicating a shorting opportunity
- 🔺 **Green Upward Triangle**: Appears below the candlestick, labeled "oversold", indicating a long opportunity
### 2. **Price Level Lines**
- **Orange Dashed Line**: Extends rightward from the high of the short signal, serving as a potential resistance level
- **Green Dashed Line**: Extends rightward from the low of the long signal, serving as a potential support level
Each time a new signal appears, the old level line is deleted, keeping only the most recent reference line.
## Trading Logic Explained
### Short Signal Scenario
1. Price rises, RSI surges above 71 (market overheated)
2. Momentum subsequently weakens, MACD fast line crosses below signal line
3. Indicator draws an orange triangle at the high, alerting to reversal risk
4. Orange dashed line marks the high point of the short entry position
### Long Signal Scenario
1. Price falls, RSI drops below 29 (market oversold)
2. Selling pressure exhausted, MACD fast line crosses above signal line
3. Indicator draws a green triangle at the low, suggesting a rebound opportunity
4. Green dashed line marks the low point of the long entry position
## Advantages and Limitations
### ✅ Advantages
- **Filters Noise**: Reduces false signals through dual confirmation
- **Captures Reversals**: Catches trend reversals in extreme conditions
- **Visual Clarity**: Level lines help identify support/resistance
- **Built-in Alerts**: Can set up message push notifications
### ⚠️ Limitations
- **Lag**: Both indicators are lagging, signals may be delayed
- **Poor Performance in Ranging Markets**: Prone to whipsaws during consolidation
- **Needs Other Analysis**: Should not be the sole decision-making basis
- **Parameter Sensitivity**: Different markets and timeframes may require parameter adjustments
## Practical Trading Suggestions
1. **Confirm Trend Context**: Counter-trend signals carry high risk in strong trending markets
2. **Combine with Candlestick Patterns**: Confirm with patterns (such as engulfing, hammer candles)
3. **Set Stop Losses**: Use level lines as stop-loss references (long stop below green line, short stop above orange line)
4. **Watch Volume**: Signals accompanied by high volume are more reliable
5. **Multi-Timeframe Verification**: Signals appearing simultaneously on daily and 4-hour charts are more credible
## Summary
This indicator follows the "mean reversion from extremes" philosophy, seeking reversal opportunities when market sentiment becomes excessive. It's suitable for auxiliary judgment, particularly in swing trading and position trading strategies. But remember, no indicator is perfect—always combine risk management and multi-dimensional analysis when making trading decisions

Heikin Ashi & Swing Highs/LowsHeikin Ashi & Swing Highs/Lows
Indicator Description:
The "Heikin Ashi & Swing Highs/Lows" indicator combines Heikin Ashi candle analysis with the identification of significant swing highs and lows on the chart. This indicator is useful for traders looking to spot trend changes and key points in the market.
Key Features:
Heikin Ashi:
Calculation and Visualization: Utilizes the Heikin Ashi method to smooth out the candlestick chart, helping to visualize trends and reduce market noise. Heikin Ashi candles are calculated from the standard candles (Open, High, Low, Close) and are displayed on the chart with a green color for bullish signals and red for bearish signals.
Vertical Offset Adjustment: Provides options to adjust the vertical offset of the candles based on the selected timeframe, with specific adjustments for short, medium, long, and super-long periods.
Swing Highs/Lows:
Key Point Identification: Marks significant swing highs and lows on the chart using a configurable period. Swing highs are displayed in red and swing lows in green.
Candlestick Patterns: Detects and labels common candlestick patterns such as:
Hammer: A bullish candlestick pattern with a small body and a long lower wick.
Inverted Hammer: Similar to the Hammer, but with a long upper wick.
Bullish Engulfing: A two-candle pattern where a bullish candle completely engulfs a previous bearish candle.
Hanging Man: A bearish pattern with a small body and a long lower wick, appearing at the end of an uptrend.
Shooting Star: A bearish pattern with a small body and a long upper wick, appearing at the end of an uptrend.
Bearish Engulfing: A two-candle pattern where a bearish candle completely engulfs a previous bullish candle.
Settings:
Timeframe: Allows you to select the desired timeframe to adjust the Heikin Ashi candle analysis.
Vertical Offset: Customize the vertical offset of Heikin Ashi candles based on the selected timeframe.
Swing Point Style: Configure the colors of the significant swing highs and lows on the chart.
Recommended Use:
This indicator is ideal for traders looking for a clear representation of trends through Heikin Ashi candles and who want to identify key reversal points in the market by detecting swing highs/lows and candlestick patterns.
Benefits:
Facilitates the identification of smooth trends and trend reversals.
Provides a clear visual representation of critical market points.
Helps traders recognize important candlestick patterns that may indicate changes in market direction.

Trendy Bar Trend ColorTrendy Bar Trend Color
Inspired by trend candlestick charts on other trading platforms. Changes bar colors to stay in trend much like Heikin Ashi candles without the ATR price distortion. This is done by comparing the HL2 and/or Open-Close values of current candlestick to the prior candlestick.

RSI CANDLESTICKSDisplays RSI indicator as candlesticks. Does candlestick pattern analysis apply to RSI? Can it aid in candlestick analysis on a price chart? Let's start a discussion.

Smart FlexRange Breakout [The_lurker]The Smart FlexRange Breakout tool aims to identify trading opportunities based on price breakouts of dynamic levels (CALL, PUT) with a dotted centerline and the ability to select the applicable market. The tool relies on candlestick analysis over a specific time period (such as 3 hours). Candle data (searchHours) is collected to identify the most significant candle based on candlestick patterns and trading volume during the selected timeframe. Breakout levels and take-profit (TP) targets are then plotted, along with buy and sell signals, breakout notifications, and up/down trend lines based on Pivot Points.
The tool is run according to the selected timeframe.
Practical Use
1- Setup: Adjust the market, timeframe, number of hours, and time zone to suit the trader's needs.
2- Trading: Monitor signals (BUY/SELL) and TP levels to determine entry and exit points.
3- Trend Lines: Use them to understand the overall trend and confirm signals.
---
1. Objective: Identify trading opportunities based on price breakouts
- Trading opportunities: The indicator is designed to help traders identify moments when significant price movements are likely, allowing them to enter buy or sell trades based on market changes.
- Price breakouts: The indicator focuses on moments when prices break through key levels (resistance or support). A breakout occurs when the price exceeds a resistance level (up) or breaks a support level (down), indicating a potential continuation of the movement in the same direction.
- Dynamic: Resistance and support levels are not static; rather, they are calculated based on candlestick analysis over a specific period of time, making them adaptive to current market conditions.
---
2. Dynamic levels (resistance and support levels)
- Resistance levels: These represent prices that the price is difficult to break above, defined here as the high of the most significant candle during the specified period.
- Support levels: These represent prices below which the price is difficult to fall, defined as the low of the most significant candle.
- Dynamic: These levels are recalculated every new search period (searchHours), meaning they change based on the latest market data, unlike traditional static levels.
---
3. Adding a Dotted Center Line
- Center Line: A horizontal dotted line is drawn at the midpoint between the high and low of the most significant candle.
- Purpose:
- Provides a visual reference point for determining the current price position relative to support and resistance levels.
- Helps assess whether the price is moving toward a breakout (near resistance) or a breakout (near support).
- Dotted: The dotted pattern distinguishes it from the solid upper and lower lines, making it easier to distinguish visually.
---
4. Relying on candlestick analysis over a specific time period (searchHours)
- Candlestick Analysis: The indicator examines candlesticks to determine which ones have the most influence on price movement.
- Timeframe (searchHours):
- The user specifies the number of hours (1-6) for candle analysis, which determines the range of data the indicator relies on.
- Example: If searchHours = 3 and timeframe = 30 minutes, 6 candles are analyzed (3 hours ÷ 30 minutes).
- Flexibility: This period can be adjusted to suit different markets (such as volatile cryptocurrencies or more stable Forex).
---
5. Determining the Most Important Candle Based on Candle Patterns and Volume
- The most important candle: is the candle believed to have the greatest impact on price movement based on specific criteria.
- Candle Patterns:
- Candles are analyzed using a candlestick pattern library (such as Engulfing, Hammer, Doji).
- Reversal patterns (such as Morning Star, Shooting Star) are given a high importance score (100 points) because they indicate potential trend changes.
- Trading Volume:
- The trading volume of each candle is measured and compared to the maximum and minimum during the period.
- Volume is calculated as a percentage (0-100) and added to the pattern score to determine the most significant candle.
- Result: The candle with the highest score (patterns + volume) is used to determine support and resistance levels.
---
6. Timeframe
- Time interval: The user selects a time frame for the candles (15, 30, or 60 minutes).
- Importance:
- Determines the number of candles analyzed during the searchHours period.
- Affects the accuracy and speed of the signals (shorter timeframe = faster but less reliable signals; longer timeframe = slower but more reliable signals).
- Example: If the timeframe is 60 minutes and searchHours is 3, only 3 candles are analyzed.
---
7. Drawing Breakout Levels and Take Profit Targets (TP)
- Breakout Levels:
- Upper line (resistance): Drawn at the highest price of the most significant candle and is labeled "CALL".
- Lower line (support): Drawn at the lowest price of the most important candle and is called "PUT."
- These lines represent levels where a breakout is expected to lead to a strong price movement.
- Take Profit Targets (TP):
- Up to 8 bullish (above the upper line) and bearish (below the lower line) TP levels are calculated.
- They are calculated based on a percentage (tpPercentage) added or subtracted from the base lines.
- Example: If tpPercentage = 0.6% and the high price = 100, then bullish TP1 = 100.6, TP2 = 101.2, etc.
- Labels: Labels are drawn for each TP level indicating the value and level (TP1, TP2, etc.).
---
8. Buy and Sell Signals
- Buy (BUY) signal:
- Generated when the price breaks the upper line (ta.crossover).
- The "BUY" label is drawn with the redrawing of the TP levels.
- Sell signal (SELL):
- Generated when the price breaks the lower line (ta.crossunder).
- The "SELL" label is drawn with the redrawing of the TP levels.
- Purpose: To provide clear signals to the trader for making trade entry decisions.
=========================================================================
Thank you, n00btraders.
For using the import library: n00btraders/Timezone/1
For using the import library: The_lurker/AllCandlestickPatternsLibrary/1
========================================================================
Disclaimer:
The information and publications are not intended to be, nor do they constitute, financial, investment, trading, or other types of advice or recommendations provided or endorsed by TradingView.
تهدف أداة Smart FlexRange Breakout إلى تحديد فرص التداول بناءً على اختراقات الأسعار للمستويات الديناميكية (CALL، PUT) مع خط مركزي منقط، مع إمكانية اختيار السوق المناسب. تعتمد الأداة على تحليل الشموع اليابانية على مدى فترة زمنية محددة (مثل 3 ساعات). تُجمع بيانات الشموع (searchHours) لتحديد أهم شمعة بناءً على أنماط الشموع وحجم التداول خلال الإطار الزمني المحدد. ثم تُرسم مستويات الاختراق وأهداف جني الأرباح (TP)، بالإضافة إلى إشارات البيع والشراء، وإشعارات الاختراق، وخطوط الاتجاه الصعودي/الهبوطي بناءً على نقاط المحور.
يتم تشغيل الاداه حسب الفاصل المختار timeframe
الاستخدام العملي
1- الإعداد: اضبط السوق، والإطار الزمني، وعدد الساعات، والمنطقة الزمنية لتناسب احتياجات المتداول.
2- التداول: راقب إشارات (الشراء/البيع) ومستويات جني الأرباح لتحديد نقاط الدخول والخروج.
3- خطوط الاتجاه: استخدمها لفهم الاتجاه العام وتأكيد الإشارات.
1. الهدف: تحديد فرص التداول بناءً على اختراقات الأسعار
- فرص التداول: صُمم هذا المؤشر لمساعدة المتداولين على تحديد اللحظات التي يُحتمل فيها حدوث تحركات سعرية كبيرة، مما يسمح لهم بالدخول في صفقات شراء أو بيع بناءً على تغيرات السوق.
- اختراقات الأسعار: يُركز المؤشر على اللحظات التي تخترق فيها الأسعار مستويات رئيسية (مقاومة أو دعم). يحدث الاختراق عندما يتجاوز السعر مستوى مقاومة (صعودًا) أو يخترق مستوى دعم (هبوطًا)، مما يُشير إلى احتمال استمرار الحركة في نفس الاتجاه.
- ديناميكي: مستويات المقاومة والدعم ليست ثابتة؛ بل تُحسب بناءً على تحليل الشموع اليابانية على مدى فترة زمنية محددة، مما يجعلها مُكيفة مع ظروف السوق الحالية.
2. المستويات الديناميكية (مستويات المقاومة والدعم)
- مستويات المقاومة: تُمثل هذه الأسعار التي يصعب على السعر تجاوزها، وتُعرف هنا بأنها ارتفاع الشمعة الأكثر أهمية خلال الفترة المحددة.
- مستويات الدعم: تُمثل هذه الأسعار التي يصعب على السعر الانخفاض دونها، وتُعرف بأنها أدنى مستوى للشمعة الأكثر أهمية.
- ديناميكي: تُعاد حساب هذه المستويات مع كل فترة بحث جديدة (ساعات البحث)، مما يعني أنها تتغير بناءً على أحدث بيانات السوق، على عكس المستويات الثابتة التقليدية.
3. إضافة خط مركزي منقط
- خط المركز: يُرسم خط أفقي منقط عند نقطة المنتصف بين أعلى وأدنى شمعة ذات أهمية.
- الغرض:
- يوفر نقطة مرجعية بصرية لتحديد وضع السعر الحالي بالنسبة لمستويات الدعم والمقاومة.
- يساعد في تقييم ما إذا كان السعر يتحرك نحو اختراق (بالقرب من المقاومة) أو اختراق (بالقرب من الدعم).
- منقط: يُميزه النمط المنقط عن الخطوط العلوية والسفلية المتصلة، مما يُسهّل تمييزه بصريًا.
4. الاعتماد على تحليل الشموع اليابانية على مدى فترة زمنية محددة (ساعات البحث)
- تحليل الشموع اليابانية: يفحص المؤشر الشموع اليابانية لتحديد أيها الأكثر تأثيرًا على حركة السعر.
- الإطار الزمني (ساعات البحث):
- يُحدد المستخدم عدد الساعات (من 1 إلى 6) لتحليل الشموع، والذي يُحدد نطاق البيانات التي يعتمد عليها المؤشر.
- مثال: إذا كانت ساعات البحث = 3 والإطار الزمني = 30 دقيقة، فسيتم تحليل 6 شموع (3 ساعات ÷ 30 دقيقة).
- المرونة: يُمكن تعديل هذه الفترة لتناسب الأسواق المختلفة (مثل العملات المشفرة المتقلبة أو سوق الفوركس الأكثر استقرارًا).
5. تحديد الشمعة الأكثر أهمية بناءً على أنماط الشموع وحجم التداول
- الشمعة الأكثر أهمية: هي الشمعة التي يُعتقد أن لها التأثير الأكبر على حركة السعر بناءً على معايير محددة.
- أنماط الشموع:
- يتم تحليل الشموع باستخدام مكتبة أنماط الشموع (مثل شمعة الابتلاع، وشمعة المطرقة، وشمعة الدوجي).
- تُمنح أنماط الانعكاس (مثل نجمة الصباح، ونجم الشهاب) درجة أهمية عالية (100 نقطة) لأنها تُشير إلى تغيرات محتملة في الاتجاه.
- حجم التداول:
- يُقاس حجم تداول كل شمعة ويُقارن بالحد الأقصى والأدنى خلال الفترة.
- يُحسب الحجم كنسبة مئوية (0-100) ويُضاف إلى درجة النمط لتحديد الشمعة الأكثر أهمية.
- النتيجة: تُستخدم الشمعة ذات أعلى درجة (الأنماط + الحجم) لتحديد مستويات الدعم والمقاومة.
٦. الإطار الزمني
- الفاصل الزمني: يختار المستخدم إطارًا زمنيًا للشموع (١٥، ٣٠، أو ٦٠ دقيقة).
- الأهمية:
- يحدد عدد الشموع المُحللة خلال فترة ساعات البحث.
- يؤثر على دقة وسرعة الإشارات (الإطار الزمني الأقصر = إشارات أسرع ولكن أقل موثوقية؛ الإطار الزمني الأطول = إشارات أبطأ ولكن أكثر موثوقية).
- مثال: إذا كان الإطار الزمني ٦٠ دقيقة وساعات البحث ٣، فسيتم تحليل ٣ شموع فقط.
---
٧. رسم مستويات الاختراق وأهداف جني الأرباح (TP)
- مستويات الاختراق:
- الخط العلوي (المقاومة): يُرسم عند أعلى سعر للشمعة الأكثر أهمية ويُسمى "CALL".
- الخط السفلي (الدعم): يُرسم عند أدنى سعر للشمعة الأكثر أهمية ويُسمى "PUT".
- تمثل هذه الخطوط المستويات التي يُتوقع أن يؤدي فيها الاختراق إلى حركة سعرية قوية.
- أهداف جني الأرباح (TP):
- يتم حساب ما يصل إلى 8 مستويات جني أرباح صعودية (فوق الخط العلوي) وهبوطية (تحت الخط السفلي).
- يتم حسابها بناءً على نسبة مئوية (tpPercentage) تُضاف أو تُطرح من خطوط الأساس.
- مثال: إذا كانت نسبة جني الأرباح = 0.6% وكان أعلى سعر = 100، فإن هدف الربح الصعودي الأول = 100.6، وهدف الربح الثاني = 101.2، وهكذا.
- العلامات: تُرسم علامات لكل مستوى جني أرباح تشير إلى القيمة والمستوى (TP1، TP2، وهكذا).
---
8. إشارات الشراء والبيع
- إشارة الشراء (BUY):
- تُولّد عند اختراق السعر للخط العلوي (ta.crossover).
- تُرسم علامة "الشراء" مع إعادة رسم مستويات جني الأرباح.
- إشارة البيع (SELL):
- تُولّد عند اختراق السعر للخط السفلي (ta.crossunder). - يُرسم مؤشر "بيع" مع إعادة رسم مستويات جني الأرباح.
- الغرض: توفير إشارات واضحة للمتداول لاتخاذ قرارات دخول الصفقة.
==========================================================================
شكرًا لكم، أيها المتداولون الجدد.
لاستخدام مكتبة الاستيراد: n00btraders/Timezone/1
لاستخدام مكتبة الاستيراد: The_lurker/AllCandlestickPatternsLibrary/1
==============================================================================
إخلاء مسؤولية:
لا يُقصد بهذه المعلومات والمنشورات أن تكون، ولا تُشكل، نصائح أو توصيات مالية أو استثمارية أو تجارية أو أي نوع آخر من النصائح أو التوصيات المُقدمة من TradingView أو المُعتمدة منها.
