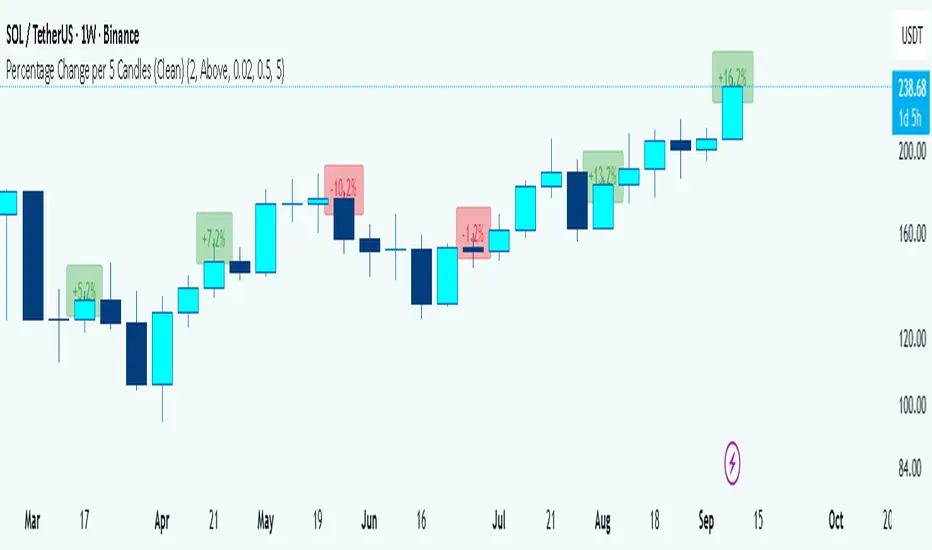
RSI TREND FILTERRSI TREND Filter on Chart
RSI scaled to fit on chart instead of oscillator, Trend Analysis is easy and Hidden Divergence is revealed using this indicator. This indicator is an aim to reduce confusing RSI Situations. The Oversold and Overbought lines help to determine the price conditions so its easy to avoid Traps.
Oversold and Overbought conditions are marked on Chart to make it useful to confirm a Buy or Sell Signals.
RSI 50 level is plotted with reference to EMA50 and Oversold and Overbought Conditions are calculated accordingly.
Uptrend: RSI Cloud / Candles above RSI 50 Level
Down Trend: RSI Cloud / Candles below RSI 50 Level
Sideways : Candles in the Gray Area above and below RSI 50 Level
Default RSI (14) : is the Candlestick pattern itself
Disclaimer: Use Solely at your own Risk.
Поиск скриптов по запросу "Candlestick"

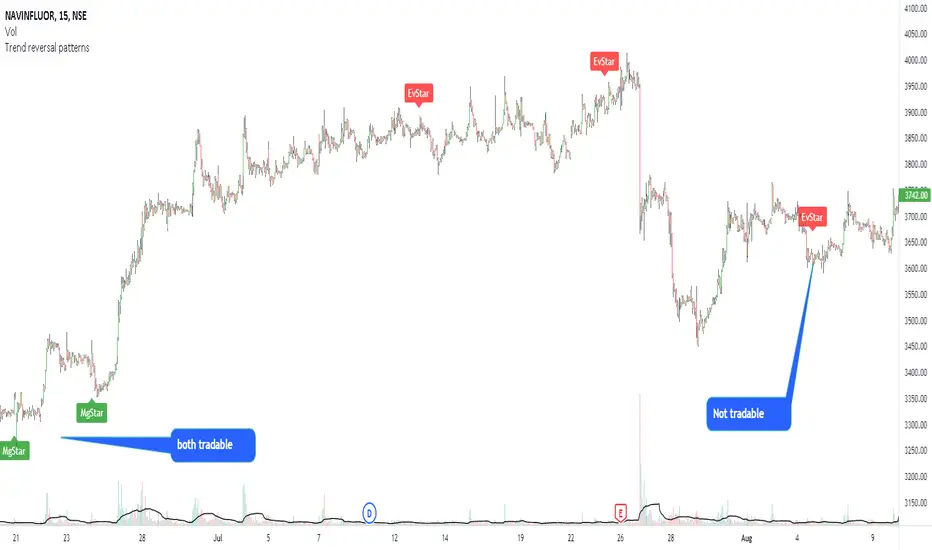
Modified morning and evening starsThis script highlights modified version of evening and morning star candlestick patterns. Volume has also been added in the script to create convergence of volume with price action.
It is recommended to use these patterns for positional trading. It is advised to use
Morning star at the bottom of the downtrend
Evening star at the top of the uptrend
Avoid entries against above recommendations
Tick ChartHello All,
Tick Chart is created using ticks and each candlestick in Tick Chart shows the price variation of X consecutive ticks ( X : Number of Ticks Per Candle ). for example if you set Number of Ticks Per Candle = 100 then each candlestick is created using 100 ticks. so, Tick Charts are NOT time-based charts (like Renko or Point & Figure Charts). Tick is the price change in minimum time interval defined in the platform. There are several advantages of Tick Charts. You can find many articles about Tick Charts on the net.
Tick Chart only works on realtime bars.
You can set " Number of Ticks Per Candle " and " Number of Candles" using options. You can change color of body, wicks abd volume bars as well.
The script shows current, minimum, maximum and average volumes. it also shows OHLC values on the last candle.
Tick Chart using different number of ticks
Volume info:
Enjoy!

Binary Options Arrows (example)An example of Binary Option Arrows (BOA) for candlestick patterns bearish and bullish harami.
With results as coloured background and an option to choose your expiration (one candle by default).
It's just an example for those who has their own strategy and wants to make nice arrows in their chart.
All you need to do is rewrite piece of script in lines 9:13 - feel free to ask me for any help.
Disclaimer: It's just an example how to script arrows for binary option trading, Poshtrader is not responsible for any loss of money by using this particular strategy.
Happy Trading

Ichimoku Signal + Candle Color + Candle Pattern1. Ichimoku Signal:
Bullish Signal:
- UP-S: A strong bullish signal occurs when the Tenkan Sen crosses from below to above the Kijun Sen and the cross is above the Kumo.
- UP: An neutral bullish signal occurs when the Tenkan Sen crosses from below to above the Kijun Sen and the cross is in the Kumo.
- UP-W: A weak bullish signal occurs when the Tenkan Sen crosses from below to above the Kijun Sen and the cross is bellow the Kumo.
- Fly: A strong bullish signal when Chikou Span raise above the Kumo.
Bearish Signal:
- DN-S: A strong bearish signal occurs when the Tenkan Sen crosses from above to bellow the Kijun Sen and the cross is bellow the Kumo.
- DN: An neutral bearish signal occurs when the Tenkan Sen crosses from above to bellow the Kijun Sen and the cross is in the Kumo.
- DN-W: A weak bearish signal occurs when the Tenkan Sen crosses from above to bellow the Kijun Sen and the cross is above the Kumo.
- Dig: A strong bearish signal when Chikou Span fall bellow the Kumo.
2. Candle Color based on RSI (from NazcaProjections)
- Yellow represents Super OverBought
- Lime Green represents OverBought
- Green represents Slightly OverBought
- Red represents Slightly OverSold
- Dark Red represents OverSold
- Gray White represents Super OverSold
3. Candlestick Patterns Identified: Doji , Evening Star , Morning Star , Shooting Star , Hammer , Inverted Hammer , Bearish Harami, Bullish Harami, Bearish Engulfing , Bullish Engulfing

[ROC3] Rate of Change Candle ColorROC is a statistical indicator which tracks how much a security's price has changed over a certain period, showing whether momentum is picking up or slowing down. It’s a handy tool because it helps traders spot trend changes and understand how strong a trend is.
My ROC3 indicator will color the candlesticks based on the Rate of Change (ROC) and its Exponential Moving Average (EMA). This indicator helps traders visually identify bullish and bearish trends by applying color to the candles, making it easier to spot momentum shifts and trend changes.
How It Works:
Rate of Change (ROC): Calculates the percentage change in the price over a specified number of bars. This indicator measures the speed at which price changes.
EMA of ROC: Applies an Exponential Moving Average to the ROC values to provide a smoothed benchmark. The EMA helps to reduce noise and make trend identification more reliable.
Coloring Logic:
Bullish Candles (Green): When the current ROC is higher than the EMA of the ROC.
Bearish Candles (Red): When the current ROC is lower than the EMA of the ROC.
Settings:
ROC Length (Default: 60): The number of bars used to calculate the Rate of Change. Adjust this parameter to change the sensitivity of the ROC calculation.
ROC EMA Length (Default: 7): The number of bars used to calculate the Exponential Moving Average of the ROC. This length determines how smooth the EMA is. A shorter length reacts faster to price changes, while a longer length provides a smoother, slower response.
How to Use:
Apply the Indicator: Add the Rate of Change Candle Color indicator to your TradingView chart.
Interpret the Colors:
Green Candles: Indicate bullish momentum. The current ROC is greater than its EMA, suggesting upward pressure.
Red Candles: Indicate bearish momentum. The current ROC is less than its EMA, suggesting downward pressure.
Adjust Settings: Customize the ROC Length and ROC EMA Length based on your trading strategy. Shorter ROC lengths may capture more short-term trends, while longer lengths provide a broader view.
Combine with Other Indicators: Use the in conjunction with other technical indicators or chart patterns to enhance your trading analysis.
Example Use Case:
Trend Confirmation: Use the color changes to confirm bullish or bearish trends. Green candles can confirm uptrends, while red candles may signal downtrends or potential reversals.
Momentum Analysis: Monitor how frequently the ROC crosses above or below its EMA to gauge momentum strength and make informed trading decisions.
Note:
This indicator is designed to assist with trend analysis and should be used as part of a broader trading strategy. Always conduct your own research and analysis before making trading decisions.
Cherio...

Zig Zag+ (Macro + Internal Structure Tool)ZigZag+ (Macro + Internal Structure Tool)
ZigZag+ is a simple tool that helps traders to clearly identify and differentiate between macro and internal market structure, to help you keep your bearings of where you are currently in the overall picture.
It is especially difficult to keep your bearings within the larger structural trend when trading the lower timeframes, where for example, a bearish structural trend on a lower timeframe may simply be a retracement of an overall bullish structural trend on a higher timeframe. This indicator primarily aims to help traders maintain awareness of where they are in relationship to the higher timeframe / 'macro' structural trend, and their most significant swing point highs and lows.
The features of this indicator include:
- 2x Zig Zag lines drawn automatically onto your chart. One which has a longer length than the other, which can be used to help identify and differentiate the larger price swings from the smaller price swings found within it. Enabled by default.
- Customisable Zig Zag line color & width settings to help clearly differentiate the higher timeframe 'macro structure' apart from the lower timeframe 'internal structure' within it, enabling it to be tailored to suit your chart colour theme and personal preference.
- Customisable individual length settings for the 2x Zig Zag lines, to allow the fine tuning of each line to any timeframe and asset. By default one lines length is set to a higher value than the other, to illustrate a macro structure (higher length value) as well as the 'internal structure' (lower value length), seen within the larger macro structure.
- Up to a maximum of 500 lines can be drawn meaning you can zoom out considerably, and view historical price action with both Zig Zag lines continuing to print.
- Custom alerts for identifying candlesticks that can offer optimal entries where they are found within valid price markups or markdowns that are already underway. Further details can be found within the tooltips for these signals.
Note: The above list of features are accurate at the time of publishing, but may be updated or added to in future.
Structure
Understanding structure is arguably the foundation of all trading strategies, and therefore very important to understand where you are exactly in the bigger picture, since it can help identify levels at which there is a higher probability of price moving either upward or downward at a given point. Structural trend refers to the typical way that price tends to move in any given trending market, identified by the continuation of higher highs and higher lows in a typical bullish trending market, and lower highs and lower lows in a bearish trending market.
During other times price may not be trending in this way, for example when it is undergoing accumulation or distribution phases, where the consistent higher high & lower low / lower high and lower low patterns will not be evident.
What is Macro Structure?
Macro trend structure refers to the structural trend seen on higher timeframe charts.
What is Internal Structure?
Internal trend structure refers to the structural trend seen on lower timeframe charts, which is found within the higher timeframe structure.
Disclaimer: This indicator is adapted from an original script authored by Tr0sT . With special thanks.

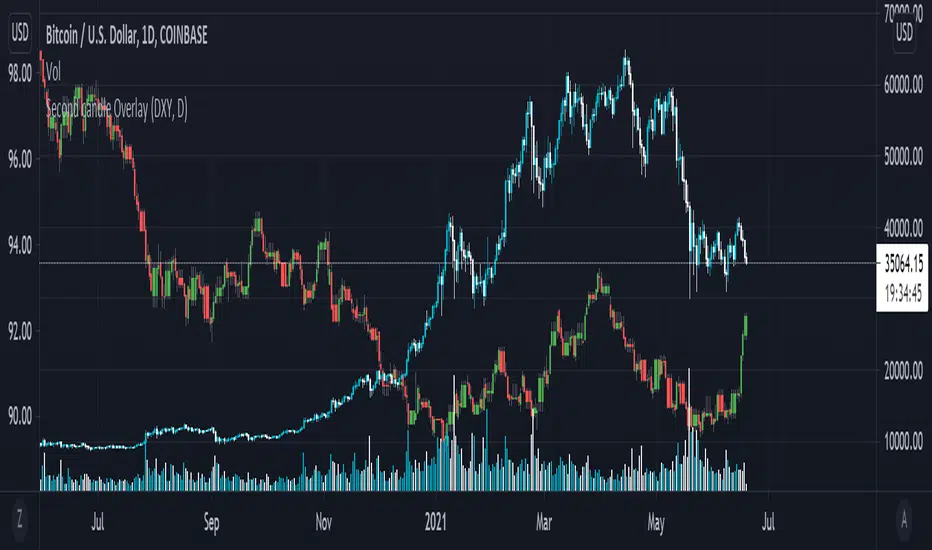
Secondary Candle OverlayThis simple script is meant to allow the user to select another symbol to add onto their chart and plot the candlesticks for that symbol at the selected resolution requested.
Please see the tooltip provided by the 'Secondary Symbol' input for more details with regards to properly using this script on symbols that have vastly different valuations, it will help with getting the symbol requested to scale properly with the primary symbol on the chart.
The user may also input which colors are used for bullish/bearish candles as well as the symbol itself and its resolution.
IMPORTANT NOTE: THIS SCRIPT DOES NOT ACCOUNT FOR SYMBOLS THAT ARE NOT CONTINUOUS (The defval for the symbol is TVC:DXY which closes on weekends whereas a cryptocurrency like Bitcoin does not stop trading ever; candles on these kinds of markets will be repeated when overlaid onto markets that do not have this property.)
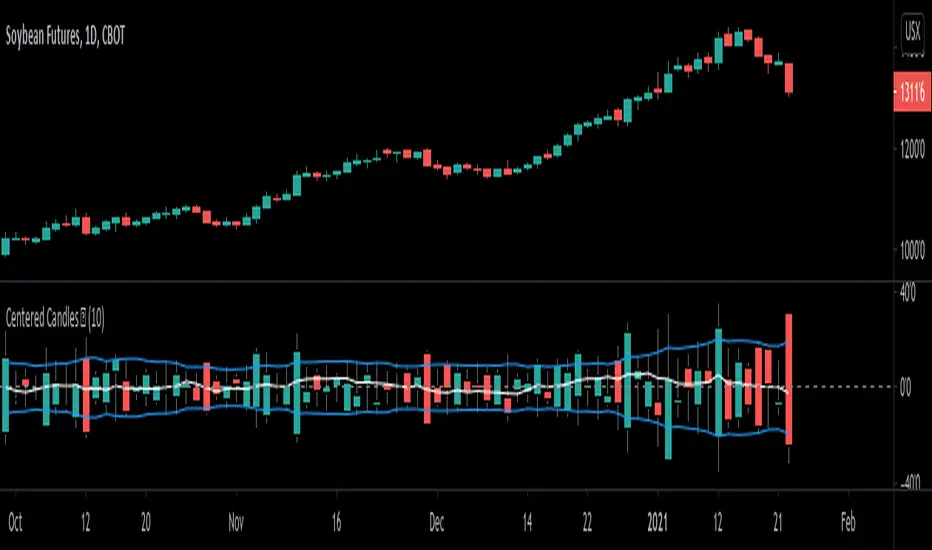
Centered Candles [racer8]Brief 💜
This indicator allows users to more easily compare candlesticks by centering them along a zero line.
Also, I've added some moving average lines for the highs, lows, and closes for these centered candles.
Enjoy 😉
Popgun Bar PatternI created this script to research the trading effectiveness of the Popgun Bar Pattern.
The Popgun Bar Pattern is found when 3 candlesticks in order form the following pattern:
0. Any bar that is then followed by:
1. An inside bar. This is a bar that is completely engulfed by the bar before it. It will have a lower high and a higher low than the previous bar.
2. An outside bar immediately after. This is a bar that completely engulfs the prior inside bar. It will have a higher high and a lower low than the previous bar.
Simply put, the Popgun Bar Pattern is an inside bar followed by an outside bar.
I would highly recommend incorporating this signal as a "trigger" for existing technical analysis. Used in isolation it may not have a high probability of success.
To make it more effective as a trigger to a trading signal I incorporated into my code an Entry, Stop, and a Target dot.
The Entry dot is offset from the low of a bearish Popgun Bar Pattern or the high of a bullish Popgun Bar Pattern by a factor of ATR. The default ATR percentage is 33% but can be adjusted.
The Stop dot is based on the recent highest high (bearish) or lowest low (bullish) of a set range (default is 9 bars) plus/minus the ATR percentage buffer.
The Target dot is automatically calculated from the entry based on a configurable reward factor (default is 3) from the entry to stop distance. This projects a potential 3:1 reward/risk trade by default.
There is an additional alert condition which can be configured at the end of the script.

FREE TRADINGVIEW FOR TIMEFRAMESWhen doing i.e the 3 minute timeframe turn on the closest timeframe available for you or the candles and wicks will be fucked up.
So if you're doing the 5 hour timeframe candles turn on the 4hr chart on your main chart.
To View the candles in full screen double click the windows with the candlesticks
If you don't have TradingView premium and want to look at custom timeframes you can use this.
For the ticker/coin/pair you want to show enter it like this:
For stocks, only the ticker i.e: MSFT, APPL
For Crypto, "Exchange:ticker" i.e: BITFINEX:BTCUSD, BINANCE:AGIBTC, BITMEX:ADAM19
When setting up the timeframe write i.e:
For minutes/hourly: 5, 240 (4 hour), 360 (6 hour)
For daily/weekly/monthly: 1D, 2W, 3M
When doing i.e the 3 minute timeframe turn on the closest timeframe available for you or the candles and wicks will be fucked up.
So if you're doing the 5 hour timeframe candles turn on the 4hr chart on your main chart.

UCS_S_Steve Primo - Strategy #5 (FOREX Only)Here we have another Steve Primo Strategy ( #5)
This is a short term, trend continuation strategy, Recommend using this on 30 Mins + time frames.
I have added few things.
1. PET-D filter, to identify the trend along with the SMA 50. ----> Setup in line with PET-D (EMA,15) trend confirmation.
2. Option for Harami Candle identification (may not be Steve Primo Setup), There is no evidence on any of the videos listed below for Harami or other candlesticks pattern.
Future - Planned to add other candle patterns.
Videos from Youtube
1. www.youtube.com -
2. www.youtube.com - Hints disclosed on this video.
3. www.youtube.com - Claims this is his GO TO strategy for FOREX.
4. www.youtube.com - Complete Free Lesson.
Note - I did not buy this Strategy, I do not own in any way shape or form of this strategy as presented in the videos, The Strategy I am posting is my interpretation based on Steve Primo's videos listed above and few more on youtube.
Good Luck folks.

HADYAN NEW SCALPING V 2.9//@version=5
indicator(title='HADYAN NEW SCALPING V 2.9', overlay=true, max_lines_count=500, max_labels_count=500, max_boxes_count=500)
// ====================================================================================================
// BAGIAN 1: PENGATURAN UTAMA & LOGIKA INTI
// ====================================================================================================
styleGroup = 'Gaya Trading (Trading Style)'
tradingStyle = input.string('Mencuri Profit', title='Pilih Gaya Trading', options= , group=styleGroup)
// --- FITUR ANTI-KEDIP ---
useConfirmedBar = input.bool(true, title='✅ Sinyal Anti-Kedip (Tunggu Close)?', group=styleGroup)
a_custom = input.float(1.0, title='Key Value (Custom)', group=styleGroup)
c_custom = input.int(10, title='ATR Period (Custom)', group=styleGroup)
var float a = 1.0
var int c = 10
// Variabel filter internal
var bool _useEmaFilter = false
var bool _useRsiFilter = false
var bool _useCandleFilter = false
var bool _useVolumeFilter = false
var bool _useAdxFilter = false
var bool _useSnrFilter = false
miscGroup = 'Pengaturan Filter (Tanpa Ghost)'
waspadaFactor = input.float(0.75, title='Waspada - Faktor Jarak ATR', group=miscGroup)
tamakFactor = input.float(3.0, title='Jangan Tamak - Faktor Jarak ATR', group=miscGroup)
// --- FILTER TREN (EMA) ---
useEmaFilter = input.bool(false, title='Gunakan Filter Tren EMA Cross?', group=miscGroup)
emaFastLen = input.int(21, title='Periode EMA Cepat', group=miscGroup)
emaSlowLen = input.int(50, title='Periode EMA Lambat', group=miscGroup)
mtfTimeframe = input.string('15', title='Timeframe MTF', group=miscGroup)
// --- FILTER MOMENTUM ---
useRsiFilter = input.bool(false, title='Gunakan Filter Momentum RSI?', group=miscGroup)
rsiFilterLen = input.int(14, title='Periode RSI', group=miscGroup)
rsiBuyLevel = input.float(50.0, title='RSI Buy Level (Min)', group=miscGroup)
rsiSellLevel = input.float(50.0, title='RSI Sell Level (Max)', group=miscGroup)
rsiReversalLevel = input.float(70.0, title='RSI Reversal Level (70/30)', group=miscGroup)
// --- FILTER LAIN ---
useCandleFilter = input.bool(false, title='Gunakan Filter Pola Candlestick?', group=miscGroup)
useVolumeFilter = input.bool(false, title='Gunakan Filter Volume?', group=miscGroup)
volumeLen = input.int(20, title='Periode Volume MA', group=miscGroup)
volumeThreshold = input.float(0.3, title='Min. Volume Factor', group=miscGroup)
// --- FILTER SNR ---
useSnrFilter = input.bool(false, title='Gunakan Filter Support/Resistance (SNR)?', group=miscGroup)
snrLookback = input.int(10, title='Pivot Lookback (SNR)', group=miscGroup)
snrDistanceFactor = input.float(2.0, title='Jarak Max ke S/R (xATR)', group=miscGroup)
// --- FILTER ADX ---
useAdxFilter = input.bool(false, title='Gunakan Filter Kondisi Pasar (ADX)?', group=miscGroup)
adxLen = input.int(14, title='Periode ADX', group=miscGroup)
adxMinLevel = input.float(15.0, title='ADX Min. Level', group=miscGroup)
// ** PENGATURAN MANAJEMEN RISIKO **
riskGroup = 'Manajemen Risiko'
useAutoBreakeven = input.bool(true, title='Gunakan Auto Breakeven?', group=riskGroup)
breakevenFactor = input.float(1.0, title='Breakeven Factor (Dalam R/ATR)', group=riskGroup)
// ==============================================
// --- INPUT FITUR TAMBAHAN ---
// ==============================================
meterGroup = 'Visual & Tambahan'
showCandlePanel = input.bool(true, title='Tampilkan Panel Info Candle?', group=meterGroup)
showCandleArrows = input.bool(false, title='Tampilkan Panah Tiap Candle?', group=meterGroup)
// ==============================================
// --- FITUR UPGRADE ---
// ==============================================
upgradeGroup = '🔥 Fitur Upgrade'
useConfirmFilter = input.bool(false, title=' Gunakan Konfirmasi Momentum (MidPoint)?', group=upgradeGroup)
useReversalExit = input.bool(false, title=' Gunakan Exit Cepat (Candle Pembalikan)?', group=upgradeGroup)
showReEntry = input.bool(true, title=' Tampilkan Sinyal Re-Entry (Add Position)?', group=upgradeGroup)
showAggressiveEMA = input.bool(false, title=' Tampilkan Sinyal Agresif (EMA Bounce)?', group=upgradeGroup)
emaAggressiveFastLen = input.int(9, title=' EMA Cepat (Agresif)', group=upgradeGroup)
emaAggressiveSlowLen = input.int(21, title=' EMA Lambat (Agresif)', group=upgradeGroup)
useBBTamak = input.bool(false, title=' Gunakan Target Profit Dinamis (BB)?', group=upgradeGroup)
bbLen = input.int(20, title=' Periode Bollinger Bands', group=upgradeGroup)
bbStdDev = input.float(2.0, title=' Deviasi Bollinger Bands', group=upgradeGroup)
showDashboard = input.bool(true, title=' Tampilkan Dashboard Pro?', group=upgradeGroup)
showAdvisorBubble = input.bool(true, title=' Tampilkan Gelembung Advisor di Chart?', group=upgradeGroup)
// --- BARU: ZONE INPUT ---
showSmartZones = input.bool(true, title=' Tampilkan Zona Buy/Sell (Supply/Demand)?', group=upgradeGroup)
zoneLookback = input.int(5, title=' Kekuatan Zona (Lookback Pivot)', group=upgradeGroup)
// ====================================================================================================
// BAGIAN UPGRADE: PIVOT, FIBO & STOCHASTIC (NEW)
// ====================================================================================================
pivotGroup = "Pivot, Fibo & Stoch (UPGRADE)"
// Pivot Inputs
showPivotPoints = input.bool(true, title='Tampilkan Daily Pivot (R1-S2)?', group=pivotGroup)
pivotColor = input.color(color.new(color.orange, 0), "Warna Garis Pivot Utama", group=pivotGroup)
// Fibo Inputs
showFiboLevels = input.bool(true, title='Tampilkan Fibo Retracement (CLEAN)?', group=pivotGroup)
fiboXOffset = input.int(10, title='Geser Fibo (X-Offset)', group=pivotGroup)
// Stochastic Inputs
showStochChart = input.bool(true, title='Tampilkan MINI CHART Stochastic (Realtime)?', group=pivotGroup)
stochWidth = input.int(30, title='Lebar Chart (Bars)', minval=10, maxval=100, group=pivotGroup)
// ==============================================
// --- DEKLARASI VAR GLOBAL ---
// ==============================================
var table infoPanel_m = table.new(position.bottom_center, 3, 2, border_width = 1, bgcolor = color.new(#363a45, 0))
var string finalDir_m = ""
var table dashboardPanel = table.new(position.top_right, 2, 10, border_width = 1, bgcolor = color.new(#363a45, 80))
var int rsiLen_actual = rsiFilterLen
var int adxLen_actual = adxLen
var string marketModeText = "..."
var color marketModeColor = color.gray
// ==============================================
// --- LOGIKA PEMILIHAN GAYA (ADAPTIF) ---
// ==============================================
if tradingStyle == 'Mencuri Profit'
a := 1.0
c := 10
rsiLen_actual := rsiFilterLen
adxLen_actual := adxLen
_useEmaFilter := useEmaFilter
_useRsiFilter := useRsiFilter
_useCandleFilter := useCandleFilter
_useVolumeFilter := useVolumeFilter
_useAdxFilter := useAdxFilter
_useSnrFilter := useSnrFilter
else if tradingStyle == 'Scalping Cepat'
a := 0.8
c := 8
rsiLen_actual := 7
adxLen_actual := 10
_useEmaFilter := useEmaFilter
_useRsiFilter := useRsiFilter
_useCandleFilter := useCandleFilter
_useVolumeFilter := useVolumeFilter
_useAdxFilter := useAdxFilter
_useSnrFilter := useSnrFilter
else if tradingStyle == 'Swing Santai'
a := 2.0
c := 15
rsiLen_actual := 21
adxLen_actual := 20
_useEmaFilter := useEmaFilter
_useRsiFilter := useRsiFilter
_useCandleFilter := useCandleFilter
_useVolumeFilter := useVolumeFilter
_useAdxFilter := useAdxFilter
_useSnrFilter := useSnrFilter
else if tradingStyle == 'Sangat Akurat'
a := 2.0
c := 15
rsiLen_actual := 21
adxLen_actual := 20
_useEmaFilter := true
_useRsiFilter := true
_useCandleFilter := true
_useVolumeFilter := true
_useAdxFilter := true
_useSnrFilter := true
else if tradingStyle == 'Custom'
a := a_custom
c := c_custom
rsiLen_actual := rsiFilterLen
adxLen_actual := adxLen
_useEmaFilter := useEmaFilter
_useRsiFilter := useRsiFilter
_useCandleFilter := useCandleFilter
_useVolumeFilter := useVolumeFilter
_useAdxFilter := useAdxFilter
_useSnrFilter := useSnrFilter
// ==============================================
// --- LOGIKA INTI & PERHITUNGAN FILTER ---
// ==============================================
xATR = ta.atr(c)
nLoss = a * xATR
src = close
// --- FILTER TREN ---
emaFast = ta.ema(src, emaFastLen)
emaSlow = ta.ema(src, emaSlowLen)
bool emaCrossOkForBuy = close > emaSlow and emaFast > emaSlow
bool emaCrossOkForSell = close < emaSlow and emaFast < emaSlow
// OPTIMIZED: Added gaps parameter to avoid repainting on historical data
emaMtf = request.security(syminfo.tickerid, mtfTimeframe, emaSlow , lookahead = barmerge.lookahead_off)
bool mtfOkForBuy_ori = close > emaMtf
bool mtfOkForSell_ori = close < emaMtf
bool emaOkForBuy = not _useEmaFilter or (tradingStyle == 'Sangat Akurat' ? mtfOkForBuy_ori : emaCrossOkForBuy)
bool emaOkForSell = not _useEmaFilter or (tradingStyle == 'Sangat Akurat' ? mtfOkForSell_ori : emaCrossOkForSell)
// --- FILTER MOMENTUM ---
rsiFilter = ta.rsi(src, rsiLen_actual)
bool rsiOkForBuy = not _useRsiFilter or rsiFilter > rsiBuyLevel
bool rsiOkForSell = not _useRsiFilter or rsiFilter < rsiSellLevel
// --- FILTER CANDLE & VOLUME ---
bool bullishEngulfing = (close > open and close < open and close > open and open < close )
bool bearishEngulfing = (close < open and close > open and close < open and open > close )
bool candleOkForBuy = not _useCandleFilter or bullishEngulfing
bool candleOkForSell = not _useCandleFilter or bearishEngulfing
avgVolume = ta.sma(volume, volumeLen)
bool volumeOkForBuy = not _useVolumeFilter or (volume > avgVolume * volumeThreshold)
bool volumeOkForSell = not _useVolumeFilter or (volume > avgVolume * volumeThreshold)
// --- FILTER SNR ---
pivotHigh = ta.pivothigh(high, snrLookback, snrLookback)
pivotLow = ta.pivotlow(low, snrLookback, snrLookback)
float nearestResistance = ta.valuewhen(not na(pivotHigh), pivotHigh, 0)
float nearestSupport = ta.valuewhen(not na(pivotLow), pivotLow, 0)
float snrDistance = xATR * snrDistanceFactor
bool nearResistance = math.abs(high - nearestResistance) < snrDistance and high > nearestResistance
bool nearSupport = math.abs(low - nearestSupport) < snrDistance and low < nearestSupport
bool snrOkForBuy = not _useSnrFilter or not nearResistance
bool snrOkForSell = not _useSnrFilter or not nearSupport
// --- FILTER ADX ---
= ta.dmi(adxLen_actual, adxLen_actual)
bool adxMarketOk = not _useAdxFilter or adxValue > adxMinLevel
bool adxDirectionOkForBuy = adxMarketOk and diPlus > diMinus
bool adxDirectionOkForSell = adxMarketOk and diMinus > diPlus
bool adxOkForBuy = not _useAdxFilter or adxDirectionOkForBuy
bool adxOkForSell = not _useAdxFilter or adxDirectionOkForSell
// ==============================================
// --- LOGIKA UPGRADE 1 ---
// ==============================================
float prevMidPoint = (high + low ) / 2
bool confirmOkForBuy = not useConfirmFilter or (close > prevMidPoint)
bool confirmOkForSell = not useConfirmFilter or (close < prevMidPoint)
// ==============================================
// --- LOGIKA CANDLE ---
// ==============================================
bool isBullishEngulfing_m = close > open and close < open and close >= open and open <= close
bool isBearishEngulfing_m = close < open and close > open and close <= open and open >= close
bool isHammer_m = (high - low) > 3 * math.abs(open - close) and ((close - low) / (0.001 + high - low)) > 0.6
bool isInvertedHammer_m = (high - low) > 3 * math.abs(open - close) and ((high - close) / (0.001 + high - low)) > 0.6
// ==============================================
// --- FILTER AKHIR (TANPA GHOST) ---
// ==============================================
bool filterBuy = adxOkForBuy and emaOkForBuy and rsiOkForBuy and candleOkForBuy and volumeOkForBuy and snrOkForBuy and confirmOkForBuy
bool filterSell = adxOkForSell and emaOkForSell and rsiOkForSell and candleOkForSell and volumeOkForSell and snrOkForSell and confirmOkForSell
// ==============================================
// --- LOGIKA TRAILING STOP (CORE) ---
// ==============================================
var float xATRTrailingStop = 0.0
iff_1 = src > nz(xATRTrailingStop , 0) ? src - nLoss : src + nLoss
iff_2 = src < nz(xATRTrailingStop , 0) and src < nz(xATRTrailingStop , 0) ? math.min(nz(xATRTrailingStop ), src + nLoss) : iff_1
xATRTrailingStop := src > nz(xATRTrailingStop , 0) and src > nz(xATRTrailingStop , 0) ? math.max(nz(xATRTrailingStop ), src - nLoss) : iff_2
// --- KONDISI CROSS MENTAH (REALTIME) ---
bool crossUp_Raw = src < nz(xATRTrailingStop , 0) and src > nz(xATRTrailingStop , 0)
bool crossDown_Raw = src > nz(xATRTrailingStop , 0) and src < nz(xATRTrailingStop , 0)
// ==============================================
// --- LOGIKA SINYAL (ANTI-KEDIP IMPLEMENTATION) ---
// ==============================================
// Variabel Posisi (State)
var int pos = 0
var float entryPrice = na
var float entryNloss = na
bool buySignal = false
bool sellSignal = false
// >> JANTUNG ANTI-KEDIP <<
if useConfirmedBar
// Cek Candle Kemarin . Jika kemarin valid, sinyal muncul SEKARANG (permanen).
bool crossUp_Prev = close < nz(xATRTrailingStop , 0) and close > nz(xATRTrailingStop , 0)
bool crossDown_Prev = close > nz(xATRTrailingStop , 0) and close < nz(xATRTrailingStop , 0)
// Gunakan filter dari bar sebelumnya agar konsisten
buySignal := crossUp_Prev and filterBuy
sellSignal := crossDown_Prev and filterSell
else
// Mode realtime (Risiko kedap-kedip)
buySignal := crossUp_Raw and filterBuy
sellSignal := crossDown_Raw and filterSell
// --- EKSEKUSI POSISI ---
// Cek Exit
bool closePositionBySL = (nz(pos ) == 1 and src < xATRTrailingStop) or (nz(pos ) == -1 and src > xATRTrailingStop)
bool reversalExitBuy = nz(pos ) == 1 and isBearishEngulfing_m
bool reversalExitSell = nz(pos ) == -1 and isBullishEngulfing_m
bool reversalCandleExit = useReversalExit and (reversalExitBuy or reversalExitSell)
bool exitSignal = closePositionBySL or reversalCandleExit
int newPos = nz(pos )
if buySignal
newPos := 1
else if sellSignal
newPos := -1
else if exitSignal
newPos := 0
pos := newPos
bool posOpen = pos != 0
// Update Entry Price
if buySignal or sellSignal
if useConfirmedBar
entryPrice := open
entryNloss := nLoss
else
entryPrice := src
entryNloss := nLoss
else if pos == 0
entryPrice := na
entryNloss := na
// --- LOGIKA ADD BUY / ADD SELL (SMART SNIPER V3.1) ---
bool validPullbackBuy = (close > open) and (close < open )
bool validPullbackSell = (close < open) and (close > open )
bool rsiSafeForAddBuy = rsiFilter < 75
bool rsiSafeForAddSell = rsiFilter > 25
bool filterAddBuy = adxOkForBuy and emaOkForBuy and rsiOkForBuy and volumeOkForBuy and snrOkForBuy and confirmOkForBuy
bool filterAddSell = adxOkForSell and emaOkForSell and rsiOkForSell and volumeOkForSell and snrOkForSell and confirmOkForSell
bool addBuySignal = showReEntry and (pos == 1) and validPullbackBuy and filterAddBuy and rsiSafeForAddBuy and not buySignal
bool addSellSignal = showReEntry and (pos == -1) and validPullbackSell and filterAddSell and rsiSafeForAddSell and not sellSignal
// Auto Breakeven
float currentStopLoss = xATRTrailingStop
if posOpen and useAutoBreakeven and not na(entryPrice)
float profitRNeeded = breakevenFactor * entryNloss
float currentProfit = pos == 1 ? (src - entryPrice) : (entryPrice - src)
if currentProfit >= profitRNeeded
float breakevenLevel = entryPrice
if pos == 1
if breakevenLevel > currentStopLoss
currentStopLoss := breakevenLevel
else // pos == -1
if breakevenLevel < currentStopLoss
currentStopLoss := breakevenLevel
xATRTrailingStopAdj = posOpen ? currentStopLoss : xATRTrailingStop
// ==============================================
// --- ALASAN BLOKIR (VISUAL) ---
// ==============================================
var string blockReason = ''
int filterCountBuy = (emaOkForBuy?1:0)+(rsiOkForBuy?1:0)+(candleOkForBuy?1:0)+(volumeOkForBuy?1:0)+(adxOkForBuy?1:0)+(snrOkForBuy?1:0)+(confirmOkForBuy?1:0)
int filterCountSell = (emaOkForSell?1:0)+(rsiOkForSell?1:0)+(candleOkForSell?1:0)+(volumeOkForSell?1:0)+(adxOkForSell?1:0)+(snrOkForSell?1:0)+(confirmOkForSell?1:0)
if crossUp_Raw and not filterBuy
blockReason := '❌ Buy Blocked (' + str.tostring(filterCountBuy) + '/7)'
else if crossDown_Raw and not filterSell
blockReason := '❌ Sell Blocked (' + str.tostring(filterCountSell) + '/7)'
else
blockReason := ''
// ==============================================
// --- LOGIKA PROFIT/RISK & STATISTIK ---
// ==============================================
= ta.bb(src, bbLen, bbStdDev)
float distFromEntry = posOpen ? (pos == 1 ? src - nz(entryPrice) : nz(entryPrice) - src) : 0.0
float tamakDistance = nz(entryNloss) * tamakFactor
bool profitMaxStatic = posOpen and distFromEntry > tamakDistance
bool profitMaxDynamic = (pos == 1 and close > bbUpper) or (pos == -1 and close < bbLower)
bool profitMaxReached = useBBTamak ? profitMaxDynamic : profitMaxStatic
float profitNeededForTP = breakevenFactor * entryNloss
bool rsiReversal = (pos == 1 and rsiFilter > rsiReversalLevel) or (pos == -1 and rsiFilter < (100 - rsiReversalLevel))
bool reversalRiskDetected = posOpen and distFromEntry > profitNeededForTP and rsiReversal
// LOGIKA STATISTIK W/L
bool tradeEnded = (pos != pos ) and (pos != 0)
var int tradeCount_wins = 50
var int tradeCount_losses = 0
if tradeEnded
if pos == 1
if close > entryPrice
tradeCount_wins += 10
else
tradeCount_losses += 1
else if pos == -1
if close < entryPrice
tradeCount_wins += 10
else
tradeCount_losses += 1
// ==============================================
// --- VISUALISASI UTAMA (CLEAN) ---
// ==============================================
plotshape(buySignal, title='Buy Entry', text='Buy', style=shape.labelup, location=location.belowbar, color=color.green, textcolor=color.white, size=size.tiny)
plotshape(sellSignal, title='Sell Entry', text='Sell', style=shape.labeldown, location=location.abovebar, color=color.red, textcolor=color.white, size=size.tiny)
plotshape(addBuySignal, title='Add Buy', text='Add', style=shape.triangleup, location=location.belowbar, color=color.blue, textcolor=color.blue, size=size.tiny)
plotshape(addSellSignal, title='Add Sell', text='Add', style=shape.triangledown, location=location.abovebar, color=color.fuchsia, textcolor=color.fuchsia, size=size.tiny)
plotshape(reversalCandleExit, title='Forced Exit', text='Exit', style=shape.labeldown, location=location.abovebar, color=color.gray, textcolor=color.white, size=size.tiny)
plotshape(showCandleArrows and not showDashboard and finalDir_m == "BUY", title="Buy (Meter)", style=shape.triangleup, color=color.new(color.lime, 0), location=location.belowbar, size=size.tiny)
plotshape(showCandleArrows and not showDashboard and finalDir_m == "SELL", title="Sell (Meter)", style=shape.triangledown, color=color.new(color.red, 0), location=location.abovebar, size=size.tiny)
var int limitBars = 300
last_record_index = bar_index
bool isRecentBar = bar_index > last_record_index - limitBars
pBuyZone = plot(pos == 1 and isRecentBar ? xATRTrailingStopAdj : na, color=color.new(color.white, 100))
pSellZone = plot(pos == -1 and isRecentBar ? xATRTrailingStopAdj : na, color=color.new(color.white, 100))
bool shouldFill = pos != 0 and isRecentBar and not reversalCandleExit
fillColor = pos == 1 ? color.new(color.green, 85) : pos == -1 ? color.new(color.red, 85) : na
fill(pBuyZone, pSellZone, color = shouldFill ? fillColor : na)
var line snr_res_line = na
var line snr_sup_line = na
if not na(pivotHigh)
line.delete(snr_res_line)
snr_res_line := line.new(bar_index, pivotHigh, bar_index + 1, pivotHigh, xloc.bar_index, extend.right, color.red, line.style_solid, 2)
if not na(pivotLow)
line.delete(snr_sup_line)
snr_sup_line := line.new(bar_index, pivotLow, bar_index + 1, pivotLow, xloc.bar_index, extend.right, color.green, line.style_solid, 2)
plot(useBBTamak ? bbUpper : na, title="BB Upper (Target)", color=color.new(color.aqua, 70), style=plot.style_circles, linewidth=1)
plot(useBBTamak ? bbLower : na, title="BB Lower (Target)", color=color.new(color.aqua, 70), style=plot.style_circles, linewidth=1)
float emaAggressiveFast = ta.ema(src, emaAggressiveFastLen)
float emaAggressiveSlow = ta.ema(src, emaAggressiveSlowLen)
plot(showAggressiveEMA ? emaAggressiveFast : na, title="EMA Agresif Cepat", color=color.new(#1ff118, 44), style=plot.style_cross, linewidth=1)
plot(showAggressiveEMA ? emaAggressiveSlow : na, title="EMA Agresif Lambat", color=color.new(#f8241d, 46), style=plot.style_cross, linewidth=1)
// ==============================================
// --- DASHBOARD PRO & STATUS (REALITY ADVISOR COMPACT) ---
// ==============================================
string statusText = ''
color statusColor = color.gray
float distFromStop = pos == 1 ? src - xATRTrailingStopAdj : pos == -1 ? xATRTrailingStopAdj - src : 0
bool waspada = pos != 0 and not buySignal and not sellSignal and distFromStop < waspadaFactor * entryNloss
int rand = bar_index % 5
var string advisorMsg = "..."
if buySignal
statusText := '🚀 NAIK! Entry Baru'
statusColor := color.green
if rand == 0
advisorMsg := "Gaspol! 🚀\nJangan keasyikan tambah SL+ sayang."
else if rand == 1
advisorMsg := "OTW Sultan! 🤑\nFull senyum maszeh!"
else if rand == 2
advisorMsg := "Ijo royo-royo! 🌿\nMata jadi seger."
else if rand == 3
advisorMsg := "Sikat Pak Haji! 👳\nRejeki anak soleh."
else
advisorMsg := "Lilin hijau!\nSerok sekarang! 💰"
else if sellSignal
statusText := '📉 TURUN! Entry Baru'
statusColor := color.red
if rand == 0
advisorMsg := "Longsor! 📉\nSiapkan ember."
else if rand == 1
advisorMsg := "Merah merona! 🩸\nDompet aman kan?"
else if rand == 2
advisorMsg := "Terjun bebas! 🪂\nwaspada REM."
else if rand == 3
advisorMsg := "Longsor! 📉\njangan naik dulu."
else
advisorMsg := "Short selling!\nCuan tipis sikat! 💸"
else if addBuySignal
statusText := '🚀 GAS LAGI (Add)!'
statusColor := color.blue
if rand == 0
advisorMsg := "Tambah muatan! 😎\nBiar bandar nangis."
else
advisorMsg := "Mumpung hijau! 🛒\nSikat lagi bosqu!"
else if addSellSignal
statusText := '📉 GAS LAGI (Add)!'
statusColor := color.fuchsia
if rand == 0
advisorMsg := "Tambah Sell! 🔥\nBiar makin perih."
else
advisorMsg := "Tekan bawah! 😤\nJangan kasih napas."
else if reversalCandleExit
statusText := '⛔ EXIT! Pembalikan'
statusColor := color.orange
advisorMsg := "Kabur! 🏃💨\nCandle mencurigakan."
else if reversalRiskDetected
statusText := '⚠️ TP NOW!'
statusColor := color.yellow
advisorMsg := "Amankan profit! 🤡\nJangan serakah."
else if profitMaxReached
statusText := '🤑 CUAN BUNGKUS!'
statusColor := color.aqua
if rand == 0
advisorMsg := "Cuan bungkus! 🍜\nTraktir seblak dong."
else if rand == 1
advisorMsg := "Udah kaya? 💅\nTarik buat skincare!"
else
advisorMsg := "Alhamdulillah! 🎁\nRejeki jangan ditolak."
else if waspada
statusText := '💔 HATI-HATI!'
statusColor := color.orange
if rand == 0
advisorMsg := "Dia toxic... 🚩\nHati-hati SL."
else
advisorMsg := "Awas MC! 💀\npasang SL+ sayang."
else if pos == 1
statusText := '🧘 TAHAN Buy...'
statusColor := color.green
if rand == 0
advisorMsg := "Sabar sayang... 🧘♀️\nDisayang Tuhan."
else if rand == 1
advisorMsg := "Biarkan lari! 🏃♂️\nProfit is running."
else
advisorMsg := "Hold terus! 🚀\nSampai ke bulan!"
else if pos == -1
statusText := '🍿 TAHAN Sell...'
statusColor := color.red
if rand == 0
advisorMsg := "Nonton aja... 🍿\nSambil ngemil."
else
advisorMsg := "Jatuh kebawah sakit? 😂\ndisini malah Cuan."
else if blockReason != ''
statusText := "DIBLOKIR"
statusColor := color.gray
advisorMsg := "Sinyal busuk! ⛔\nJangan masuk."
else
statusText := '... '
statusColor := color.gray
if rand == 0
advisorMsg := "Market galau... 💤\nMending turu."
else if rand == 1
advisorMsg := "Datar banget... 😑\nKek jalan tol."
else if rand == 2
advisorMsg := "Jangan maksa! ☕\nNgopi dulu."
else
advisorMsg := "Sabar... 🕰️\nMenunggu itu berat."
if adxValue > adxMinLevel and diPlus > diMinus
marketModeText := "📈 Tren Naik Kuat"
marketModeColor := color.new(color.green, 0)
else if adxValue > adxMinLevel and diMinus > diPlus
marketModeText := "📉 Tren Turun Kuat"
marketModeColor := color.new(color.red, 0)
else
marketModeText := "💤 Sideways / Chop"
marketModeColor := color.new(color.gray, 0)
f_fillCell(tbl, col, row, cellText, color) =>
table.cell(tbl, col, row, cellText, text_color=color, text_size=size.small)
f_drawDashboard() =>
f_fillCell(dashboardPanel, 0, 0, "Gaya:", color.gray)
f_fillCell(dashboardPanel, 1, 0, tradingStyle, color.white)
f_fillCell(dashboardPanel, 0, 1, "Status:", color.gray)
f_fillCell(dashboardPanel, 1, 1, statusText, statusColor)
bool dashboardContextIsBuy = pos == 1 or (pos == 0 and close > open)
string emaStatus = (dashboardContextIsBuy ? emaOkForBuy : emaOkForSell) or not _useEmaFilter ? "✅" : "❌"
string rsiStatus = (dashboardContextIsBuy ? rsiOkForBuy : rsiOkForSell) or not _useRsiFilter ? "✅" : "❌"
string adxStatus = (dashboardContextIsBuy ? adxOkForBuy : adxOkForSell) or not _useAdxFilter ? "✅" : "❌"
string snrStatus = (dashboardContextIsBuy ? snrOkForBuy : snrOkForSell) or not _useSnrFilter ? "✅" : "❌"
string confirmStatus = (dashboardContextIsBuy ? confirmOkForBuy : confirmOkForSell) or not useConfirmFilter ? "✅" : "❌"
string filterStr1 = "EMA" + emaStatus + " RSI" + rsiStatus
string filterStr2 = "ADX" + adxStatus + " SNR" + snrStatus + (useConfirmFilter ? " 1-Bar" + confirmStatus : "")
string filterString = filterStr1 + " " + filterStr2
f_fillCell(dashboardPanel, 0, 2, "Filter:", color.gray)
f_fillCell(dashboardPanel, 1, 2, filterString, color.white)
float body_m = math.abs(close - open)
float rangeC_m = high - low
float power_m = rangeC_m == 0 ? 0.0 : (body_m / rangeC_m) * 5
power_m := math.min(power_m, 5)
float confidence_m = rangeC_m == 0 ? 0.0 : math.round(math.abs((close - open) / (high - low)) * 100)
int powerInt_m = int(math.round(power_m))
powerInt_m := powerInt_m < 0 ? 0 : powerInt_m > 5 ? 5 : powerInt_m
string bars_m = str.repeat("█", powerInt_m) + str.repeat("░", 5 - powerInt_m)
string meterString = (close > open ? "🟢 " : "🔴 ") + bars_m + " " + str.tostring(confidence_m, "#") + "%"
f_fillCell(dashboardPanel, 0, 3, "Meter:", color.gray)
f_fillCell(dashboardPanel, 1, 3, meterString, (close > open ? color.green : color.red))
int totalTrades = tradeCount_wins + tradeCount_losses
f_fillCell(dashboardPanel, 0, 4, "Total Sinyal:", color.gray)
f_fillCell(dashboardPanel, 1, 4, str.tostring(totalTrades), color.white)
f_fillCell(dashboardPanel, 0, 5, "W / L:", color.gray)
f_fillCell(dashboardPanel, 1, 5, str.tostring(tradeCount_wins) + " / " + str.tostring(tradeCount_losses), color.white)
string winRateString = "N/A"
color winRateColor = color.gray
if totalTrades > 0
winRateString := str.tostring(tradeCount_wins / totalTrades * 100, '0.0') + "%"
winRateColor := tradeCount_wins > tradeCount_losses ? color.green : (tradeCount_losses > tradeCount_wins ? color.red : color.gray)
f_fillCell(dashboardPanel, 0, 6, "Win Rate:", color.gray)
f_fillCell(dashboardPanel, 1, 6, winRateString, winRateColor)
f_fillCell(dashboardPanel, 0, 7, "Pasar:", color.gray)
f_fillCell(dashboardPanel, 1, 7, marketModeText, marketModeColor)
table.merge_cells(dashboardPanel, 0, 8, 1, 8)
table.cell(dashboardPanel, 0, 8, advisorMsg, text_color=color.yellow, text_size=size.small, bgcolor=color.new(color.black, 50))
table.merge_cells(dashboardPanel, 0, 9, 1, 9)
table.cell(dashboardPanel, 0, 9, "HADYAN PREMIUM INDI 083174747475", text_color=color.new(#969087, 66), text_size=size.tiny)
if barstate.islast and showDashboard
f_drawDashboard()
else if barstate.islast
table.clear(dashboardPanel, 0, 0, 1, 9)
// ==============================================
// --- FLOATING BUBBLE LABEL (FIXED) ---
// ==============================================
var label advisorLabel = na
if barstate.islast
label.delete(advisorLabel)
if showAdvisorBubble
// Tentukan Warna Gelembung biar Cantik
color bubbleColor = color.new(color.gray, 20)
if buySignal or addBuySignal or pos == 1
bubbleColor := color.new(color.green, 20)
else if sellSignal or addSellSignal or pos == -1
bubbleColor := color.new(color.red, 20)
else if waspada or reversalCandleExit
bubbleColor := color.new(color.orange, 20)
// OPTIMIZED: Geser sedikit ke kanan (+2) agar tidak menutupi candle terakhir
advisorLabel := label.new(bar_index + 2, close, text=advisorMsg, color=bubbleColor, textcolor=color.white, style=label.style_label_left, yloc=yloc.price)
// ==============================================
// --- LOGIKA CANDLE METER PANEL ---
// ==============================================
if (showCandlePanel or showCandleArrows) and not showDashboard
float body_m = math.abs(close - open)
float rangeC_m = high - low
float power_m = rangeC_m == 0 ? 0.0 : (body_m / rangeC_m) * 5
power_m := math.min(power_m, 5)
float confidence_m = rangeC_m == 0 ? 0.0 : math.round(math.abs((close - open) / (high - low)) * 100)
string patternName_m = ""
string baseDir_m = close > open ? "BUY" : "SELL"
if isBullishEngulfing_m
patternName_m := "Bullish Engulfing"
baseDir_m := "BUY"
else if isBearishEngulfing_m
patternName_m := "Bearish Engulfing"
baseDir_m := "SELL"
else if isHammer_m
patternName_m := "Hammer"
baseDir_m := "BUY"
else if isInvertedHammer_m
patternName_m := "Inverted Hammer"
baseDir_m := "SELL"
else
patternName_m := "Normal Candle"
string trendConfirm_m = close > close and close > close ? "BUY" : close < close and close < close ? "SELL" : baseDir_m
finalDir_m := baseDir_m == trendConfirm_m ? baseDir_m : baseDir_m
if showCandlePanel
int powerInt_m = int(math.round(power_m))
powerInt_m := powerInt_m < 0 ? 0 : powerInt_m > 5 ? 5 : powerInt_m
string bars_m = str.repeat("█", powerInt_m) + str.repeat("░", 5 - powerInt_m)
string dirText_m = finalDir_m == "BUY" ? "🟢 BUY" : "🔴 SELL"
string confText_m = str.tostring(confidence_m, "#") + "% " + bars_m
table.cell(infoPanel_m, 0, 0, "Pattern", text_color=color.yellow)
table.cell(infoPanel_m, 1, 0, "Direction", text_color=color.yellow)
table.cell(infoPanel_m, 2, 0, "Confidence", text_color=color.yellow)
table.cell(infoPanel_m, 0, 1, patternName_m, text_color=color.white)
table.cell(infoPanel_m, 1, 1, dirText_m, text_color=color.white)
table.cell(infoPanel_m, 2, 1, confText_m, text_color=color.white)
else
table.clear(infoPanel_m, 0, 0, 2, 1)
else if not showDashboard
table.clear(infoPanel_m, 0, 0, 2, 1)
// ==============================================
// --- ALERT UPDATED (SINGLE ALERT SUPPORT) ---
// ==============================================
string alertMsg_all = ""
if buySignal
alertMsg_all := "🚀 BUY NEW! @ " + str.tostring(close) + " | SL: " + str.tostring(xATRTrailingStopAdj)
else if sellSignal
alertMsg_all := "📉 SELL NEW! @ " + str.tostring(close) + " | SL: " + str.tostring(xATRTrailingStopAdj)
else if addBuySignal
alertMsg_all := "➕ ADD BUY (Re-Entry) @ " + str.tostring(close)
else if addSellSignal
alertMsg_all := "➕ ADD SELL (Re-Entry) @ " + str.tostring(close)
else if reversalCandleExit
alertMsg_all := "⛔ EXIT NOW! Reversal Detected @ " + str.tostring(close)
else if profitMaxReached
alertMsg_all := "💰 TAKE PROFIT! Target Tercapai @ " + str.tostring(close)
else if reversalRiskDetected
alertMsg_all := "⚠️ WARNING REVERSAL! RSI Extreme @ " + str.tostring(close)
// Pemicu Alarm Utama (Hanya aktif jika ada pesan, cukup pasang 1 alarm "Any function call")
if alertMsg_all != ""
alert(alertMsg_all, alert.freq_once_per_bar_close)
// Backup: Manual Alerts (Jika user Premium mau pasang satu-satu)
alertcondition(buySignal, title=' Buy Signal', message='🚀 BUY NEW!')
alertcondition(sellSignal, title=' Sell Signal', message='📉 SELL NEW!')
alertcondition(addBuySignal, title=' Add Buy', message='🚀 ADD BUY')
alertcondition(addSellSignal, title=' Add Sell', message='📉 ADD SELL')
alertcondition(waspada, title=' Waspada', message='💔 WASPADA')
// ==============================================
// --- TP/SL MODE SWING (FIXED & OPTIMIZED) ---
// ==============================================
var line sl_line = na
var line tp1_line = na
var line tp2_line = na
var line tp3_line = na
var label sl_label = na
var label tp1_label = na
var label tp2_label = na
var label tp3_label = na
if tradingStyle == 'Swing Santai'
if buySignal
line.delete(sl_line)
line.delete(tp1_line)
line.delete(tp2_line)
line.delete(tp3_line)
label.delete(sl_label)
label.delete(tp1_label)
label.delete(tp2_label)
label.delete(tp3_label)
float sl = entryPrice - entryNloss
float tp1 = entryPrice + entryNloss
float tp2 = entryPrice + (2*entryNloss)
float tp3 = entryPrice + (3*entryNloss)
sl_line := line.new(bar_index, sl, bar_index + 10, sl, color=color.new(color.red, 20), style=line.style_dashed, width=2)
tp1_line := line.new(bar_index, tp1, bar_index + 10, tp1, color=color.new(color.green, 20), style=line.style_dashed, width=2)
tp2_line := line.new(bar_index, tp2, bar_index + 10, tp2, color=color.new(color.green, 20), style=line.style_dashed, width=2)
tp3_line := line.new(bar_index, tp3, bar_index + 10, tp3, color=color.new(color.green, 20), style=line.style_dashed, width=2)
sl_label := label.new(bar_index + 10, sl, "SL (Rugi)", color=color.red, style=label.style_label_left, textcolor=color.white)
tp1_label := label.new(bar_index + 10, tp1, "TP1 (1:1)", color=color.green, style=label.style_label_left, textcolor=color.white)
tp2_label := label.new(bar_index + 10, tp2, "TP2 (1:2)", color=color.green, style=label.style_label_left, textcolor=color.white)
tp3_label := label.new(bar_index + 10, tp3, "TP3 (1:3)", color=color.green, style=label.style_label_left, textcolor=color.white)
else if sellSignal
line.delete(sl_line)
line.delete(tp1_line)
line.delete(tp2_line)
line.delete(tp3_line)
label.delete(sl_label)
label.delete(tp1_label)
label.delete(tp2_label)
label.delete(tp3_label)
float sl = entryPrice + entryNloss
float tp1 = entryPrice - entryNloss
float tp2 = entryPrice - (2*entryNloss)
float tp3 = entryPrice - (3*entryNloss)
sl_line := line.new(bar_index, sl, bar_index + 10, sl, color=color.new(color.red, 20), style=line.style_dashed, width=2)
tp1_line := line.new(bar_index, tp1, bar_index + 10, tp1, color=color.new(color.green, 20), style=line.style_dashed, width=2)
tp2_line := line.new(bar_index, tp2, bar_index + 10, tp2, color=color.new(color.green, 20), style=line.style_dashed, width=2)
tp3_line := line.new(bar_index, tp3, bar_index + 10, tp3, color=color.new(color.green, 20), style=line.style_dashed, width=2)
sl_label := label.new(bar_index + 10, sl, "SL (Rugi)", color=color.red, style=label.style_label_left, textcolor=color.white)
tp1_label := label.new(bar_index + 10, tp1, "TP1 (1:1)", color=color.green, style=label.style_label_left, textcolor=color.white)
tp2_label := label.new(bar_index + 10, tp2, "TP2 (1:2)", color=color.green, style=label.style_label_left, textcolor=color.white)
tp3_label := label.new(bar_index + 10, tp3, "TP3 (1:3)", color=color.green, style=label.style_label_left, textcolor=color.white)
else if pos != 0 and not na(sl_line)
// Update existing lines (Lightweight)
line.set_x2(sl_line, bar_index + 10)
line.set_x2(tp1_line, bar_index + 10)
line.set_x2(tp2_line, bar_index + 10)
line.set_x2(tp3_line, bar_index + 10)
label.set_x(sl_label, bar_index + 10)
label.set_x(tp1_label, bar_index + 10)
label.set_x(tp2_label, bar_index + 10)
label.set_x(tp3_label, bar_index + 10)
else if pos == 0
line.delete(sl_line)
sl_line := na
line.delete(tp1_line)
tp1_line := na
line.delete(tp2_line)
tp2_line := na
line.delete(tp3_line)
tp3_line := na
label.delete(sl_label)
sl_label := na
label.delete(tp1_label)
tp1_label := na
label.delete(tp2_label)
tp2_label := na
label.delete(tp3_label)
tp3_label := na
else
line.delete(sl_line)
sl_line := na
line.delete(tp1_line)
tp1_line := na
line.delete(tp2_line)
tp2_line := na
line.delete(tp3_line)
tp3_line := na
label.delete(sl_label)
sl_label := na
label.delete(tp1_label)
tp1_label := na
label.delete(tp2_label)
tp2_label := na
label.delete(tp3_label)
tp3_label := na
// ==============================================
// --- UPGRADE BARU: PIVOT POINTS (FIXED: EXTEND RIGHT) ---
// ==============================================
// Dapatkan Daily High, Low, Close (FIX "D")
p_d_h = request.security(syminfo.tickerid, "D", high , lookahead=barmerge.lookahead_on)
p_d_l = request.security(syminfo.tickerid, "D", low , lookahead=barmerge.lookahead_on)
p_d_c = request.security(syminfo.tickerid, "D", close , lookahead=barmerge.lookahead_on)
// Perhitungan Pivot Klasik
pivot_d = (p_d_h + p_d_l + p_d_c) / 3
r1_d = 2 * pivot_d - p_d_l
s1_d = 2 * pivot_d - p_d_h
r2_d = pivot_d + (p_d_h - p_d_l)
s2_d = pivot_d - (p_d_h - p_d_l)
// Visualisasi Pivot
var line p_line = na
var line r1_line = na
var line s1_line = na
var line r2_line = na
var line s2_line = na
var label p_label = na
var label r1_label = na
var label s1_label = na
var label r2_label = na
var label s2_label = na
// Fungsi untuk menghapus label/line
f_delete_pivot_objects() =>
line.delete(p_line)
line.delete(r1_line)
line.delete(s1_line)
line.delete(r2_line)
line.delete(s2_line)
label.delete(p_label)
label.delete(r1_label)
label.delete(s1_label)
label.delete(r2_label)
label.delete(s2_label)
if showPivotPoints
// Hapus yang lama agar tidak numpuk (Redraw Logic)
f_delete_pivot_objects()
// Logic: EXTEND RIGHT (Memanjang)
// Kita gunakan extend.right agar garisnya tidak pernah putus ke kanan
// Pivot (P)
p_line := line.new(bar_index, pivot_d, bar_index + 1, pivot_d, xloc.bar_index, extend.right, pivotColor, line.style_solid, 2)
p_label := label.new(bar_index + 10, pivot_d, "P Daily: " + str.tostring(pivot_d, format.mintick), xloc.bar_index, yloc.price, color=color.new(pivotColor, 20), textcolor=color.white, style=label.style_label_left, size=size.small)
// Resistance
r1_line := line.new(bar_index, r1_d, bar_index + 1, r1_d, xloc.bar_index, extend.right, color.new(color.red, 30), line.style_dashed, 1)
r1_label := label.new(bar_index + 10, r1_d, "R1: " + str.tostring(r1_d, format.mintick), xloc.bar_index, yloc.price, color=color.new(color.red, 80), textcolor=color.red, style=label.style_label_left, size=size.small)
r2_line := line.new(bar_index, r2_d, bar_index + 1, r2_d, xloc.bar_index, extend.right, color.new(color.red, 30), line.style_dashed, 1)
r2_label := label.new(bar_index + 10, r2_d, "R2: " + str.tostring(r2_d, format.mintick), xloc.bar_index, yloc.price, color=color.new(color.red, 80), textcolor=color.red, style=label.style_label_left, size=size.small)
// Support
s1_line := line.new(bar_index, s1_d, bar_index + 1, s1_d, xloc.bar_index, extend.right, color.new(color.green, 30), line.style_dashed, 1)
s1_label := label.new(bar_index + 10, s1_d, "S1: " + str.tostring(s1_d, format.mintick), xloc.bar_index, yloc.price, color=color.new(color.green, 80), textcolor=color.green, style=label.style_label_left, size=size.small)
s2_line := line.new(bar_index, s2_d, bar_index + 1, s2_d, xloc.bar_index, extend.right, color.new(color.green, 30), line.style_dashed, 1)
s2_label := label.new(bar_index + 10, s2_d, "S2: " + str.tostring(s2_d, format.mintick), xloc.bar_index, yloc.price, color=color.new(color.green, 80), textcolor=color.green, style=label.style_label_left, size=size.small)
else
f_delete_pivot_objects()
// ==============================================
// --- UPGRADE BARU: FIBONACCI RETRACEMENT (CLEAN NO STACK) ---
// ==============================================
var float fiboHigh = na
var float fiboLow = na
var int fiboStartBar = na
// Array untuk menyimpan objek Fibo
var line fiboLines = array.new(0)
var linefill fiboFills = array.new(0)
var label fiboLabels = array.new(0)
// Helper Function: Clean Up All Fibo Objects
f_cleanFibo() =>
if array.size(fiboLines) > 0
for i = 0 to array.size(fiboLines) - 1
line.delete(array.get(fiboLines, i))
array.clear(fiboLines)
if array.size(fiboFills) > 0
for i = 0 to array.size(fiboFills) - 1
linefill.delete(array.get(fiboFills, i))
array.clear(fiboFills)
if array.size(fiboLabels) > 0
for i = 0 to array.size(fiboLabels) - 1
label.delete(array.get(fiboLabels, i))
array.clear(fiboLabels)
// Calculate historical values globally
float lastHigh_scanned = ta.valuewhen(not na(pivotHigh), pivotHigh, 0)
float lastLow_scanned = ta.valuewhen(not na(pivotLow), pivotLow, 0)
// Reset Fibo jika ada sinyal entry baru
if buySignal or sellSignal
f_cleanFibo() // Clean old ones first!
// Gunakan nilai yang sudah di-scan secara global
if not na(lastHigh_scanned) and not na(lastLow_scanned)
fiboLow := lastLow_scanned
fiboHigh := lastHigh_scanned
fiboStartBar := bar_index
// Levels
fiboLevels = array.new(0)
array.push(fiboLevels, 0.0)
array.push(fiboLevels, 0.236)
array.push(fiboLevels, 0.382)
array.push(fiboLevels, 0.5)
array.push(fiboLevels, 0.618)
array.push(fiboLevels, 1.0)
// Gambar Fibo (Hanya digambar ulang jika posisi valid dan belum ada)
// Kita gunakan trik: Gambar setiap bar, tapi HAPUS yang lama dulu.
// Ini mencegah stacking ribuan kotak.
if showFiboLevels and not na(fiboHigh) and not na(fiboLow)
f_cleanFibo() // CLEANUP WAJIB SEBELUM GAMBAR BARU
float fiboRange = fiboHigh - fiboLow
int f_start = bar_index + fiboXOffset
int f_end = bar_index + fiboXOffset + 15
var line lastLineObj = na
for i = 0 to array.size(fiboLevels) - 1
float level = array.get(fiboLevels, i)
float fiboPrice = fiboHigh - (fiboRange * level)
string levelText = str.tostring(math.round(level * 100), "0.0") + "%"
color levelColor = color.rgb(19, 56, 189)
if level == 0.618
levelColor := color.new(#FFD700, 30)
else if level == 0.5
levelColor := color.new(color.green, 30)
else
levelColor := color.new(#7925c9, 70)
string l_style = (level == 0.0 or level == 1.0) ? line.style_dashed : line.style_solid
int l_width = (level == 0.618 or level == 0.5) ? 2 : 1
// Draw & Push Line
line currentLineObj = line.new(f_start, fiboPrice, f_end, fiboPrice, xloc.bar_index, extend.none, levelColor, l_style, l_width)
array.push(fiboLines, currentLineObj)
// Fill Logic
color c_fill = switch level
0.236 => color.new(color.gray, 70) // Sangat transparan (95)
0.382 => color.new(color.blue, 70)
0.5 => color.new(color.green, 70)
0.618 => color.new(#FFD700, 70)
1.0 => color.new(color.red, 70)
=> na
if i > 0
linefill lf = linefill.new(lastLineObj, currentLineObj, c_fill)
array.push(fiboFills, lf)
lastLineObj := currentLineObj
// Draw & Push Label
label lb = label.new(f_end, fiboPrice, levelText, xloc.bar_index, yloc.price, color=color.new(levelColor, 100), textcolor=levelColor, style=label.style_label_left, size=size.small)
array.push(fiboLabels, lb)
// ==============================================
// --- UPGRADE BARU: STOCHASTIC FLOATING MINI CHART (REALTIME ANCHOR RIGHT PATCH) ---
// ==============================================
// 1. Calculations
stochK = ta.sma(ta.stoch(close, high, low, 14), 3)
stochD = ta.sma(stochK, 3)
// 2. Data Storage (Arrays for History)
var float stochK_hist = array.new_float(0)
var float stochD_hist = array.new_float(0)
// Update Arrays (REALTIME LOGIC)
if barstate.isnew
array.push(stochK_hist, nz(stochK, 50))
array.push(stochD_hist, nz(stochD, 50))
// Limit array size to chart width + 1
if array.size(stochK_hist) > (stochWidth + 1)
array.shift(stochK_hist)
array.shift(stochD_hist)
else
// UPDATE TICK-BY-TICK (Agar tidak delay)
if array.size(stochK_hist) > 0
array.set(stochK_hist, array.size(stochK_hist) - 1, nz(stochK, 50))
array.set(stochD_hist, array.size(stochD_hist) - 1, nz(stochD, 50))
// 3. Drawing Logic
var box stochBgBox = na
var box stochUpperFill = na
var box stochLowerFill = na
var line stochLines = array.new_line(0)
// Clear Function
f_cleanStochChart() =>
if not na(stochBgBox)
box.delete(stochBgBox)
if not na(stochUpperFill)
box.delete(stochUpperFill)
if not na(stochLowerFill)
box.delete(stochLowerFill)
if array.size(stochLines) > 0
for i = 0 to array.size(stochLines) - 1
line.delete(array.get(stochLines, i))
array.clear(stochLines)
// Global Helper to map 0-100 Stoch value to Y price coordinate
f_mapY(_val, _bottom, _height) =>
_bottom + (_val / 100 * _height)
if showStochChart and array.size(stochK_hist) > 2
f_cleanStochChart() // Redraw every tick
// Positioning (ANCHOR RIGHT LOGIC)
int offset_right = 5
int ch_right = bar_index + offset_right // Ujung kanan box
int ch_left = ch_right - stochWidth
// Vertical Scaling
float ch_height = ta.atr(14) * 4
float ch_bottom = close - (ch_height * 1.5)
float ch_top = ch_bottom + ch_height
// Draw Background
stochBgBox := box.new(ch_left, ch_top, ch_right, ch_bottom, xloc=xloc.bar_index, border_width=1, border_color=color.new(color.white, 80), bgcolor=color.new(color.black, 100))
// Draw Overbought Fill (80-100)
stochUpperFill := box.new(ch_left, f_mapY(70, ch_bottom, ch_height), ch_right, f_mapY(80, ch_bottom, ch_height), xloc=xloc.bar_index, border_width=0, bgcolor=color.new(color.red, 100))
// Draw Oversold Fill (0-20)
stochLowerFill := box.new(ch_left, f_mapY(10, ch_bottom, ch_height), ch_right, f_mapY(0, ch_bottom, ch_height), xloc=xloc.bar_index, border_width=0, bgcolor=color.new(color.green, 100))
// Draw Reference Lines
line l80 = line.new(ch_left, f_mapY(80, ch_bottom, ch_height), ch_right, f_mapY(80, ch_bottom, ch_height), color=color.new(color.red, 20), style=line.style_dotted)
line l20 = line.new(ch_left, f_mapY(20, ch_bottom, ch_height), ch_right, f_mapY(20, ch_bottom, ch_height), color=color.new(color.green, 20), style=line.style_dotted)
array.push(stochLines, l80)
array.push(stochLines, l20)
// Draw K and D Lines (ANCHOR TO REALTIME BAR INDEX)
// PATCH: Iterate relative to current bar_index to ensure 0 gap
int sz = array.size(stochK_hist)
for i = 0 to sz - 2
// Logika Mundur: Titik terakhir (sz-1) harus ada di bar_index saat ini
int idx_current = sz - 1 - i
int idx_prev = sz - 2 - i
if idx_prev >= 0
// X Coordinates (Relative to Realtime Bar)
int x2 = bar_index - i
int x1 = bar_index - (i + 1)
// K Line
float yK1 = f_mapY(array.get(stochK_hist, idx_prev), ch_bottom, ch_height)
float yK2 = f_mapY(array.get(stochK_hist, idx_current), ch_bottom, ch_height)
if not na(yK1) and not na(yK2)
line lK = line.new(x1, yK1, x2, yK2, color=color.new(#05492f, 0), width=1)
array.push(stochLines, lK)
// D Line
float yD1 = f_mapY(array.get(stochD_hist, idx_prev), ch_bottom, ch_height)
float yD2 = f_mapY(array.get(stochD_hist, idx_current), ch_bottom, ch_height)
if not na(yD1) and not na(yD2)
line lD = line.new(x1, yD1, x2, yD2, color=color.new(#810404, 0), width=1)
array.push(stochLines, lD)
// ==============================================
// --- VISUALISASI UPGRADE: SMART SUPPLY/DEMAND ZONES ---
// ==============================================
ph_zone = ta.pivothigh(high, zoneLookback, zoneLookback)
pl_zone = ta.pivotlow(low, zoneLookback, zoneLookback)
// FIX: Pindahkan ATR ke luar IF agar konsisten
float atrForZone = ta.atr(14)
var box supplyBoxes = array.new_box()
var box demandBoxes = array.new_box()
// Batasi jumlah zona agar chart tetap bersih
maxZones = 5
// Deteksi Zona Supply (Merah)
if not na(ph_zone) and showSmartZones
// Buat box baru dari titik pivot sampai ke masa depan sedikit
b_sup = box.new(bar_index , high , bar_index + 20, high - (atrForZone*0.5), bgcolor=color.new(color.red, 85), border_color=color.new(color.red, 50))
array.push(supplyBoxes, b_sup)
if array.size(supplyBoxes) > maxZones
box.delete(array.shift(supplyBoxes))
// Deteksi Zona Demand (Hijau)
if not na(pl_zone) and showSmartZones
b_dem = box.new(bar_index , low , bar_index + 20, low + (atrForZone*0.5), bgcolor=color.new(color.lime, 85), border_color=color.new(color.lime, 50))
array.push(demandBoxes, b_dem)
if array.size(demandBoxes) > maxZones
box.delete(array.shift(demandBoxes))
// Perpanjang Zona Secara Realtime
if array.size(supplyBoxes) > 0 and showSmartZones
for i = 0 to array.size(supplyBoxes) - 1
b = array.get(supplyBoxes, i)
// Perpanjang ke bar saat ini + 5 agar terlihat "hidup"
box.set_right(b, bar_index + 5)
if array.size(demandBoxes) > 0 and showSmartZones
for i = 0 to array.size(demandBoxes) - 1
b = array.get(demandBoxes, i)
// Perpanjang ke bar saat ini + 5 agar terlihat "hidup"
box.set_right(b, bar_index + 5)
// ====================================================================================================
// BAGIAN 2: FITUR TAMBAHAN (HSN GHOST CANDLES) - DI-INJECT DI SINI
// ====================================================================================================
// --- TIPE DATA KHUSUS (HSN) ---
type CandleHSN
float o
float c
float h
float l
int o_idx
int c_idx
int h_idx
int l_idx
box body
line wick_up
line wick_down
type ImbalanceHSN
box b
int idx
type CandleSettingsHSN
bool show
string htf
int max_display
type SettingsHSN
int max_sets
color bull_body
color bull_border
color bull_wick
color bear_body
color bear_border
color bear_wick
int offset
int buffer
int htf_buffer
int width
bool trace_show
string trace_anchor
bool label_show
color label_color
string label_size
bool htf_label_show
color htf_label_color
string htf_label_size
bool htf_timer_show
color htf_timer_color
string htf_timer_size
type CandleSetHSN
CandleHSN candles
ImbalanceHSN imbalances
CandleSettingsHSN settings
label tfName
label tfTimer
type HelperHSN
string name = "Helper"
// --- SETUP PENGATURAN HSN ---
SettingsHSN settings = SettingsHSN.new()
var CandleSettingsHSN SettingsHTF1 = CandleSettingsHSN.new()
var CandleSettingsHSN SettingsHTF2 = CandleSettingsHSN.new()
var CandleHSN candles_1 = array.new(0)
var CandleHSN candles_2 = array.new(0)
var CandleSetHSN htf1 = CandleSetHSN.new()
htf1.settings := SettingsHTF1
htf1.candles := candles_1
var CandleSetHSN htf2 = CandleSetHSN.new()
htf2.settings := SettingsHTF2
htf2.candles := candles_2
// --- INPUT KHUSUS HSN CANDLES (15 & 30 MENIT) ---
grp_hsn = "🔥 HSN HTF Candles (Upgrade)"
htf1.settings.show := input.bool(true, "Show HTF 1 (15 Menit)", group=grp_hsn, inline="h1")
htf_1 = input.timeframe("15", "", group=grp_hsn, inline="h1")
htf1.settings.htf := htf_1
htf1.settings.max_display := 4
htf2.settings.show := input.bool(true, "Show HTF 2 (30 Menit)", group=grp_hsn, inline="h2")
htf_2 = input.timeframe("30", "", group=grp_hsn, inline="h2")
htf2.settings.htf := htf_2
htf2.settings.max_display := 4
settings.max_sets := 2
settings.bull_body := color.new(color.green, 60)
settings.bear_body := color.new(color.red, 60)
settings.bull_border := color.new(color.green, 10)
settings.bear_border := color.new(color.red, 10)
settings.bull_wick := color.new(color.green, 10)
settings.bear_wick := color.new(color.red, 10)
// FIXED: Increased default offset from 10 to 25 to avoid overlap with Advisor Bubble
settings.offset := input.int(25, "Padding/Jarak Candle", group=grp_hsn)
settings.buffer := 1
settings.htf_buffer := 5
settings.width := input.int(1, "Lebar Candle", minval = 1, maxval = 4, group=grp_hsn)*2
settings.htf_label_show := true
settings.htf_label_color := color.gray
settings.htf_label_size := size.normal
// --- HELPER FUNCTIONS ---
HelperHSN helper = HelperHSN.new()
color color_transparent = #ffffff00
method ValidTimeframe(HelperHSN helper, string HTF) =>
helper.name := HTF
if timeframe.in_seconds(HTF) >= timeframe.in_seconds("D") and timeframe.in_seconds(HTF) > timeframe.in_seconds()
true
else
n1 = timeframe.in_seconds()
n2 = timeframe.in_seconds(HTF)
n3 = n1 % n2
(n1 < n2 and math.round(n2/n1) == n2/n1)
method HTFName(HelperHSN helper, string HTF) =>
helper.name := "HTFName"
formatted = HTF
seconds = timeframe.in_seconds(HTF)
if seconds < 60
formatted := str.tostring(seconds) + "s"
else if (seconds / 60) < 60
formatted := str.tostring((seconds/60)) + "m"
else if (seconds/60/60) < 24
formatted := str.tostring((seconds/60/60)) + "H"
formatted
method HTFEnabled(HelperHSN helper) =>
helper.name := "HTFEnabled"
int enabled =0
enabled += htf1.settings.show ? 1 : 0
enabled += htf2.settings.show ? 1 : 0
int last = math.min(enabled, settings.max_sets)
last
method CandleSetHigh(HelperHSN helper, CandleHSN candles, float h) =>
helper.name := "CandlesSetHigh"
float _h = h
if array.size(candles) > 0
for i = 0 to array.size(candles)-1
// FIX: Diganti dari c menjadi cItem
CandleHSN cItem = array.get(candles, i)
if cItem.h > _h
_h := cItem.h
_h
method CandlesHigh(HelperHSN helper, CandleHSN candles) =>
helper.name := "CandlesHigh"
h = 0.0
int cnt = 0
int last = helper.HTFEnabled()
if htf1.settings.show and helper.ValidTimeframe(htf1.settings.htf)
h := helper.CandleSetHigh(htf1.candles, h)
cnt += 1
if htf2.settings.show and helper.ValidTimeframe(htf2.settings.htf) and cnt < last
h := helper.CandleSetHigh(htf2.candles, h)
cnt +=1
if array.size(candles) > 0
for i = 0 to array.size(candles)-1
// FIX: Diganti dari c menjadi cItem
CandleHSN cItem = array.get(candles, i)
if cItem.h > h
h := cItem.h
h
method Reorder(CandleSetHSN candleSet, int offset) =>
size = candleSet.candles.size()
if size > 0
for i = size-1 to 0
CandleHSN candle = candleSet.candles.get(i)
t_buffer = offset + ((settings.width+settings.buffer)*(size-i-1))
box.set_left(candle.body, bar_index + t_buffer)
box.set_right(candle.body, bar_index + settings.width + t_buffer)
line.set_x1(candle.wick_up, bar_index+((settings.width)/2) + t_buffer)
line.set_x2(candle.wick_up, bar_index+((settings.width)/2) + t_buffer)
line.set_x1(candle.wick_down, bar_index+((settings.width)/2) + t_buffer)
line.set_x2(candle.wick_down, bar_index+((settings.width)/2) + t_buffer)
top = helper.CandlesHigh(candleSet.candles)
left = bar_index + offset + ((settings.width+settings.buffer)*(size-1))/2
if settings.htf_label_show
var label l = candleSet.tfName
string lbl = helper.HTFName(candleSet.settings.htf)
if not na(l)
label.set_xy(l, left, top)
else
l := label.new(left, top, lbl, color=color_transparent, textcolor = settings.htf_label_color, style=label.style_label_down, size = settings.htf_label_size)
candleSet
method Monitor(CandleSetHSN candleSet) =>
HTFBarTime = time(candleSet.settings.htf)
isNewHTFCandle = ta.change(HTFBarTime)
if isNewHTFCandle
CandleHSN candle = CandleHSN.new()
candle.o := open
candle.c := close
candle.h := high
candle.l := low
candle.o_idx := bar_index
candle.c_idx := bar_index
candle.h_idx := bar_index
candle.l_idx := bar_index
bull = candle.c > candle.o
candle.body := box.new(bar_index, math.max(candle.o, candle.c), bar_index+2, math.min(candle.o, candle.c), bull ? settings.bull_border : settings.bear_border, 1, bgcolor = bull ? settings.bull_body : settings.bear_body)
candle.wick_up := line.new(bar_index+1, candle.h, bar_index, math.max(candle.o, candle.c), color=bull ? settings.bull_wick : settings.bear_wick)
candle.wick_down := line.new(bar_index+1, math.min(candle.o, candle.c), bar_index, candle.l, color=bull ? settings.bull_wick : settings.bear_wick)
candleSet.candles.unshift(candle)
if candleSet.candles.size() > candleSet.settings.max_display
CandleHSN delCandle = array.pop(candleSet.candles)
box.delete(delCandle.body)
line.delete(delCandle.wick_up)
line.delete(delCandle.wick_down)
candleSet
method Update(CandleSetHSN candleSet, int offset) =>
if candleSet.candles.size() > 0
CandleHSN candle = candleSet.candles.first()
candle.h_idx := high > candle.h ? bar_index : candle.h_idx
candle.h := high > candle.h ? high : candle.h
candle.l_idx := low < candle.l ? bar_index : candle.l_idx
candle.l := low < candle.l ? low : candle.l
candle.c := close
candle.c_idx := bar_index
bull = candle.c > candle.o
box.set_top(candle.body, bull ? candle.c : candle.o)
box.set_bottom(candle.body, bull ? candle.o : candle.c)
box.set_bgcolor(candle.body, bull ? settings.bull_body : settings.bear_body)
box.set_border_color(candle.body, bull ? settings.bull_border : settings.bear_border)
line.set_color(candle.wick_up, bull ? settings.bull_wick : settings.bear_wick)
line.set_color(candle.wick_down, bull ? settings.bull_wick : settings.bear_wick)
line.set_y1(candle.wick_up, candle.h)
line.set_y2(candle.wick_up, math.max(candle.o, candle.c))
line.set_y1(candle.wick_down, candle.l)
line.set_y2(candle.wick_down, math.min(candle.o, candle.c))
if barstate.isrealtime or barstate.islast
candleSet.Reorder(offset)
candleSet
// --- EKSEKUSI HSN LOGIC ---
int cnt_hsn = 0
int last_hsn = helper.HTFEnabled()
int offset_hsn = settings.offset
if htf1.settings.show and helper.ValidTimeframe(htf1.settings.htf)
htf1.Monitor().Update(offset_hsn)
cnt_hsn +=1
offset_hsn += cnt_hsn > 0 ? (htf1.candles.size() * settings.width) + (htf1.candles.size() > 0 ? htf1.candles.size()-1 * settings.buffer : 0) + settings.htf_buffer : 0
if htf2.settings.show and helper.ValidTimeframe(htf2.settings.htf) and cnt_hsn < last_hsn
htf2.Monitor().Update(offset_hsn)
cnt_hsn+=1
offset_hsn += cnt_hsn > 0 ? (htf2.candles.size() * settings.width) + (htf2.candles.size() > 0 ? htf2.candles.size()-1 * settings.buffer : 0) + settings.htf_buffer : 0

Timeframe Continuity BarsTimeframe Continuity Bars is a script that is extremely simple for good reason
So please, do not remove this post because it seems 'simple'
Now that's over with. Lets dive in to understand what timeframe continuity IS and what this indicator does.
Timeframe continuity is defined by 4 or more timeframes and it is the relationship of the last price traded to those 4 opening prices. Standard timeframe continuity would be using the M,W,D,60min timeframes.
The reason we use MTF analysis is because of the truth of what price is and how it works.
Price movement is SOLELY caused due to aggressive buying / selling. Some may attempt to refute this however at the end of the day. If the price is at 100.00 it is because a buyer is willing to buy there and a seller is willing to sell there. If those market participants did not want to buy or sell at 100.00 price would go up or down to meet the more aggressive participant.
So what does this look like you may ask...
If an aggressive buyer takes the offer we will see prices go up if they were willing to pay more than the last guy who took the offer.
So price may go from 100.00 to 100.01 because you decided to invest in that stock that day at that time with a market order
This same thing occurs when every other institution creates, adds, reduces, or exits a position. They have to buy or sell and they have to either do it aggressively or do it passively by sitting on the bid / ask and waiting.
So since this is true, we know that the relationship to the opening price is extremely important. This is because if price is above it's open that means buyers were willing to take the offer and buy at higher prices. If price is below it's open it means that sellers were willing to sell at the bid and they sold at lower prices.
So any candlestick chart is simply an aggregation of this aggressive buying/selling that is taking place at all times.
By using the timeframe continuity bars indicator we can measure the distance from the current open across 4 or more timeframes.
By doing this we can identify monthly participation groups, weekly participation groups, daily participation groups, and 60min participation groups.
When all those groups align green or red this is considered full timeframe continuity. Where the monthly weekly daily 60min groups are all taking the offer and buying, or all selling at the bid!
When this aligns this is when price is for CERTAIN going in one direction.
However, It is subject to change every 60 minutes as the 60min determines if those monthly weekly daily buyers are present RIGHT NOW.
So if the 60min changes we go into direct conflict against the month/week/day groups.
If we see the 60min and day align we go into direct conflict against the month/week
if the 60min day and week are red we over-take the monthly group for control. At the time of the week day and 60 being red we have ZERO evidence of the previous monthly buyer/seller that was present.
Now that you understand a little bit about continuity.. Check it out on the chart!
P.S Here is some tips
1) it is not about just all timeframes aligning, we want to see long green / red bars!
2) The opens reset on a cyclical basis. Each day, each week, each month... When the new timeframes open we will see timeframes have the SAME open. When the opens are the same price we have LESS evidence versus having all opens seperate.
3) Investors can use the Y Q M W as their 4 timeframes to see when institutional buying is occurring [go do a case study on AMEX:GLD and AMEX:SLV weekly timeframe with these settings]
4) You need to add 4 separate indicators and change the timeframes. It is ideal to then save this layout!
5) The best way to do price analysis is using #TheStrat across all 4 timeframes instead of one timeframe with this indicator. This is soley a tool we use to show changing of control between participation groups!

Linear Regression Market State IndexStandard Deviation Market Structure Indicator
A Comprehensive Multi-Timeframe Market Analysis Tool
🎯 Overview
The Standard Deviation Market Structure (SDMS) indicator is a sophisticated technical analysis tool that integrates multiple proven methodologies to identify market structure, trend direction, and potential reversal zones. By combining price action, statistical analysis, and momentum indicators across multiple timeframes, SDMS provides traders with a comprehensive view of market dynamics.
✨ Key Features
Multi-Timeframe Integration
Primary analysis on current timeframe
1-hour statistical confirmation for support/resistance levels
Order block extension across 500 future bars
Comprehensive Technical Suite
RSI with Deviation Analysis
Dynamic Order Block Detection
Gaussian Filter Channels
Linear Regression with Statistical Bands
Standard deviation to detect price outliers
Directional Movement Index (DMI/ADX)
Bollinger Band % Analysis
Support/Resistance Line System
Visual Clarity
Color-coded signals and zones
Automatic level management
Clean, intuitive display
📊 Core Components Explained
1. Order Block System
What Are Order Blocks?
Order blocks are price zones where institutional activity has occurred, creating future support or resistance levels. SDMS automatically detects these critical zones.
Detection Logic:
Bullish Order Blocks: Form when price breaks above recent highs following bearish candles
Bearish Order Blocks: Form when price breaks below recent lows following bullish candles
Visual Identification:
Green boxes with "BuOB" labels (support zones)
Red boxes with "BeOB" labels (resistance zones)
Each block shows its boundary price for easy reference
Dynamic Management:
Automatically extends 300 bars into the future
Self-cleaning: removes blocks when price breaches their boundaries
Real-time adjustment to changing market structure
2. Statistical Support/Resistance System
How It Works:
SDMS creates support and resistance lines based on statistical extremes confirmed on the 1-hour timeframe.
Trigger Conditions:
Support Lines (Green): Trigger when 1H Bollinger Band % crosses above 0 and bearish momentum subsides.
Resistance Lines (Red): Trigger when 1H Bollinger Band % crosses below 1 and bullish momentum subsides
The Science Behind BB%:
BB% = (Price - Lower Band) / (Upper Band - Lower Band)
BB% <= 0: Price at statistical oversold extreme; also indicated by white candles.
BB% > 1: Price at statistical overbought extreme; also indicated by white candles.
Line Management:
Maximum of 15 active lines
Oldest lines automatically removed
Lines extend across chart for ongoing reference
3. Trend Analysis Suite
Hull Moving Average (HMA):
55-period smoothed trend indicator
Color-coded: Green = bullish, Red = bearish
Visual band shows trend acceleration/deceleration
Gaussian Channel:
Advanced filtering of market noise
Dynamic channel based on true range volatility
Helps identify mean reversion opportunities
Form a yellow band when price is overbought or oversold zones.
Linear Regression System:
Statistical price modeling
Multiple standard deviation bands (up to 3SD)
Regression-based candlestick visualization
Candles turn white when in overbought zones. Yellow candles indicate extremely overbought zones. Blue candles indicate a bullish trend with high volume.
Bearish candles are bluish-purple when volume is high and red when the volume is within normal ranges or low.
4. Momentum & Oscillator Integration
RSI with Deviation Tracking:
21-period RSI with 30-period smoothing
Tracks deviation from moving average based off linear regression
Identifies momentum divergences
Directional Movement Index:
Multi-period DMI/ADX analysis
Used to detect overbought and oversold zones within the indicator calculations.
Combines with RSI for enhanced signals
Momentum confirmation for all entries/exits
🎯 Trading Signals & Alerts
Buy Signals (Yellow "Buy" Labels)
Multi-Condition Confirmation Required:
RSI Oversold Reversal: RSI crosses above 30
Trend Alignment: HMA showing bullish structure
Momentum Confirmation: DMI alignment
Statistical Support: Price at or near support zones
Risk Management: Multiple confirming indicators
Strong Buy Conditions:
Confluence of order block support + BB% support line
Multiple timeframe alignment
Volume confirmation at key levels
Sell Signals (Red/Yellow "Sell" Labels)
Multi-Condition Confirmation Required:
RSI Overbought Reversal: RSI crosses below 70
Trend Exhaustion: HMA showing bearish structure
Momentum Divergence: DMI bearish alignment
Statistical Resistance: Price at or near resistance zones
Timeframe Confirmation: 1H BB% bearish signals
Strong Sell Conditions:
Confluence of order block resistance + BB% resistance line
Multiple timeframe distribution
Volume surge at resistance
Additional Alerts
RSI Divergence Signals: Triangles showing momentum shifts
Extreme Price Alerts: Circles at statistical extremes
Structure Breaks: Visual cues for order block violations
🎨 Visual System Guide
Color Coding System
Green: Bullish conditions, support zones, rising trends
Red: Bearish conditions, resistance zones, falling trends
Blue: Statistical channels, neutral zones
Yellow: Alert conditions, extreme signals
White: Transition zones, neutral signals
Zone Identification
Buying Pressure Zones: Green/blue tinted areas below price or white candles with white dots within the moving average center line
Selling Pressure Zones: Red tinted areas above price with white dots within the moving average center line
Standard Deviation Zones: Gradient colors showing statistical extremes
⚙️ Customization Options
Adjustable Parameters
RSI Settings: Period, oversold/overbought levels, sensitivity
Order Block Detection: Lookback period, ATR multiplier, extension
Statistical Settings: Gaussian filter poles, regression periods
Support/Resistance: Maximum lines, BB% settings
Visual Preferences: Colors, band displays, alert styles
Input Groups
RSI Trading Strategy
Order Block Configuration
Gaussian Channel Settings
Linear Regression Parameters
DMI/ADX Configuration
Bollinger Band % Settings
📈 Practical Trading Applications
For Swing Traders
Identify Key Levels: Use order blocks + BB% lines for entry/exit planning
Trend Confirmation: HMA + Gaussian channel for trend direction
Risk Management: Standard deviation bands for stop placement
Timing Entries: RSI/DMI alignment for optimal entry timing
For Day Traders
Intraday Levels: Order blocks provide immediate S/R for day trading
Momentum Signals: Real-time RSI/DMI signals for quick moves
Statistical Edges: Gaussian channel for mean reversion plays
Breakout Confirmation: Order block breaks with volume
For Position Traders
Higher Timeframe Structure: 1H BB% lines for major levels
Trend Persistence: HMA for long-term trend identification
Accumulation/Distribution Zones: Order blocks show institutional activity
Multi-Timeframe Alignment: Confirmation across timeframes
🔍 How to Use SDMS Effectively
Step 1: Market Structure Assessment
Identify active order blocks (green/red boxes)
Note BB% support/resistance lines (horizontal lines)
Assess HMA and moving average trend direction (color)
Check Gaussian channel position (preferably outside 2SD)
Step 2: Signal Confirmation
Wait for multiple indicator alignment
look for doji candles.
Confirm with green (bullish) or red (bearish) candles
Confirm with volume if available
Check for confluence of levels
Assess risk/reward based on nearby levels
Step 3: Trade Management
Enter at confirmed support/resistance
Place stops beyond opposite levels
Take profits at next statistical level
Monitor for structure changes
Step 4: Risk Management
Use standard deviation bands for volatility assessment
Never risk more than 1-2% per trade
Adjust position size based on confluence strength
Have predefined exit rules
💡 Advanced Strategies
Strategy 1: Confluence Trading
Setup: Order block + BB% line at same level
Entry: Price tests confluence zone with RSI signal
Stop: Beyond the confluence zone
Target: Next statistical level
Strategy 2: Breakout Trading
Setup: Price approaching order block boundary
Entry: Break with volume + RSI/DMI confirmation
Stop: Re-entry into order block
Target: Next BB% line extension
Strategy 3: Mean Reversion
Setup: Price at Gaussian channel extremes
Entry: RSI reversal signal at channel boundary
Stop: Beyond channel extreme
Target: Channel midline or opposite boundary
⚠️ Important Considerations
Best Market Conditions
Trending Markets: Excellent performance in clear trends
Breakout Scenarios: Strong identification of break levels
Range Markets: Works well with defined ranges
Limitations
Choppy Markets: May give false signals in consolidation
News Events: Fundamental shocks can override technical levels
Timeframe Specific: Optimal on 15-minute to daily charts
Risk Management Rules
Always use stops
Never rely on single signals
Consider market context
Adjust for volatility changes
Keep position sizes consistent
🔧 Technical Specifications
Maximum Lines: 500
Maximum Bars Back: 1000
Maximum Boxes: 500
Calculation Efficiency: Optimized for real-time use
🏆 Why SDMS Stands Out
Unique Advantages
Integrated Approach: Combines multiple methodologies into one tool
Self-Adjusting: Automatically adapts to market changes
Multi-Timeframe: Provides both immediate and higher timeframe context
Visual Clarity: Clean, intuitive display of complex data
Professional Grade: Institutional-level analysis accessible to all traders
Educational Value: Learn how different indicators interact
Understand market structure development
See institutional order flow patterns
Develop disciplined trading habits
📚 Learning Resources
Recommended Study Approach
Start Simple: Focus on order blocks and BB% lines first
Add Complexity: Gradually incorporate other indicators
Paper Trade: Practice without risk
Keep Journal: Document setups and outcomes
Review Regularly: Analyze both wins and losses
Common Pitfalls to Avoid
Overtrading: Wait for high-quality setups
Ignoring Context: Consider overall market conditions
Chasing Signals: Enter at planned levels, not after moves
Risk Mismanagement: Always know your risk before entering
Confirmation Bias: Be objective about signals
🤝 Community & Support
Getting the Most from SDMS
Start with Defaults: Use default settings initially
Adjust Gradually: Make small changes as you understand the tool
Combine with Fundamentals: Use for timing within fundamental context
Stay Disciplined: Follow your trading plan consistently
Continuous Improvement
SDMS is designed for continuous learning. As you use the indicator, you'll develop insights into:
Market microstructure
Institutional trading patterns
Statistical edge identification
Risk management optimization
Risk management is more important than signal accuracy
Patience is required for high-quality setups
Success Factors
Discipline: Following your plan consistently
Patience: Waiting for proper setups
Risk Management: Protecting your capital
Continuous Learning: Improving your skills over time
🌟 Final Thoughts
The Standard Deviation Market Structure indicator represents a sophisticated approach to technical analysis, combining the best elements of price action, statistical analysis, and momentum indicators. While powerful, remember that no indicator guarantees success. SDMS is a tool – your skill, discipline, and risk management determine your trading results.
Use SDMS as part of a comprehensive trading plan, combine it with proper risk management, and continue developing your trading skills. The markets are always teaching – stay humble, stay disciplined, and trade well.
Disclaimer: This indicator is for educational purposes only. Past performance does not guarantee future results. Trading involves risk of loss. Always consult with a qualified financial professional before making investment decisions.

Sakata Reversal MatrixThis indicator automatically detects key candlestick reversal patterns based on the traditional Japanese "Sakata Five Methods."
Key Features: Identifies patterns such as Hammer, Engulfing, Harami, Piercing/Dark Cloud, and Gaps (Sanku).
Strict Star Detection: "Morning Star" and "Evening Star" signals are filtered using a strict logic where the second candle (the star) must be visually isolated from the surrounding candles.
High-Accuracy Filter: Combines RSI (below 30 or above 70) with Bollinger Bands to ensure signals appear only during overbought or oversold conditions, reducing false signals.
Bilingual Support: Easily toggle between Japanese and English labels in the settings.
このインジケーターは、日本の伝統的な相場分析法である「酒田五法」をベースに、主要な反転ローソク足パターンを自動検知します。
主な機能: ハンマー(首吊り線)、包み足、はらみ足、切り込み線、三空などを表示。
厳格な明星判定: 「明けの明星」「宵の明星」は、2本目のローソク足の実体が前後の足から窓を開けて孤立している場合のみ検知する厳格なロジックを採用しています。
高精度フィルタ: RSI(35以下/65以上)とボリンジャーバンドを組み合わせ、相場が過熱しているポイントでのみサインを出すことで、騙しを軽減しています。
バイリンガル対応: 設定から日本語と英語の表示を切り替え可能です。

3LL+Baby & 3HH+Baby Pattern3LL+Baby & 3HH+Baby Pattern Indicator
Overview
This indicator identifies powerful reversal patterns based on momentum exhaustion and inside bar formations. It detects two specific candlestick patterns that signal potential trend reversals: the bullish 3LL+Baby and the bearish 3HH+Baby.
Pattern Descriptions
📈 3LL+Baby Pattern (Bullish Reversal)
Conditions:
Three consecutive candles form lower lows (each low is lower than the previous)
The fourth candle is bullish/green (closes higher than it opens)
The fourth candle is completely contained within the third candle's range (both high and low)
Interpretation: After a downward momentum with three lower lows, a bullish inside bar (baby candle) suggests sellers are exhausted and buyers may be taking control. This pattern often precedes upward reversals.
📉 3HH+Baby Pattern (Bearish Reversal)
Conditions:
Three consecutive candles form higher highs (each high is higher than the previous)
The fourth candle is bearish/red (closes lower than it opens)
The fourth candle is completely contained within the third candle's range (both high and low)
Interpretation: After upward momentum with three higher highs, a bearish inside bar indicates buyers are losing strength and sellers may be gaining control. This pattern often signals potential downward reversals.
Features
Visual Signals
Green Triangle (↑): Appears below bars when 3LL+Baby pattern is detected
Red Triangle (↓): Appears above bars when 3HH+Baby pattern is detected
Labels: Clear text labels identifying each pattern type
Background Highlighting: Subtle background colors (green for bullish, red for bearish)
Customization Options
Toggle labels on/off
Toggle arrow signals on/off
Enable/disable bullish patterns independently
Enable/disable bearish patterns independently
How to Use
Add to Chart: Apply the indicator to any timeframe and instrument
Configure Settings: Adjust visibility options based on your preference
Set Alerts: Create alerts for immediate pattern notifications
Trading Strategy:
3LL+Baby : Consider long positions or closing shorts
3HH+Baby: Consider short positions or closing longs
Always confirm with additional analysis and risk management
Best Practices
Use in conjunction with support/resistance levels
Combine with volume analysis for confirmation
Works on all timeframes (higher timeframes generally more reliable)
Apply proper risk management and stop-loss orders
Consider the broader market context and trend

Pinbar MTF - No Repaint# Pinbar MTF - No Repaint Indicator
## Complete Technical Documentation
---
## 📊 Overview
**Pinbar MTF (Multi-Timeframe) - No Repaint** is a professional-grade TradingView Pine Script indicator designed to detect high-probability pinbar reversal patterns with advanced filtering systems. The indicator is specifically engineered to be **100% non-repainting**, making it reliable for both live trading and backtesting.
### Key Features
✅ **Non-Repainting** - Signals only appear AFTER bar closes, never disappear
✅ **Three-Layer Filter System** - ATR, SWING, and RSI filters
✅ **Automatic SL/TP Calculation** - Based on risk:reward ratios
✅ **Real-time Alerts** - TradingView notifications for all signals
✅ **Visual Trade Management** - Lines, labels, and areas for entries, stops, and targets
✅ **Backtesting Ready** - Reliable historical data for strategy testing
---
## 🎯 What is a Pinbar?
A **Pinbar (Pin Bar/Pinocchio Bar)** is a single candlestick pattern that indicates a potential price reversal:
### Bullish Pinbar (BUY Signal)
- **Long lower wick** (rejection of lower prices)
- **Small body at the top** of the candle
- Shows buyers rejected sellers' attempt to push price down
- Forms at support levels or swing lows
- Entry signal for LONG positions
### Bearish Pinbar (SELL Signal)
- **Long upper wick** (rejection of higher prices)
- **Small body at the bottom** of the candle
- Shows sellers rejected buyers' attempt to push price up
- Forms at resistance levels or swing highs
- Entry signal for SHORT positions
---
## 🔧 How the Indicator Works
### 1. **Pinbar Detection Logic**
The indicator analyzes the **previous closed bar ** to identify pinbar patterns:
```
Bullish Pinbar Requirements:
- Lower wick > 72% of total candle range (adjustable)
- Upper wick < 28% of total candle range
- Close > Open (bullish candle body)
Bearish Pinbar Requirements:
- Upper wick > 72% of total candle range (adjustable)
- Lower wick < 28% of total candle range
- Close < Open (bearish candle body)
```
**Why check ?** By analyzing the previous completed bar, we ensure the pattern is fully formed and won't change, preventing repainting.
---
### 2. **Three-Layer Filter System**
#### 🔍 **Filter #1: ATR (Average True Range) Filter**
- **Purpose**: Ensures the pinbar has significant size
- **Function**: Only signals if pinbar range ≥ ATR value
- **Benefit**: Filters out small, insignificant pinbars
- **Settings**:
- Enable/Disable toggle
- ATR Period (default: 7)
**Example**: If ATR = 50 pips, only pinbars with 50+ pip range will signal.
---
#### 🔍 **Filter #2: SWING Filter** (Always Active)
- **Purpose**: Confirms pinbar forms at swing highs/lows
- **Function**: Validates the pinbar is an absolute high/low
- **Benefit**: Identifies true reversal points
- **Settings**:
- Swing Candles (default: 3)
**How it works**:
- For bullish pinbar: Checks if low is lowest of past 3 bars
- For bearish pinbar: Checks if high is highest of past 3 bars
**Example**: With 3 swing candles, a bullish pinbar must have the lowest low among the last 3 bars.
---
#### 🔍 **Filter #3: RSI (Relative Strength Index) Filter**
- **Purpose**: Confirms momentum conditions
- **Function**: Prevents signals in extreme momentum zones
- **Benefit**: Avoids counter-trend trades
- **Settings**:
- Enable/Disable toggle
- RSI Period (default: 7)
- RSI Source (Close, Open, High, Low, HL2, HLC3, OHLC4)
- Overbought Level (default: 70)
- Oversold Level (default: 30)
**Logic**:
- Bullish Pinbar: Only signals if RSI < 70 (not overbought)
- Bearish Pinbar: Only signals if RSI > 30 (not oversold)
---
### 3. **Stop Loss Calculation**
Two methods available:
#### Method A: ATR-Based Stop Loss (Recommended)
```
Bullish Pinbar:
SL = Pinbar Low - (1 × ATR)
Bearish Pinbar:
SL = Pinbar High + (1 × ATR)
```
**Benefit**: Dynamic stops that adapt to market volatility
#### Method B: Fixed Pips Stop Loss
```
Bullish Pinbar:
SL = Pinbar Low - (Fixed Pips)
Bearish Pinbar:
SL = Pinbar High + (Fixed Pips)
```
**Settings**:
- Calculate Stop with ATR (toggle)
- Stop Pips without ATR (default: 5)
---
### 4. **Take Profit Calculation**
Take Profit is calculated based on Risk:Reward ratio:
```
Bullish Trade:
TP = Entry + (Entry - SL) × Risk:Reward Ratio
Bearish Trade:
TP = Entry - (SL - Entry) × Risk:Reward Ratio
```
**Example**:
- Entry: 1.2000
- SL: 1.1950 (50 pip risk)
- RR: 2:1
- TP: 1.2100 (100 pip reward = 50 × 2)
**Settings**:
- Risk:Reward Ratio (default: 1.0, range: 0.1 to 10.0)
---
## 📈 Visual Elements
### On-Chart Displays
1. **Signal Markers**
- 🟢 **Green Triangle Up** = Bullish Pinbar (BUY)
- 🔴 **Red Triangle Down** = Bearish Pinbar (SELL)
- Placed directly on the pinbar candle
2. **Entry Labels**
- Green "BUY" label with entry price
- Red "SELL" label with entry price
- Shows exact entry level
3. **Stop Loss Lines**
- 🔴 Red horizontal line
- "SL" label
- Extends 20 bars forward
4. **Take Profit Lines**
- 🟢 Green horizontal line
- "TP" label
- Extends 20 bars forward
5. **Risk/Reward Areas** (Optional)
- Red shaded box = Risk zone (Entry to SL)
- Green shaded box = Reward zone (Entry to TP)
- Visual risk:reward visualization
6. **Info Table** (Top Right)
- Displays current settings
- Shows filter status (ON/OFF)
- Real-time RSI value
- Quick reference panel
---
## 🔔 Alert System
Three alert types available:
### 1. Combined Alert: "Pinbar Signal (Any Direction)"
- Fires for BOTH bullish and bearish pinbars
- **Best for**: General monitoring
- **Message**: "Pinbar Signal Detected on {TICKER} at {PRICE}"
### 2. Bullish Alert: "Bullish Pinbar Alert"
- Fires ONLY for BUY signals
- **Best for**: Long-only strategies
- **Message**: "BUY Signal on {TICKER} at {PRICE}"
### 3. Bearish Alert: "Bearish Pinbar Alert"
- Fires ONLY for SELL signals
- **Best for**: Short-only strategies
- **Message**: "SELL Signal on {TICKER} at {PRICE}"
---
## ⚙️ Input Parameters Reference
### **Filters Group**
| Parameter | Default | Range | Description |
|-----------|---------|-------|-------------|
| ATR Filter on Pinbar Range? | ✅ ON | Boolean | Enable/disable ATR filter |
| ATR Period | 7 | 1+ | Lookback period for ATR calculation |
| Swing Candles | 3 | 1+ | Bars to check for swing high/low |
| RSI Filter on Pinbar? | ❌ OFF | Boolean | Enable/disable RSI filter |
| RSI Period | 7 | 2+ | Lookback period for RSI calculation |
| RSI Source | Close | Multiple | Price data for RSI (Close/Open/High/Low/etc) |
| RSI Overbought Level | 70 | 50-100 | Upper threshold for RSI filter |
| RSI Oversold Level | 30 | 0-50 | Lower threshold for RSI filter |
### **Pinbar Detection Group**
| Parameter | Default | Range | Description |
|-----------|---------|-------|-------------|
| Shadow % vs Body | 72 | 50-95 | Minimum wick size as % of total range |
### **Visualization Group**
| Parameter | Default | Range | Description |
|-----------|---------|-------|-------------|
| Show SL and TP Lines? | ✅ ON | Boolean | Display stop loss and take profit lines |
| Show SL and TP Area? | ❌ OFF | Boolean | Show shaded risk/reward boxes |
### **Risk Management Group**
| Parameter | Default | Range | Description |
|-----------|---------|-------|-------------|
| Risk:Reward Ratio | 1.0 | 0.1-10.0 | Target profit vs risk (1.0 = 1:1, 2.0 = 1:2) |
| Calculate Stop with ATR? | ✅ ON | Boolean | Use ATR for stop calculation |
| Stop Pips without ATR | 5 | 1+ | Fixed pip stop when ATR disabled |
---
## 🚫 Non-Repainting Architecture
### What is Repainting?
**Repainting** occurs when an indicator's historical signals differ from what appeared in real-time. This makes backtesting unreliable and can lead to false confidence in a strategy.
### How This Indicator Prevents Repainting
1. **Closed Bar Analysis**
- All calculations use ` ` offset (previous bar)
- Only analyzes COMPLETED candles
- Signals appear on the bar AFTER the pinbar closes
2. **Confirmed Swing Points**
- Waits for sufficient bar history before signaling
- Only checks historical bars that cannot change
- Prevents premature swing detection
3. **Static Alert Timing**
- Alerts fire only after bar completion
- No conditional logic that changes historically
- Same results in replay mode and live trading
### Verification Method
To verify non-repainting behavior:
1. Apply indicator to chart
2. Note signal locations and prices
3. Refresh browser / reload chart
4. **Signals remain in exact same locations**
---
## 💼 Trading Strategy Guidelines
### Entry Rules
**For Bullish Pinbar (LONG):**
1. Wait for green triangle to appear
2. Enter at close of pinbar (shown in label)
3. Alternative: Enter on break of pinbar high
4. Place stop loss at red SL line
5. Set target at green TP line
**For Bearish Pinbar (SHORT):**
1. Wait for red triangle to appear
2. Enter at close of pinbar (shown in label)
3. Alternative: Enter on break of pinbar low
4. Place stop loss at red SL line
5. Set target at green TP line
### Risk Management
- **Position Sizing**: Risk only 1-2% of account per trade
- **Stop Loss**: Always use the calculated SL (never move it wider)
- **Take Profit**: Use calculated TP or trail stop after 1:1 RR
- **Multiple Timeframes**: Confirm signals on higher timeframe
### Best Practices
✅ **DO:**
- Wait for bar to close before entering
- Trade in direction of higher timeframe trend
- Use on liquid markets with clear support/resistance
- Combine with price action analysis
- Keep a trading journal
❌ **DON'T:**
- Enter before bar closes (prevents seeing full pattern)
- Trade against strong trends
- Ignore the filters (they improve win rate)
- Risk more than 2% per trade
- Trade every signal (be selective)
---
## 📊 Backtesting & Data Export
### Available Data Points
The indicator exports these values for strategy development:
| Output | Description |
|--------|-------------|
| Bullish Signal | 1 = BUY signal, 0 = No signal |
| Bearish Signal | 1 = SELL signal, 0 = No signal |
| Bull SL | Stop loss level for long trades |
| Bull TP | Take profit level for long trades |
| Bull Entry | Entry price for long trades |
| Bear SL | Stop loss level for short trades |
| Bear TP | Take profit level for short trades |
| Bear Entry | Entry price for short trades |
### How to Use in Strategy
These values can be accessed by Pine Script strategies using:
```pine
indicator_values = request.security(syminfo.tickerid, timeframe.period,
)
```
---
## 🎓 Understanding the Filters
### Why Use Multiple Filters?
Single-indicator systems often generate too many false signals. This indicator uses a **confluence approach**:
1. **Pinbar Pattern** = Price rejection detected
2. **+ SWING Filter** = Rejection at key level
3. **+ ATR Filter** = Significant move
4. **+ RSI Filter** = Favorable momentum
**Result**: Higher probability setups with better risk:reward
### Filter Optimization
**Conservative Settings** (Fewer, Higher Quality Signals):
- ATR Filter: ON
- Swing Candles: 5
- RSI Filter: ON
- Shadow %: 75%
**Aggressive Settings** (More Signals, More Noise):
- ATR Filter: OFF
- Swing Candles: 2
- RSI Filter: OFF
- Shadow %: 65%
**Balanced Settings** (Recommended):
- ATR Filter: ON
- Swing Candles: 3
- RSI Filter: OFF (or ON for trending markets)
- Shadow %: 72%
---
## 🔍 Troubleshooting
### "No Signals Appearing"
**Possible Causes:**
1. Filters are too strict
2. No pinbars forming on chart
3. Insufficient bar history
**Solutions:**
- Reduce Shadow % to 65%
- Reduce Swing Candles to 2
- Disable ATR or RSI filters temporarily
- Check that chart has enough data loaded
### "Too Many Signals"
**Solutions:**
- Enable ATR filter
- Increase Swing Candles to 4-5
- Enable RSI filter
- Increase Shadow % to 75-80%
### "Signals Appearing Late"
**This is normal behavior!** The indicator:
- Analyzes previous closed bar
- Signals appear on the bar AFTER the pinbar
- This is what prevents repainting
- Signal latency is 1 bar (by design)
---
## 📝 Technical Specifications
**Indicator Type:** Overlay (displays on price chart)
**Pine Script Version:** 5
**Max Labels:** 500
**Max Lines:** 500
**Repainting:** None (100% non-repainting)
**Data Window Values:** 8 exported values
**Alert Types:** 3 (Combined, Bullish, Bearish)
**Performance:**
- Lightweight script (fast execution)
- Works on all timeframes
- Compatible with all markets (Forex, Crypto, Stocks, Futures)
- No data snooping bias
---
## 🎯 Use Cases
### 1. **Swing Trading**
- Timeframe: Daily, 4H
- Filter Settings: All enabled
- Best for: Catching major reversals
### 2. **Day Trading**
- Timeframe: 15m, 1H
- Filter Settings: ATR + SWING only
- Best for: Intraday reversals
### 3. **Scalping**
- Timeframe: 5m, 15m
- Filter Settings: SWING only (aggressive)
- Best for: Quick reversals (requires experience)
### 4. **Position Trading**
- Timeframe: Weekly, Daily
- Filter Settings: All enabled + high RR (2:1 or 3:1)
- Best for: Long-term trend reversal catches
---
## 🏆 Advantages Over Other Pinbar Indicators
✅ **Guaranteed Non-Repainting** - Many pinbar indicators repaint; this one never does
✅ **Automatic SL/TP** - No manual calculation needed
✅ **Multi-Layer Filtering** - Reduces false signals significantly
✅ **Visual Trade Management** - Clear entry, stop, and target levels
✅ **Flexible Configuration** - Adaptable to any trading style
✅ **Alert System** - Never miss a setup
✅ **Backtesting Ready** - Reliable historical data
✅ **Professional Grade** - Suitable for live trading
---
## 📚 Educational Resources
### Recommended Reading on Pinbars
- "The Pin Bar Trading Strategy" by Nial Fuller
- "Price Action Trading" by Al Brooks
- TradingView Education: Price Action Patterns
### Practice Recommendations
1. Paper trade signals for 20+ trades before live trading
2. Backtest on different timeframes and markets
3. Keep detailed records of all trades
4. Analyze winning vs losing setups
5. Refine filter settings based on results
---
## ⚖️ Disclaimer
This indicator is a tool for technical analysis and does not guarantee profits. Trading involves substantial risk of loss. Past performance is not indicative of future results.
- Always use proper risk management
- Never risk more than you can afford to lose
- Consider your trading experience and objectives
- Seek independent financial advice if needed
---
## 📧 Version Information
**Current Version:** 1.0
**Last Updated:** 2024
**Compatibility:** TradingView Pine Script v5
**Status:** Production Ready
---
## 🔄 Future Enhancements (Potential)
Possible future additions:
- Multi-timeframe confirmation option
- Volume filter integration
- Customizable color schemes
- Win rate statistics display
- Partial profit taking levels
- Trailing stop functionality
---
## 📖 Quick Start Guide
### 5-Minute Setup
1. **Add to Chart**
- Open TradingView
- Go to Pine Editor
- Paste the code
- Click "Add to Chart"
2. **Configure Settings**
- Open indicator settings (gear icon)
- Start with default settings
- Enable "Show SL and TP Lines"
3. **Set Alert**
- Right-click indicator name
- Click "Add Alert"
- Select "Pinbar Signal (Any Direction)"
- Configure notification method
4. **Test**
- Scroll back on chart
- Verify signals make sense
- Check that signals don't repaint
5. **Trade** (After Practice!)
- Wait for alert
- Verify signal quality
- Enter, place SL/TP
- Manage trade
---
## 🎯 Final Thoughts
The **Pinbar MTF - No Repaint** indicator is designed for serious traders who value:
- **Reliability** over flashy signals
- **Quality** over quantity
- **Honesty** over false promises
This indicator will NOT:
- Make you rich overnight
- Win every trade
- Replace proper trading education
This indicator WILL:
- Identify high-probability reversal setups
- Save you analysis time
- Provide consistent, non-repainting signals
- Help you develop a systematic trading approach
**Success in trading comes from:**
1. Proper education (60%)
2. Risk management (30%)
3. Technical tools like this indicator (10%)
Use this tool as part of a complete trading plan, not as a standalone solution.


Monday's Range Superpowerkyu🔔 Settings
You can customize the colors and toggle ON/OFF in the indicator settings.
Works on daily, hourly, and minute charts.
Easily visualize Monday’s high, low, and mid-line range.
📌 1. Support & Resistance with Monday’s Range
Monday High: Acts as the first resistance of the week.
◽ Example: If price breaks above Monday’s high after Tuesday, it signals potential bullish continuation → long setup.
Monday Low: Acts as the first support of the week.
◽ Example: If price breaks below Monday’s low, it signals bearish continuation → short setup.
📌 2. Mid-Line Trend Confirmation
Monday Mid-Line = average price of Monday.
Price above mid-line → bullish bias.
Price below mid-line → bearish bias.
Use mid-line breaks as entry confirmation for long/short positions.
📌 3. Breakout Strategy
Break of Monday’s High = bullish breakout → long entry.
Break of Monday’s Low = bearish breakout → short entry.
Place stop-loss inside Monday’s range for a conservative approach.
📌 4. False Breakout Strategy
If price breaks Monday’s high/low but then falls back inside Monday’s range, it is a False Breakout.
Strategy: Trade in the opposite direction.
◽ False Breakout at High → short.
◽ False Breakout at Low → long.
Stop-loss at the wick (extreme point) of the failed breakout.
📌 5. Range-Based Scalping
Use Monday’s high and low as a trading range.
Sell near Monday’s High, buy near Monday’s Low, repeat until breakout occurs.
📌 6. Weekly Volatility Forecast
Narrow Monday range → higher chance of strong trend later in the week.
Wide Monday range → lower volatility expected during the week.
📌 7. Pattern & Trend Analysis within Monday Range
Look for candlestick patterns around Monday’s High/Low/Mid-Line.
◽ Example: Double Top near Monday’s High = short setup.
◽ Repeated bounce at Mid-Line = strong long opportunity.
✅ Summary
The Monday’s Range (Superpowerkyu) Indicator helps traders:
Identify weekly support & resistance
Confirm trend direction with Mid-Line
Trade breakouts & false breakouts
Apply range scalping strategies
Forecast weekly volatility
⚡ Especially, the False Breakout strategy is powerful as it captures failed moves and sudden sentiment reversals.

Hilly's 0010110 Reversal Scalping Strategy - 5 Min CandlesKey Features and Rationale:
Timeframe: Restricted to 5-minute candles as requested.
Pattern Integration: Includes single (Hammer, Shooting Star, Doji), two (Engulfing, Harami), and three-plus (Morning Star, Evening Star) candlestick patterns, plus reversal patterns based on RSI extremes.
VWAP Cross: Incorporates bullish (price crosses above VWAP) and bearish (price crosses below VWAP) signals, enhanced by trend context.
Volume Analysis: Uses a volume spike threshold to filter noise, with a simple day-start volume comparison for financial environment context.
Financial Environment: Approximates the day's sentiment using early-hour volume compared to current volume, adjusted by trend.
Aggregation: Scores each condition (e.g., 1 for basic patterns, 2 for strong patterns like Engulfing, 3 for three-candle patterns) and decides based on weighted consensus, with trendStrength as a tunable threshold.
Risky Approach: Minimal filtering and a low trendStrength (default 0.5) allow frequent signals, aligning with your $100-to-$200 goal, but expect higher risk.
Suggested Inputs:
EMA Length: 10 (short enough for 5-minute sensitivity).
VWAP Lookback: 1 (uses current session VWAP).
Volume Threshold Multiplier: 1.2 (moderate spike requirement).
RSI Length: 14 (standard, adjustable to 7 for more sensitivity).
Trend Strength Threshold: 0.5 (balance between signals; lower to 0.4 for more trades, raise to 0.6 for fewer).

Percentage Change per 5 Candles
🔎 What this indicator does
This indicator calculates and displays the percentage change of each candlestick directly on the chart.
• If a candle closed higher than it opened (bullish candle), it shows a positive % change (green).
• If a candle closed lower than it opened (bearish candle), it shows a negative % change (red).
• Small moves below your chosen threshold (e.g., 0.1%) are ignored to avoid clutter.
• The labels are placed above, below, or in the center of the candle (you choose).
So essentially, every candle “tells you in numbers” exactly how much it changed relative to its opening price.
________________________________________
⚙️ How it operates (the logic inside)
1. Calculate the change
o Formula:
\text{% Change} = \frac{(\text{Close} - \text{Open})}{\text{Open}} \times 100
o Example: If a candle opens at 100 and closes at 105, that’s a +5% change.
2. Round it nicely
o You can control decimals (e.g., show 2 decimals → +5.23%).
3. Filter out noise
o If a candle barely moved (say 0.02%), the label won’t appear unless you reduce the threshold.
4. Style the labels
o Bullish = green text, slightly transparent green background.
o Bearish = red text, slightly transparent red background.
o Neutral (0%) = gray.
5. Place the labels
o Options: above the candle, below the candle, or centered.
o Small vertical offset is applied so labels don’t overlap the candle itself.
________________________________________
📊 How this helps traders
This indicator turns visual candles into quantifiable numbers at a glance. Instead of guessing whether a move was “big” or “small,” you see it clearly.
Key Benefits:
1. Quick volatility analysis
o You can instantly see if candles are making big % swings or just small moves.
o This is especially useful on higher timeframes (daily/weekly) where moves can be large.
2. Pattern confirmation
o For example, you might spot a strong bullish engulfing candle — the % change label helps confirm whether it was truly significant (e.g., +4.5%) or just modest (+0.7%).
3. Noise filtering
o By setting a minimum % threshold, you only see labels when moves are meaningful (say > 0.5%). This keeps focus on important candles.
4. Backtesting & comparison
o You can compare moves across time:
“How strong was this breakout candle compared to the last one?”
“Are today’s bearish candles weaker or stronger than yesterday’s bullish candles?”
5. Better decision-making
o If you’re trading breakouts, reversals, or trend-following, knowing the % size of each candle helps confirm if the move has enough momentum.
________________________________________
✅ In short:
This indicator quantifies price action. Instead of just seeing “green” or “red” candles, you now know exactly how much the price changed in percentage terms, directly on the chart, in real time. It helps you distinguish between strong and weak moves and makes your analysis more precise.
________________________________________