Market SniperV1: Introducing Market Sniper indicator! In this indicator, you can take advantage of the following features:
- 3 ema lines, 2 which intersect to form gold and death crossings and an extra line that can be adjusted in value (particularly useful for the 200 ema)
- 2 out of 20 possible tickers that can be selected based on rank (one being the richest and the other being the weakest performing ticker, out of the rest)
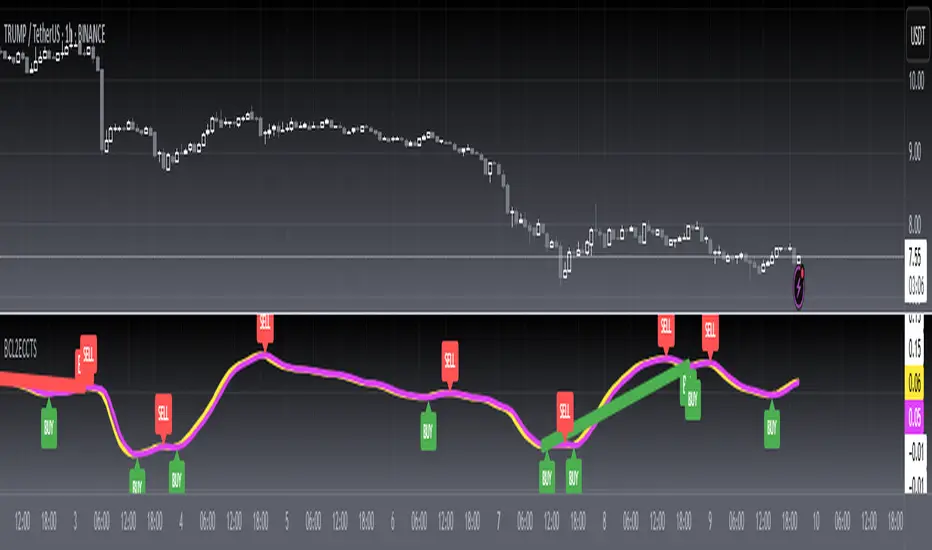
- Dema and Tema clouds for tracking green bullish cycles and red bearish cycles
- Crossing labels with emojis for both gold and death crossings
- Gap percentage between each closing bar and the extra ema line, for guidance and turnaround
- Chart up and Chart down emojis to better keep track of trend, based on last 2 closed bars
- ... and much much more depending on what you want to see!! All fully customizable!
Индикатор Pine Script®