Поиск скриптов по запросу "Exponential"

Exponential weighted volatilityEstimator of current annualized volatility that works for daily, weekly, monthly timeframes.
Lambda should be choosen inside the 0 to 1 range, with a lower lambda giving more weight to the movement in the most recent candlesticks. The literature default is 0.97, I'm setting a default value of 0.94 instead.


Exponential Hull MA Oscillator PrototypeClamped EHMA Oscillator Prototype with 21/200 EHMA with additional JMA smoothing (Credit: @everget)
Note: This is an experiment - this is not a polished indicator


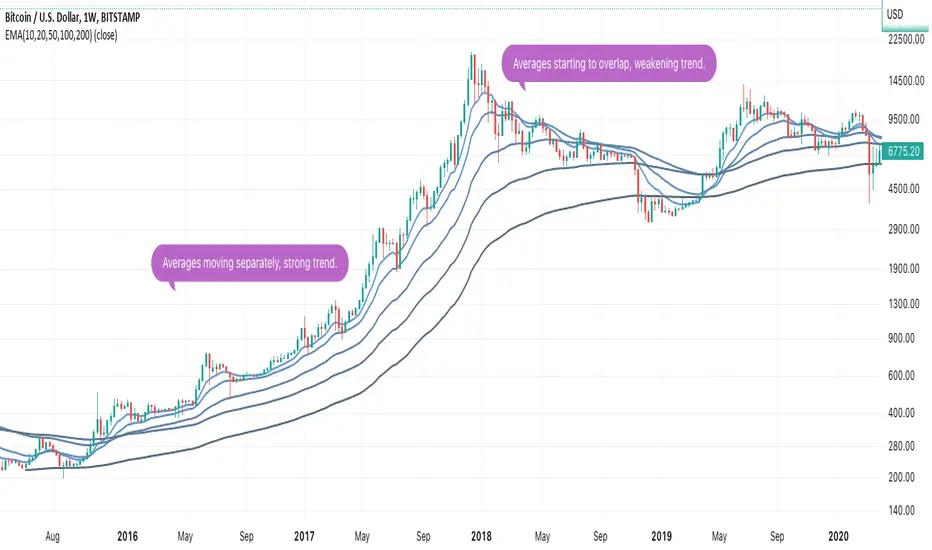
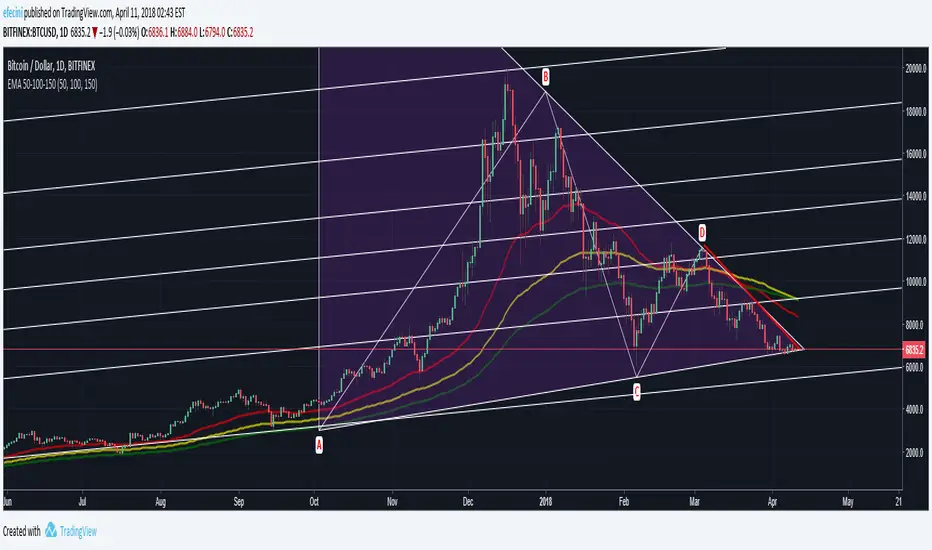
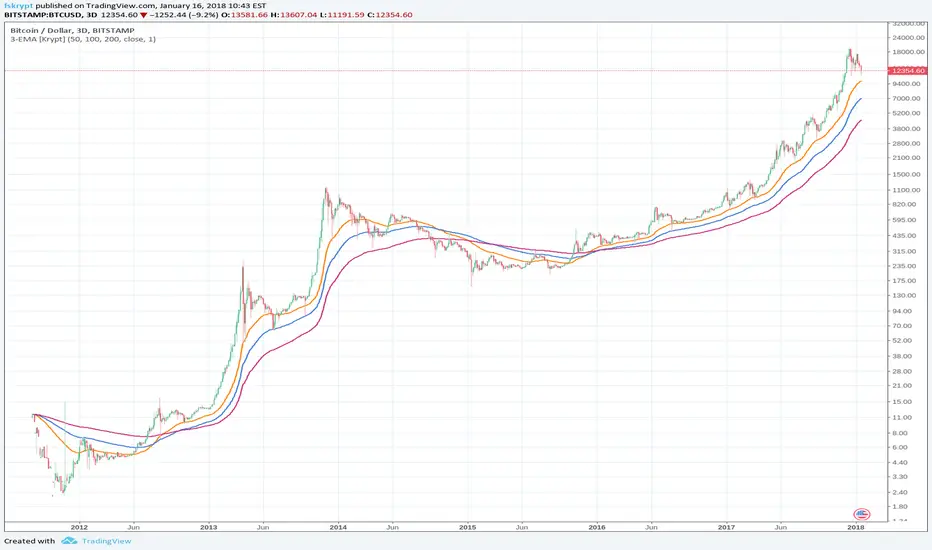
exponential Moving Averagesall in one ema for a select set i use 12/26 then the longer ones 50,100,200


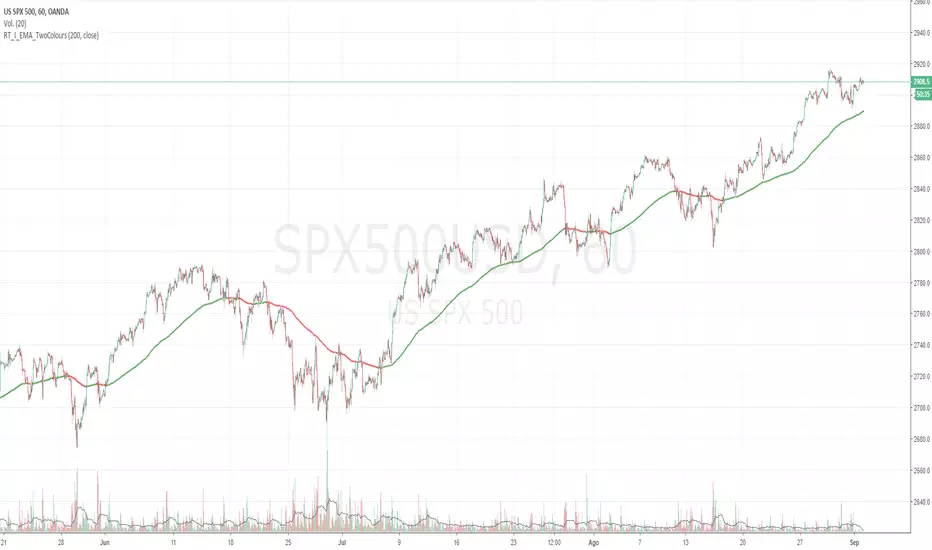
Moving average Two ColoursExponential moving average of 200 periods, which changes color according to the position of the candles.
(200 periods: default configuration Option to change periods allowed)
If the candles are on the EMA, this will have green color, otherwise red color (colors, thickness configurable).
**********************************************************************************************************************************************
Descripción en Español:
Media móvil Exponencial de 200 periodos, la cuál cambia de color según posición de las velas.
(200 periodos: configuración default. Opción de cambio de periodos permitida)
Si las velas están sobre la EMA , esta tendrá color verde, caso contrario color rojo (colores, grosor configurables).


EMA FIBO 4HOURSExponential Moving Averages of 4 Fibonacci Levels((55,144,233,377)*6) in 4 Hour Timezone


EMA Cross x3 (7, 77, 231)Exponential Moving Average at periods, 7, 77, 231. You will see a blue cross when the short EMA crosses the medium EMA, and a green cross when it crosses the long EMA.
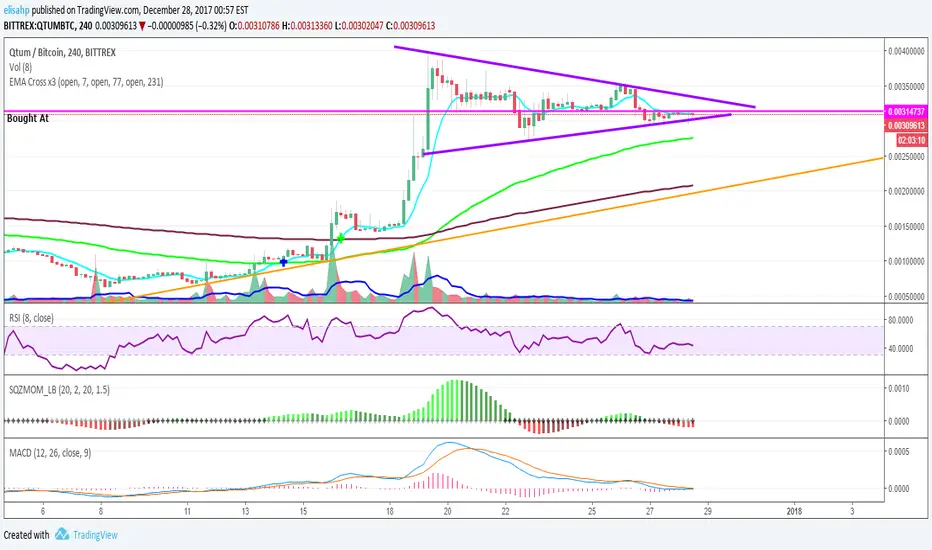
EMA SpreadExponential Moving Average Spread is the percentage spread difference between EMA1 (Slow) and EMA2 (Fast) ie. the gap between two indicators slow and fast. Useful when used alongside EMA cross, MACD, and RSI to strengthen buy/sell signals.

MTF EMAExponential Moving Average indicator that can be configured to display different timeframe EMA's.
Timeframe is set in minutes. Max timeframe currently is the daily (1440 minutes). Any value higher than 1440 will result in no plot.
Examples:
Daily 50 EMA plotted on 4H chart
4H 50 EMA and Daily 50 EMA plotted on 1H chart
Can also work in reverse if needed.
Example, Daily 50 EMA plotted on Weekly Chart


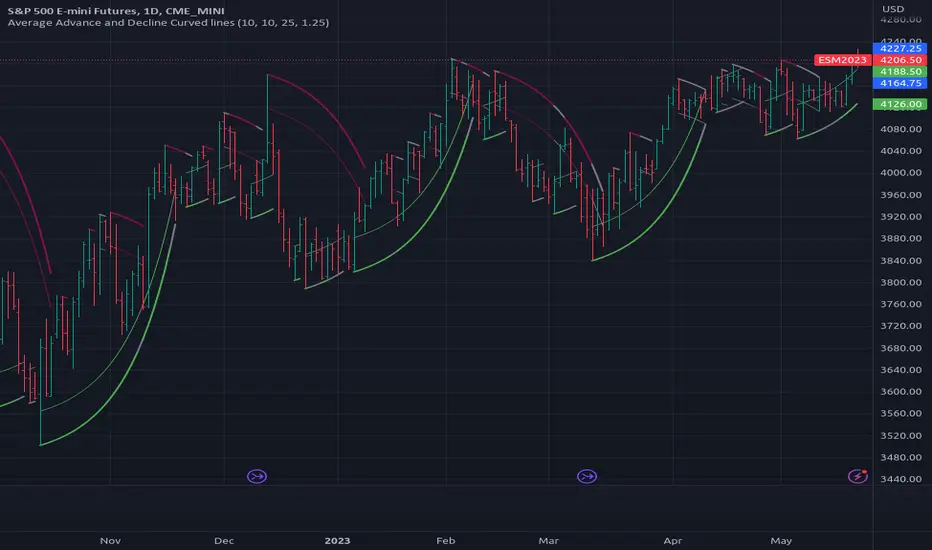
[RS]Average Advance and Decline Curved Lines V0exponential curve linear regression, use falloff multiplier to control curve falloff strength.
MAD Supertrend [Alpha Extract]A sophisticated SuperTrend implementation that replaces traditional ATR calculations with Mean Absolute Deviation methodology for adaptive volatility measurement and band construction. Utilizing SMA baseline with MAD-based deviation bands and optional adaptive factor adjustments, this indicator delivers institutional-grade trend detection with strength-based filtering and dynamic visual feedback. The system's MAD approach provides superior noise reduction compared to ATR while maintaining responsiveness to genuine volatility changes, combined with momentum-based strength calculations for high-conviction signal generation.
🔶 Advanced MAD-Based Band Construction
Implements Mean Absolute Deviation calculation as volatility proxy, measuring absolute price deviations from mean and smoothing for stable band generation without ATR dependency. The system calculates SMA baseline, computes MAD from configurable lookback period, applies factor multipliers to create upper and lower bands, then implements classic SuperTrend ratcheting logic where bands only adjust when price violates previous levels or calculations warrant updates.
// Core MAD SuperTrend Framework
SMA_Value = ta.sma(src, SMA_Length)
Mean = ta.sma(src, MAD_Length)
Abs_Deviation = abs(src - Mean)
MAD_Value = ta.sma(Abs_Deviation, MAD_Length)
// Band Construction with Ratcheting
Upper_Band = SMA_Value + MAD_Factor * MAD_Value
Lower_Band = SMA_Value - MAD_Factor * MAD_Value
// Ratcheting logic prevents premature band adjustments
🔶 Adaptive Factor Adjustment Engine
Features optional adaptive multiplier system that modulates MAD factor based on normalized MAD magnitude relative to recent extremes, creating bands that automatically expand during high-volatility regimes and contract during consolidation. The system applies min-max normalization to MAD values over configurable lookback, multiplies by adaptation parameter, and adds to base factor for dynamic volatility sensitivity without manual recalibration.
🔶 Momentum-Based Strength Filter
Implements sophisticated strength calculation measuring price momentum relative to baseline divided by volatility-adjusted MAD bands, producing normalized 0-1 strength scores with exponential smoothing. The system calculates distance from SMA baseline, normalizes by MAD-derived band width, and applies configurable minimum threshold requiring sufficient momentum before trend signals activate, filtering weak or choppy market conditions.
🔶 SuperTrend Direction Logic
Utilizes classic SuperTrend methodology adapted for MAD bands where trend direction flips on opposite band violations with state persistence until confirmation. The system tracks whether price closes above upper band (bearish flip to bullish) or below lower band (bullish flip to bearish), maintains directional state until opposing violation occurs, and generates binary +1/-1 trend signals suitable for systematic position management.
🔶 Intelligent Candle Sticking System
Provides advanced line positioning option that anchors SuperTrend line to candle wicks or bodies rather than pure calculation values for enhanced visual clarity. The system supports two modes: Wick (positions at high/low extremes based on trend direction) and Body (constrains line between calculation and candle extremes), creating cleaner chart presentation while maintaining mathematical integrity of underlying signals.
🔶 Dynamic Gradient Visualization Framework
Implements color intensity modulation based on smoothed strength calculations, transitioning from muted to vivid hues as momentum conviction increases. The system applies gradient interpolation using strength ratio, creating visual feedback where strong trending moves display intense colors while weak or consolidating conditions show faded tones across trend line, channel bands, and candle coloring for immediate regime assessment.
🔶 MAD Channel Architecture
Features volatility-adjusted channel bands centered on baseline or candle-stuck line with configurable multiplier for support/resistance visualization. The system calculates upper and lower bounds using MAD values scaled by adaptive factors and channel multipliers, applies dynamic transparency based on trend strength, and creates filled regions that intensify during strong trends and fade during weak conditions.
🔶 Multi-Layer Glow Effect System
Provides sophisticated line rendering with triple-layer plot system creating glow effect through progressively wider and more transparent outer layers. The system plots core trend line at specified width with full color intensity, adds inner glow layer at +2 width with moderate transparency, and outer glow at +4 width with higher transparency, creating visual depth and emphasis without cluttering chart space.
🔶 Strength-Based State Management
Implements intelligent trend state logic requiring both directional signal and minimum strength threshold breach before confirming trend transitions. The system calculates raw SuperTrend direction, evaluates smoothed strength against configurable minimum, generates filtered trend state that can be bullish (+1), bearish (-1), or neutral (0), and maintains state persistence using hold logic that prevents oscillation during ambiguous conditions.
🔶 Comprehensive Alert Integration
Generates trend flip alerts when filtered state transitions from bearish to bullish or bullish to bearish with full confirmation requirements satisfied. The system detects state changes through comparison with previous bar, triggers single alert per transition rather than continuous notifications, and provides customizable message templates for automated trading system integration or manual notification preferences.
🔶 Performance Optimization Architecture
Utilizes efficient calculation methods with null value handling, nz() functions preventing errors during initialization bars, and optimized gradient calculations. The system includes intelligent state persistence minimizing recalculation overhead, streamlined MAD computation avoiding redundant mean calculations, and smooth visual updates maintaining consistent performance across extended historical periods.
This indicator delivers sophisticated SuperTrend analysis through Mean Absolute Deviation methodology providing superior statistical properties compared to traditional ATR-based approaches. MAD calculations offer more robust volatility measurement resistant to extreme outliers while maintaining sensitivity to genuine market regime changes. The system's adaptive factor adjustment, momentum-based strength filtering, and dynamic visual feedback make it essential for traders seeking reliable trend-following signals with reduced false breakouts during choppy conditions. The combination of MAD bands, candle-sticking options, gradient strength visualization, and comprehensive filtering creates institutional-grade trend detection suitable for systematic approaches across cryptocurrency, forex, and equity markets with clear entry/exit signals and comprehensive alert capabilities.
