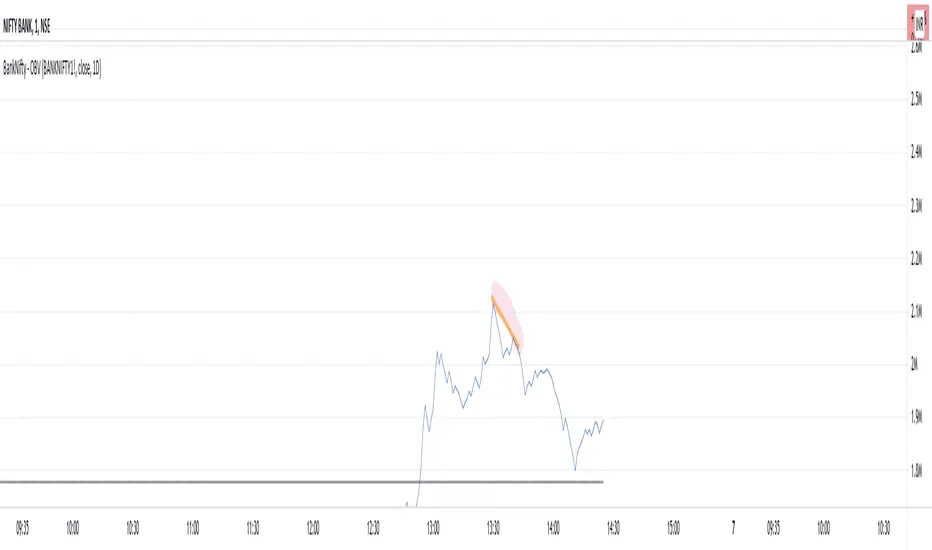
BankNifty - OBVThis script tries to draw OBV for BankNifty using Futures Volume along with Average OBV. For Nifty50 just change the Futures Volume symbol in settings. Look at devations in Price vs OBV or Average OBV breakout.
NSE:NIFTY
NSE:BANKNIFTY
Поиск скриптов по запросу "Futures"
Chanu Delta RSI StrategyThis strategy is built on the Chanu Delta RSI , which indicates the strength of the Bitcoin market. The problem with the previous Chanu Delta Strategy was that it was simply based on the price difference between the two Bitcoin markets, so there was no universality. However, this new Chanu Delta RSI strategy solves the problem by introducing an RSI that compares the price difference trend.
When the Chanu Delta RSI hits “Bull Level” and “Bear Level” and closes the candle, long and short signals are triggered respectively. The example shown on the screen is a default setting optimized for a 4-hour candlestick strategy based on the Bybit BTCUSDT futures market. You can use it by adjusting the setting value and modifying it to suit you.
This strategy is selectable from both reference and large amplitude BTCUSD markets in order to enable fine backtesting. I recommend using BYBIT:BTCUSDT for the reference market and COINBASE:BTCUSD for the large amplitude market.
(Note) Using the "Chanu Delta RSI" to know the current indicator value in real time, it is convenient to predict the signal of the strategy.
(Note) Because the Chanu Delta RSI represents the price difference based on the Bybit BTCUSDT futures market, backtesting is possible from March 2020.
_____________________________________________________________
이 전략은 비트코인 시장의 강점을 나타내는 Chanu Delta RSI를 기반으로 합니다. 기존 Chanu Delta 전략의 문제점은 단순히 두 비트코인 시장의 가격차를 기준으로 하여 보편성이 없었다는 점이다. 하지만 이번 새로운 Chanu Delta RSI 전략은 가격차이 추세를 비교하는 RSI를 도입해 문제를 해결했습니다.
Chanu Delta RSI가 "Bull Level"과 "Bear Level"에 도달하고 봉마감하면 롱, 숏 신호가 각각 트리거됩니다. 화면에 보이는 예시는 Bybit BTCUSDT 선물 시장을 기반으로 한 4시간 캔들스틱 전략에 최적화된 기본 설정입니다. 설정값을 조정하여 자신에게 맞게 수정하여 사용하시면 됩니다.
이 전략은 정밀한 백테스팅을 가능하게 하기 위해 참조 및 큰 진폭 BTCUSD 시장에서 모두 선택할 수 있습니다. 참조 시장에는 BYBIT:BTCUSDT를 사용하고 큰 진폭 시장에는 COINBASE:BTCUSD를 사용하는 것이 좋습니다.
(주) "Chanu Delta RSI"를 이용하여 현재 지표 값을 실시간으로 알 수 있어 전략의 시그널을 예측하는데 편리합니다.
(주) Chanu Delta RSI는 바이비트 BTCUSDT 선물시장을 기준으로 가격차이를 나타내므로 2020년 3월부터 백테스팅이 가능합니다.

How Old Is this Bull Run Getting? Check MA Test Bars SinceThere are many price-based techniques for anticipating the end of a move. However, the simple passage of time can also help because bull markets don’t last forever. While old age doesn’t necessarily cause investors to sell, a reversal becomes more likely the longer a trend lasts.
So, how long have prices been going up? There are various ways to measure that. Our earlier script, MA streak , offered one solution by counting the number of bars that a given moving average has been rising or falling.
Today’s script takes a different approach by counting the number of candles since price touched or crossed a given moving average. It tracks the 50-day simple moving average (SMA) by default. It can be adjusted to other types like exponential and weighted with the AvgType input.
In the chart above, Bars Since MA Test was adjusted to use the 200-day SMA. Viewing the S&P 500 with this study helps put the current market into context.
We can see that prices last touched the 200-day SMA 386 sessions ago (June 29, 2020). That’s relatively long based on history, but not unprecedented. For example, the indicator was at 407 in February 2018 as the market pulled back. It also hit 475 in October 2014 (following the breakout above 2007 highs).
Additionally, the S&P 500 is nearing the record of the 1990s bull market (393 candles on July 12, 1996).
Before that, you have to look all the way back to the 1950s, when it twice peaked at 627.
The conclusion? The current run without a test of the 200-day SMA is above average, but not yet record-setting. It may be interesting to watch as earnings season approaches and the Federal Reserve looks to tighten monetary policy.
TradeStation is a pioneer in the trading industry, providing access to stocks, options, futures and cryptocurrencies. See our Overview for more.
Important Information
TradingView is not affiliated with TradeStation Securities Inc. or its affiliates. TradeStation Securities, Inc., TradeStation Crypto, Inc., and TradeStation Technologies, Inc. are each wholly owned subsidiaries of TradeStation Group, Inc., all operating, and providing products and services, under the TradeStation brand and trademark. When applying for, or purchasing, accounts, subscriptions, products and services, it is important that you know which company you will be dealing with. Please click here for further important information explaining what this means.
This content is for informational and educational purposes only. This is not a recommendation regarding any investment or investment strategy. Any opinions expressed herein are those of the author and do not represent the views or opinions of TradeStation or any of its affiliates.
Investing involves risks. Past performance, whether actual or indicated by historical tests of strategies, is no guarantee of future performance or success. There is a possibility that you may sustain a loss equal to or greater than your entire investment regardless of which asset class you trade (equities, options, futures, or digital assets); therefore, you should not invest or risk money that you cannot afford to lose. Before trading any asset class, first read the relevant risk disclosure statements on the Important Documents page, found here: www.tradestation.com .

MAX4 Ord. Volatility Market ScannerScan volatility of for NEW 15 coin listed on binance futures , print result in label ordered form higher or lower volatility Use it in combination with MAX2 Ord. Volatility Market and MAX1 Ord. Volatility Market Scanner to have all binance futures coin scan

SetSessionTimesLibrary "SetSessionTimes"
Function to automatically set session times for symbols and eventually timezone.
Useful mainly for futures contracts, to differentiate between pit and overnight sessions, and for 24 hours symbols if you want to "create" sessions for them
This library only returns correct session times to the calling script and does nothing by itself on the chart. the calling script must then use the returned session times to do anything.
For example, in the attached chart this library is used by my initial balance indicator, which calls it to retrieve the correct session times for the selected symbol in the chart, given that different futures contracts have different pit session times (RTH times) and Tradingview hasn't implemented that yet.
SetSessionTimes()

Elevated Leverage index System - ELiSELEVATED LEVERAGE index SYSTEM (ELiS) tries to solve the problem of adjusting meaningful leverage in futures and margin trading.
The biggest problem for traders is adjusting the leverage level manually.
Concerning about the volatilities it's very hard to set a meaningful leverage level.
ELiS includes 4 different volatility component which are:
1- nATR: Normalized Average True Range which is actually ATR/price to stabilize ATR's value differences when price changes are high on long term periods.
2- Standard Deviation
3- Kairi based nATR
4- Bollinger %B
which are scaled from 0 to 100 and takes different averages with different combinations & ratios and combines them as an index.
This index calculates an average volatility to set the true leverage level when trading futures especially in Crypto and FX markets.
There are 5 risk levels of "GEARS" like on automobiles to set the max leverage for risk management.
Gear 1 - CONSERVATIVE: max leverage level can be 20 for swing traders and beginners
Gear 2 - STANDARD: max leverage level can be 25 (default) for day traders
Gear 3 - AVERAGE: max leverage level can be 33 for day traders
Gear 4 - RISKY: max leverage level can be 50 for scalpers
Gear 5 - AGRESSIVE: max leverage level can be 100 for advanced scalpers
default length for ATR, Standard Deviation and %B are all 50
Simply:
When markets aren't volatile: ELiS indicateshigher leverage values to maximize profits.
When markets are volatile enough: ELiS indicates lower values to reduce risk level.
hope you all enjoy ELiS on profitable trades.

DCA Bot Long/Short Thanks to @TheTradingParrot for the inspiration and knowledge shared.
Thanks to @ericlin0122 for the original DCA Bot Emulator which is the backbone of this strategy.
The script simulates DCA strategy with parameters used in 3commas DCA bots for futures trading. Experiment with parameters
to find your trading setup.
Beware how large your total leveraged position is and how far can market go before you get liquidated!
Do that with the help of futures liquidation calculators you can find online!
I`ve added:
1) an internal average price and profit calculating, instead of TV`s native one, which is subject to severe slippage.
2) I`ve built a graphic interface, so levels are clearly visible and back-test analyzing made easier.
3) now both Long & Short direction of the strategy exist.
4) trailing TP which was featured in the initial script has been removed because TV`s execution model makes
it impossible to know how the real world trailing would have unfolded.
5) the table is self explanatory, and it is there to help you discover what happened and where.
6) vertical colored lines appear when the new maximum deviation from the original price has
been reached
All the trading happens with total account capital, and all order sizes inputs are expressed in percent.
Known issues:
When deviation is small, and the same candle triggers safety AND the close order, the initial orders are closed, but a
new one opens on the next candle. This is "resolved" by closing the unwanted trade forcefully on the next candle, affecting
profit calculating minimally and guaranteeing that what should be closed has been closed.
The code could be improved through use of arrays, making the table flexible so the number of rows should be dynamic depending
on the number of SOs.
!!!!! IMPORTANT!!!!!
This strategy script is made to receive a signal from an exterior study script, which should plot +100 for long or -100 for short
entry (that is by default - values can be changed in the strategy settings menu). That plot should be found in "Enter Trigger" input
dropdown menu at the bottom of strategy settings menu. Removing the "and trigger == long/short_trigger" condition from strategy entry
conditions makes the strategy open trades ASAP.
Cheers!

Unusual Time Frame VolumeThis script plots the ratio of each volume bar to the average daily volume of that specific bar (at that specific time of day).
You can see what the volume at the 09:30 (or whenever) bar looks like compared to the average volume at the same time during the previous X number of days.
The output can be read like a normal volume chart; however, you can see at a glance whether these is more volume than "normal" for that time of day.
A value of "2" would be 2x the "normal" volume; a value of "0.5" would be half.
Thus, if bars exceed the value of "1", you know that there is more volume than normal.
If the bar exceeds an adjustable threshold, it will change the color of the bar to yellow; otherwise it will be orange for values exceeding "1".
As a consequence to this approach, the plot is effectively normalized such that it obviates the need to scale up or down as volume changes throughout the day.
Notes:
If the settings are not set appropriately for your mode and time frame, the output will be incorrect/invalid!
Make sure you set the "Asset Mode" and "Time Frame (minutes)" to values that match your asset and chart setting. For example, if you are trading Futures on a 2m chart, set the Asset Mode to Futures and Time Frame to 2m. If you are trading crypto on a 5m chart, set the Asset Mode to 24/7 and Time Frame to 5m.
If you choose a "Look-back (Days)" setting that is too far back given the time frame, the script will produce an error. I suggest playing with settings from 1 (compares volume to the previous day's volume) to the highest number that doesn't break the script. For example, at a 2m time frame, the maximum look-back will be 6-7 depending on which mode you are using. Longer time frames allow larger look-back values. I find that the default value (6 Days) does a decent job in general.

Michigandolf's 30min Opening RangeThis script plots the 30min Opening Range as well as the previous day's high & low.
Description:
Blue Line = Top of the 30min Opening Range for the session
Pink Line = Bottom of the 30min Opening Range for the session
White Line = Mid-Point of the 30min Opening Range for the session
White Transparent Area = The full range of the 30min Opening Range
Green Line = Yesterday's High for the session
Red Line = Yesterday's Low for the session
Use:
The Opening Range will continue to expand until the first 30minutes of trading has passed, at which point the range will lock in place for the remainder of the trading session. Many traders use these important levels to gauge trade entries and exits (e.g. Mark Fisher's ACD strategy).
This script does not work currently work for futures (e.g. ES, NQ, RTY) due to the session start time. Will configure for futures trading in a future update.

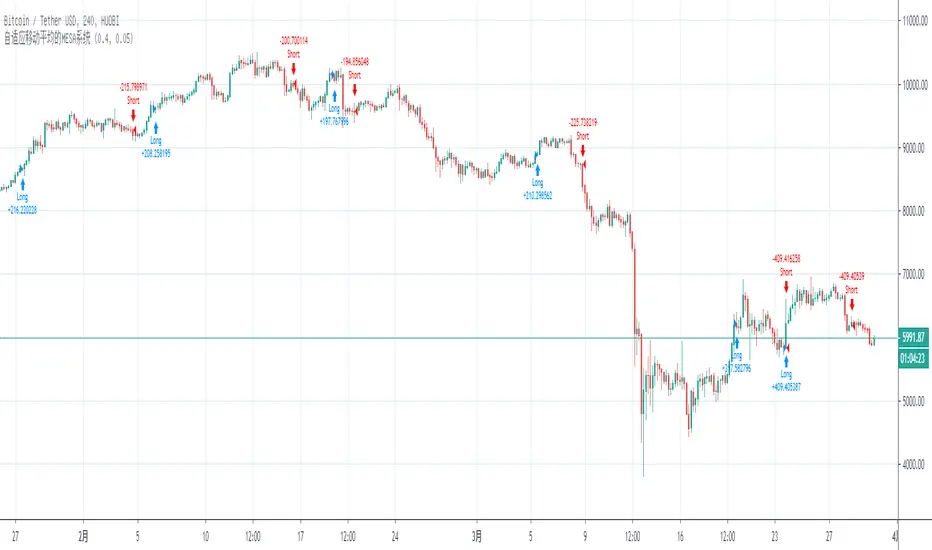
Chanu Delta StrategyThis strategy is built on the Chanu Delta Indicator, which indicates the strength of the Bitcoin market. When the Chanu Delta Indicator hits “Delta_bull” and “Delta_bear” and closes the candle, long and short signals are triggered respectively. The example shown on the screen is a default setting optimized for a 4-hour candlestick strategy based on the Bybit BTCUSDT futures market. For the 15-minute candle, "Delta_bull=32", "Delta_bear=-31", "Source=hlc3" are best. You can use it by adjusting the setting value and modifying it to suit you.
If you use this strategy in conjunction with the Chanu Delta Indicator, it is convenient to anticipate alert signals in advance. Since the Chanu Delta Indicator represents the price difference based on the Bybit BTCUSDT futures market, backtesting is possible from March 2020.

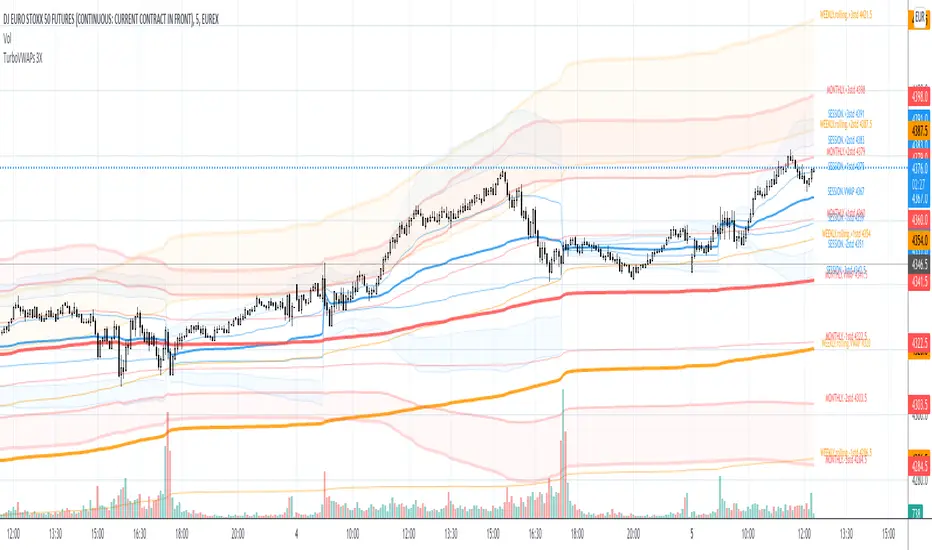
TurboVWAPs 3XAwesome indicator that will plot on your chart up to 3 different VWAPs and optionally up to 3 standard deviations for each one.
Each VWAP can be configured to be a Rolling or Anchored VWAP and to automatically adapt its period depending on the current chart timeframe. For example, you can configure each VWAP to be a rolling 30min VWAP for timeframes below 30M, a session-anchored VWAP between 30M and 1D timeframes, a rolling monthly VWAP for a 1D timeframe and a quarterly VWAP for a weekly timeframe.
You can disable any of the three VWAPs or any of its standard deviations bands.
For session-anchored VWAPs the script will automatically set session times depending on the current futures contract (only for US and EUR futures) if desired. You can disable this feature and manually input session start and end times.
money managementthis indicator has been designed to make your calculations easier and faster.
you can use this indicator to set tp and sl prices based on your entry price, balance,risk and leverage.
it has been designed only for cryptocurrency market and it is not recommended to use it in other markets!
1- enter your balance in the setting of the indicator.
2- enter risk percentage of your balance.
3- enter your sl percentage.
4- enter your tp percentage.
5- set your leverage if you are trading in futures market.
6- and at last set your entry price.
your position size both in spot market and futures market and the exact price of tp and sl , will be shown top right of the screen.
caution: before using this indicator in real market, please make sure that you understand this indicator's behavior and test it.
--------------------------------------------------------------------
این اندیکاتور برای تسریع محاسبات مدیریت سرمایه و سهولت رعایت آن طراحی شده است.
شما میتوانید با وارد کردن پارامترهاقیمت ورودی، سرمایه کل، ریسک و اهرم، قیمت حد سود و ضرر خود را محاسبه کنید.
همچنین اندازه حجم معاملات شما توسط این اندیکاتور محاسبه خواهد شد.
این اندیکاتور برای بازار کریپتوکارنسی طراحی شده است و استفاده از آن در سایر بازارها پیشنهاد نمیشود.
از بخش تنظیمات اندیکاتورمراحل زیر را انجام دهید:
1- میزان سرمایه خود را در قسمت بالانس وارد کنید
2- میزان ریسک سرمایه در هر معامله را مشخص کنید (به درصد)
3- میزان حد ضرر خود را مشخص کنید (به درصد)
4- میزان حد سود خود را مشخص کنید (به درصد)
5- عدد اهرم خود را وارد کنید
6- قیمت ورود به معامله را وارد کنید
توجه: قبل از استفاده این اندیکاتور در بازار لایو لطفا آن را تست کنید و از کارکرد صحیح آن با مدیریت سرمایه خود اطمینان حاصل فرمایید.

Penrose DiagramGreetings Traders! This is my measly 2 dimensional non-curved take on a Penrose Diagram .
What is a Penrose Diagram?
jila.colorado.edu
"A Penrose diagram is a kind of spacetime diagram arranged to make clear the complete causal structure of any given geometry. They are an indispensable map for navigating inside a black hole. Roger Penrose, who invented this kind of diagram in the early 1950s, himself calls them conformal diagrams." - Source: jila.colorado.edu
Penrose Diagrams allow an understanding of an infinite surface by projecting 4D Spheres on 2 Dimension Squares. The 4D shape within the 2D Square has the ability to reference a definable edge on an infinite boundary.
I thought this concept interesting, as I tend to hold a viewpoint of price being infinite in its own nature, and tried to combine the concepts as best I could.
In a true Penrose Diagram, you'd see curvature as you reached the edge of each Diagram Square to represent the curvature of space-time and the distorted boundary. However due to limitations of Pine and perhaps my own abilities, I decided to go the cheap route and opt for straight lines, as well as beginning each new Penrose Diagram on a new Session Start.
Also in this version, you will notice on some instruments that, as an example, two triangles overlap each other when you Extend the Penrose Diagram. The result of this is intentional and is due to the calculation of the first Triangle for the Penrose Diagram. The data points for each triangle are variable upon the average highest/lowest point from Open Price and the Max/Min highest/lowest point from Open Price over a variable amount of days. For typical instruments such as Futures products and Forex, it is common to see differences between the Highest High Breakout & Lowest Low Breakout, and therefore a difference between the true center of the Triangle and the corresponding angles. I prefer to use a 20-Day Average Period for Forex and Futures Products, for Crypto a 30 Day Average Period, all adjustable from the options menu.
Due to the differences between the data points(particularly the difference from the Session Open to the Highest High/ Lowest Low), the initial values for the extended Penrose Diagram will sometimes overlap with the initial triangle for Penrose Diagram creation. However keep in mind, all triangles are exactly the same, just rotated 180°and translated above and below the current Session Open Price. You can confirm this yourself using the handy Triangle Tool in your Drawing Tools directly from your TradingView Chart.
Haven't managed to play around on all instruments yet, so give it a whirl, and any feedback is greatly appreciated. Hope you enjoy!
-@DayTradingOil

MAX3 Ord. Volatility Market ScannerScan volatility of for last 29 coin on binance futures, print result in label ordered form higher or lower volatility Use it in combination with MAX2 Ord. Volatility Market and MAX1 Ord. Volatility Market Scanner to have all binance futures coin scan

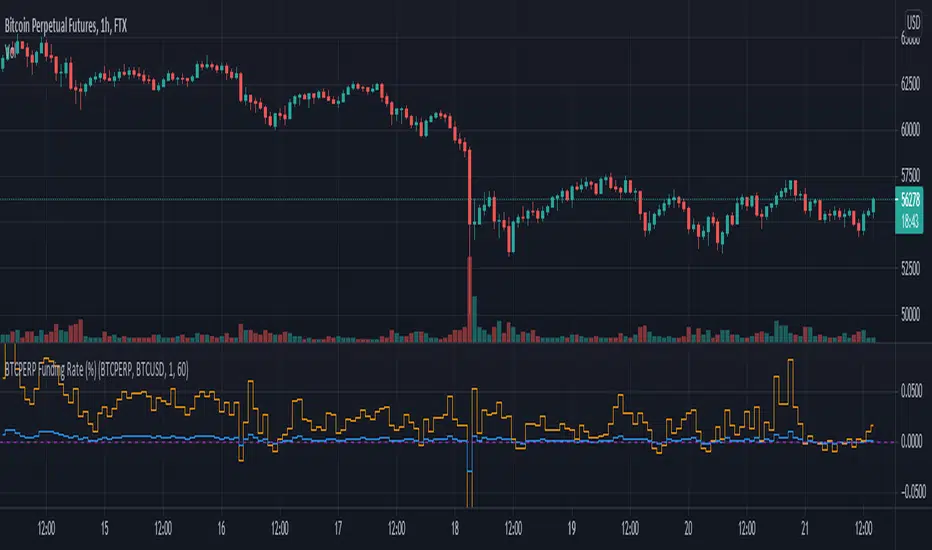
Funding Rate for FTX:BTCPERP (estimated) v0.1 Original credits goes to @Hayemaker, and @NeoButane for the TWAP portions of this script
By @davewhiiite, 2021-03-27
Version 0.1
Summary: The funding rate is the interest charged / credited to a perpetual futures trader for taking a long or short position. The direction of the funding rate is used as an indicator of trader sentiment (+ve = bullish; -ve = bearish), and therefore useful to plot in real time.
The FTX exchange has published the calculation of their funding rate as follows:
TWAP((future - index) / index) / 24
The formula here is the same, but expresses it in the more common % per 8hr duration:
funding = TWAP((future / index) - 1) * (8 / 24) * 100
For reference: future refers to the FTX bitcoin futures contract price (FTX:BTCPERP) and index is the spot price of bitcoin on the exchange (FTX:BTCUSD)
Additional notes:
Probably best to add to the indicator to a new pane, or as secondary axis
Plot this in combination with FTX:BTCPERP or FTX:BTCUSD, or chart of your choice to complement your bitcoin dashboard
Compare to funding rates published on ViewBase
questions? Ask me!
DforDimasik - Premium IndicatorThe indicator is used to show the difference between the futures and spot asset price on cryptocurrencies like BINANCE:BTCUSDTPERP and BINANCE:BTCUSDT
Premium is calculated as Futures Asset Price - Spot Asset Price

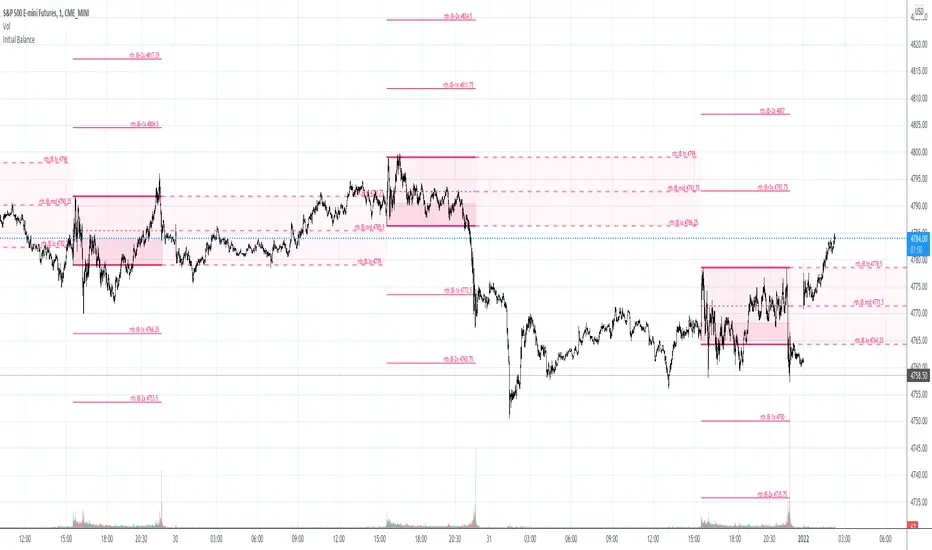
Initial Balance & extensions Custom session time and IB durationThe indicator will plot Initial Balance levels and extensions. The session start and end times are configurable depending on instrument, as well as the Initial Balance end time. The session times must be entered in the underlying instrument's timezone, for example:
ES-futures (Chicago Timezone)
Session Start: 0830
Initial Balance End: 0930
Session End: 1515
US-Stocks (New York Timezone)
Session Start: 0930
Initial Balance End: 1030
Session End: 1600
Europe Futures (Madrid Timezone)
Session Start: 0800
Initial balance End: 0900
Session End: 2200
Colors and linewidths are also customisable.
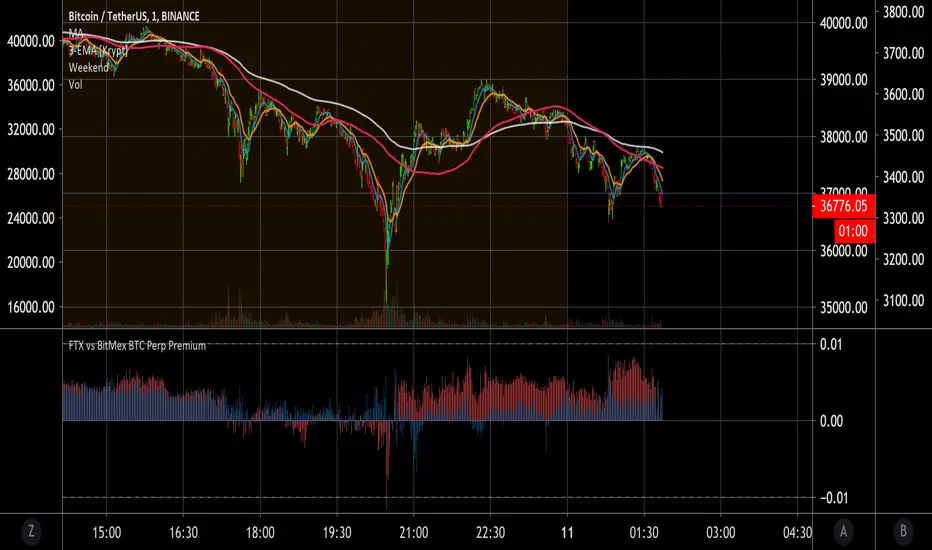
FTX vs BitMex BTC Perp PremiumThis script compares FTX BTC/PERP (BTC perpetual futures contract) price to Binance BTC/USDT spot and colors it red. It also plots Bitmex's BTC perpetual futures compared to Binance spot and colors it blue.
FTX = red
Bitmex = blue
Now you can easily see that you can get a 1% discount on FTX perpetuals when it is tanking. This tells you that you can set your limit buy orders extra low if you like to catch crashes. Also, you can see what your average trader on each platform is willing to pay above or below the spot premium. In general you want to do the opposite of what the average trading is doing on these exchanges unless you're in the main bull or mania phase of the Bitcoin cycle.
If you want to use Bitstamp or your favorite exchange it can be changed in the settings. Let me know if you find any settings that work well for you.
May you profit and enjoy! :)
Zignaly TutorialThis strategy serves as a beginner's guide to connect TradingView signals to Zignaly Crypto Trading Platform.
It was originally tested at BTCUSDT pair and 1D timeframe.
Before using this documentation it's recommended that you:
Use default TradingView strategy script or another script and setup its associated alert manually. Just make the alert pop-up in the screen.
Create a 'Copy-Trader provider' (or Signal Provider) in Zignaly and send signals to it either thanks to your browser or with some basic programming.
SETTINGS
__ SETTINGS - Capital
(CAPITAL) Capital quote invested per order in USDT units {100.0}. This setting is only used when '(ZIG) Provider type' is set to 'Signal Provider'.
(CAPITAL) Capital percentage invested per order (%) {25.0}. This setting is only used when '(ZIG) Provider type' is set to 'Copy Trader Provider'.
__ SETTINGS - Misc
(ZIG) Enable Alert message {True}: Whether to enable alert message or not.
(DEBUG) Enable debug on order comments {True}: Whether to show alerts on order comments or not.
Number of decimal digits for Prices {2}.
(DECIMAL) Maximum number of decimal for contracts {3}.
__ SETTINGS - Zignaly
(ZIG) Integration type {TradingView only}: Hybrid : Both TradingView and Zignaly handle take profit, trailing stops and stop losses. Useful if you are scared about TradingView not firing an alert. It might arise problems if TradingView and Zignaly get out of sync. TradingView only : TradingView sends entry and exit orders to Zignaly so that Zignaly only buys or sells. Zignaly won't handle stop loss or other settings on its own.
(ZIG) Zignaly Alert Type {WebHook}: 'Email' or 'WebHook'.
(ZIG) Provider type {Copy Trader Provider}: 'Copy Trader Provider' or 'Signal Provider'. 'Copy Trader Provider' sends a percentage to manage. 'Signal Provider' sends a quote to manage.
(ZIG) Exchange: 'Binance' or 'Kucoin'.
(ZIG) Exchange Type {Spot}: 'Spot' or 'Futures'.
(ZIG) Leverage {1}. Set it to '1' when '(ZIG) Exchange Type' is set to 'Spot'.
__ SETTINGS - Strategy
(STRAT) Strategy Type: 'Long and Short', 'Long Only' or 'Short Only'.
(STOPTAKE) Take Profit? {false}: Whether to enable Take Profit.
(STOPTAKE) Stop Loss? {True}: Whether to enable Stop Loss.
(TRAILING) Enable Trailing Take Profit (%) {True}: Whether to enable Trailing Take Profit.
(STOPTAKE) Take Profit % {3.0}: Take profit percentage. This setting is only used when '(STOPTAKE) Take Profit?' setting is set to true.
(STOPTAKE) Stop Loss % {2.0}: Stop loss percentage. This setting is only used when '(STOPTAKE) Stop Loss?' setting is set to true.
(TRAILING) Trailing Take Profit Trigger (%) {2.5}: Trailing Stop Trigger Percentage. This setting is only used when '(TRAILING) Enable Trailing Take Profit (%)' setting is set to true.
(TRAILING) Trailing Take Profit as a percentage of Trailing Take Profit Trigger (%) {25.0}: Trailing Stop Distance Percentage. This setting is only used when '(TRAILING) Enable Trailing Take Profit (%)' setting is set to true.
(RECENT) Number of minutes to wait to open a new order after the previous one has been opened {6}.
DEFAULT SETTINGS
By default this strategy has been setup with these beginner settings:
'(ZIG) Integration type' : TradingView only
'(ZIG) Provider type' : 'Copy Trader Provider'
'(ZIG) Exchange' : 'Binance'
'(ZIG) Exchange Type' : 'Spot'
'(STRAT) Strategy Type' : 'Long Only'
'(ZIG) Leverage' : '1' (Or no leverage)
but you can change those settings if needed.
FIRST STEP
For both future of spot markets you should make sure to change '(ZIG) Zignaly Alert Type' to match either WebHook or Email. If you have a non paid account in TradingView as in October 2020 you would have to use Email which it's free to use.
RECOMMENDED SETTINGS
__ RECOMMENDED SETTINGS - Spot markets
'(ZIG) Exchange Type' setting should be set to 'Spot'
'(STRAT) Strategy Type' setting should be set to 'Long Only'
'(ZIG) Leverage' setting should be set to '1'
__ RECOMMENDED SETTINGS - Future markets
'(ZIG) Exchange Type' setting should be set to 'Futures'
'(STRAT) Strategy Type' setting should be set to 'Long and Short'
'(ZIG) Leverage' setting might be changed if desired.
__ RECOMMENDED SETTINGS - Signal Providers
'(ZIG) Provider type' setting should be set to 'Signal Provider'
'(CAPITAL) Capital quote invested per order in USDT units' setting might be changed if desired.
__ RECOMMENDED SETTINGS - Copy Trader Providers
'(ZIG) Provider type' setting should be set to 'Copy Trader Provider'
'(CAPITAL) Capital percentage invested per order (%)' setting might be changed if desired.
Strategy Properties setting: 'Initial Capital' might be changed if desired.
INTEGRATION TYPE EXPLANATION
'Hybrid': Both TradingView and Zignaly handle take profit, trailing stops and stop losses. Useful if you are scared about TradingView not firing an alert. It might arise problems if TradingView and Zignaly get out of sync.
'TradingView only': TradingView sends entry and exit orders to Zignaly so that Zignaly only buys or sells. Zignaly won't handle stop loss or other settings on its own.
HOW TO USE THIS STRATEGY
Beginner: Copy and paste the strategy and change it to your needs. Turn off '(DEBUG) Enable debug on order comments' setting.
Medium: Reuse functions and inputs from this strategy into your own as if it was a library.
Advanced: Check Strategy Tester. List of trades. Copy and paste the different suggested 'alert_message' variable contents to your script.
Expert: I needed a way to pass data from TradingView script to the alert. Now I know it's the 'alert_message' variable. I can do this own my own.
ALERTS SETUP
This is the important piece of information that allows you to connect TradingView to Zignaly in a semi-automatic manner.
__ ALERTS SETUP - WebHook
Webhook URL: https : // zignaly . com / api / signals.php?key=MYSECRETKEY
Message: { {{strategy.order.alert_message}} , "key" : "MYSECRETKEY" }
__ ALERTS SETUP - Email
Setup a new Hotmail account
Add it as an 'SMS email' in TradingView Profile settings page.
Confirm your own the email address
Create a rule in your Hotmail account that 'Redirects' (not forwards) emails to 'signals @ zignaly . email' when (1): 'Subject' includes 'Alert', (2): 'Email body' contains string 'MYZIGNALYREDIRECTTRIGGER' and (3): 'From' contains 'noreply @ tradingview . com'.
In 'More Actions' check: Send Email-to-SMS
Message: ||{{strategy.order.alert_message}}||key=MYSECRETKEY||
MYZIGNALYREDIRECTTRIGGER
'(DEBUG) Enable debug on order comments' is turned on by default so that you can see in the Strategy Tester. List of Trades. The different orders alert_message that would have been sent to your alert. You might want to turn it off it some many letters in the screen is problem.
STRATEGY ADVICE
If you turn on 'Take Profit' then turn off 'Trailing Take Profit'.
ZIGNALY SIDE ADVICE
If you are a 'Signal Provider' make sure that 'Allow reusing the same signalId if there isn't any open position using it?' setting in the profile tab is set to true.
You can find your 'MYSECRETKEY' in your 'Copy Trader/Signal' provider Edit tab at 'Signal URL'.
ADDITIONAL ZIGNALY DOCUMENTATION
docs . zignaly . com / signals / how-to -- How to send signals to Zignaly
3 Ways to send signals to Zignaly
SIGNALS
FINAL REMARKS
This strategy tries to match the Pine Script Coding Conventions as best as possible.

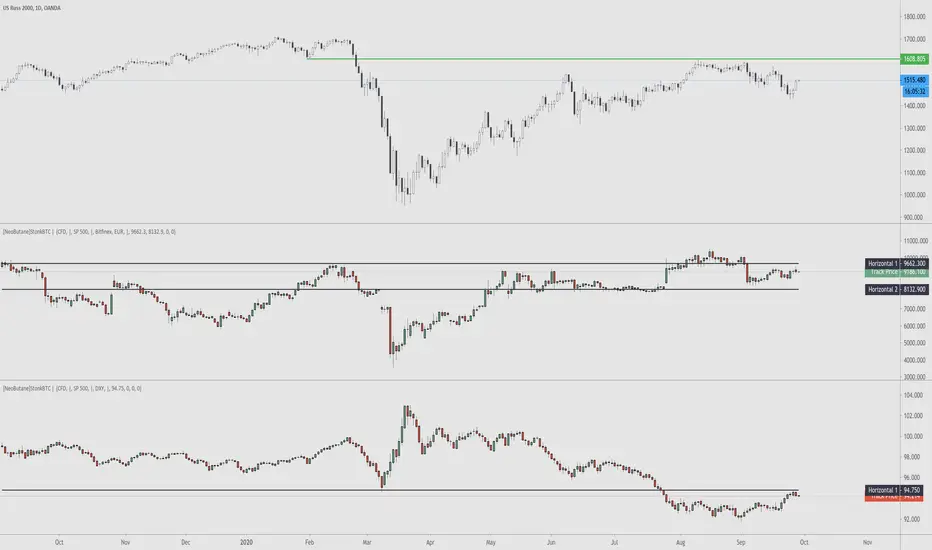
StonkBTC - autoswitch secondary series for scalpersSince the drop in March of 2020, the U.S. ETF , SPY, has been correlated with bitcoin's moves, especially during the NY session.
This tool is meant to help traders who want to take advantage of that without having to switch the secondary series between BTCUSD and (generally) SPY when changing the ticker they are viewing.
How this works:
The indicator will automatically switch between bitcoin or equity index depending on what ticker your current chart is. Ideally this tool would be very simple to use.
Options:
Show/hide a 'track price' line
Index choice of SP500, Nasdaq 100, and Russell 2000. Further selection by ETF, futures, and CFD
Varied bitcoin price sources
Notes:
You will need a separate subscription to TradingView to view realtime CME futures data (if not, it will be delayed by 10 minutes). Because of this, the default option chosen is the CFD for the most complete chart when viewing bitcoin.
NY Core Trading Session: 9:30 a.m. to 4:00 p.m. ET
www.nyse.com
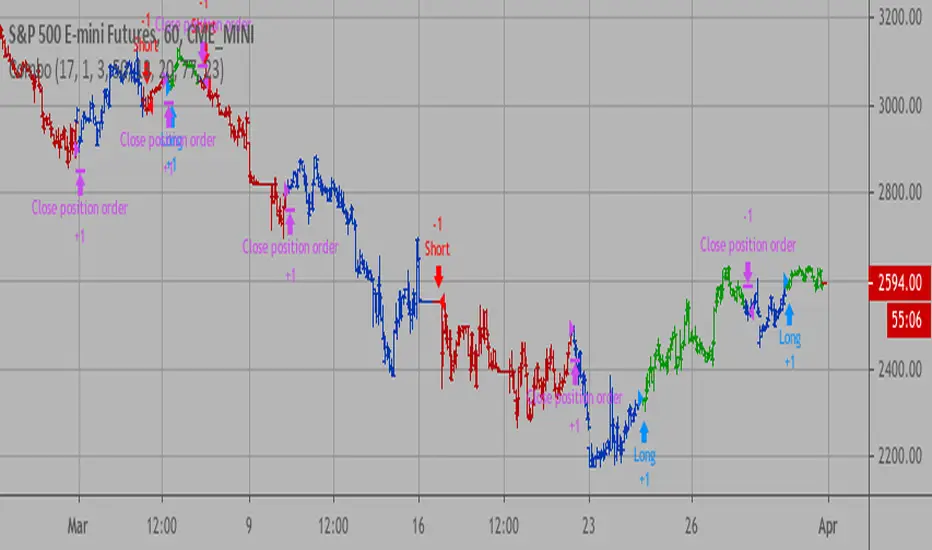
Combo Backtest 123 Reversal & Dynamo This is combo strategies for get a cumulative signal.
First strategy
This System was created from the Book "How I Tripled My Money In The
Futures Market" by Ulf Jensen, Page 183. This is reverse type of strategies.
The strategy buys at market, if close price is higher than the previous close
during 2 days and the meaning of 9-days Stochastic Slow Oscillator is lower than 50.
The strategy sells at market, if close price is lower than the previous close price
during 2 days and the meaning of 9-days Stochastic Fast Oscillator is higher than 50.
Second strategy
In July 1996 Futures magazine, E. Marshall Wall introduces the
Dynamic Momentum Oscillator (Dynamo). Please refer to this article
for interpretation.
The Dynamo oscillator is a normalizing function which adjusts the
values of a standard oscillator for trendiness by taking the difference
between the value of the oscillator and a moving average of the oscillator
and then subtracting that value from the oscillator midpoint.
WARNING:
- For purpose educate only
- This script to change bars colors.
Combo Strategy 123 Reversal & DynamoThis is combo strategies for get a cumulative signal.
First strategy
This System was created from the Book "How I Tripled My Money In The
Futures Market" by Ulf Jensen, Page 183. This is reverse type of strategies.
The strategy buys at market, if close price is higher than the previous close
during 2 days and the meaning of 9-days Stochastic Slow Oscillator is lower than 50.
The strategy sells at market, if close price is lower than the previous close price
during 2 days and the meaning of 9-days Stochastic Fast Oscillator is higher than 50.
Second strategy
In July 1996 Futures magazine, E. Marshall Wall introduces the
Dynamic Momentum Oscillator (Dynamo). Please refer to this article
for interpretation.
The Dynamo oscillator is a normalizing function which adjusts the
values of a standard oscillator for trendiness by taking the difference
between the value of the oscillator and a moving average of the oscillator
and then subtracting that value from the oscillator midpoint.
WARNING:
- For purpose educate only
- This script to change bars colors.

MAMA (Ehlers) MESA Adaptive Moving AverageMAMA ( Ehlers ) MESA Adaptive Moving Average:
What it is and how it works
MESA Phasor is the most advanced futures trading program on the market!
MESA Phasor derives its name from the sinewave generator you probably recall from your high school trigonometry class. As you can see in the diagram, the rotating phasor generates a sine wave in the time domain, visualized as a shadow from the arrow tip of the phasor on the vertical axis. A cycle is completed on each full rotation of the phasor. The angle of the phasor increases at a constant rate, and is reset to zero when 360 degrees of rotation have been achieved. The idea of the trading system is to buy low at the valley of the sine wave , when phasor passes the lower angle, and to sell short at the crest of the sine wave , when the phasor passes the upper angle. Now the trade entries and exits are defined in terms of angles, which are in the frequency domain. Therefore, trading decisions are removed from waveform vagaries in the time domain. This means that the trading decisions are robust across various futures contracts and across all kinds of market conditions.