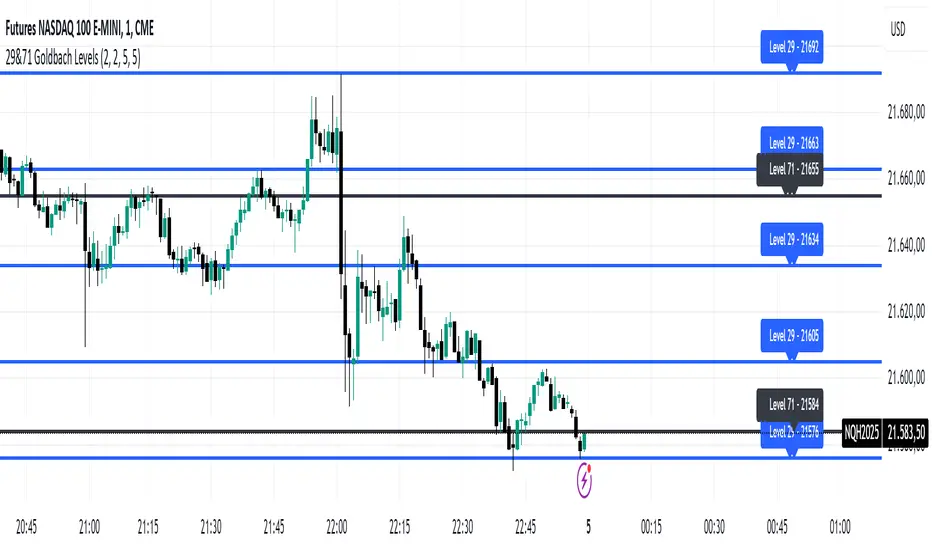
29&71 Goldbach levelsThe indicator automatically plots horizontal lines at the 29 and 71 price levels on your chart. These levels serve as psychological barriers in the market, where price action may react or consolidate, just as prime numbers are fundamental in the theory of numbers.
---
Features:
- 29 Level: Identifies significant areas where market participants may encounter support or resistance, similar to the importance of prime numbers in Goldbach's conjecture.
- 71 Level: Marks another key zone that might indicate possible price breakouts or reversals, offering traders a reference point for decision-making.
- Customizable: You can adjust the colors, line styles, or alerts associated with these levels to fit your trading preferences.
How to Use:
- Use the 29 and 71 levels to spot potential areas of support or resistance on the chart.
- Watch for price reactions at these levels for possible breakout or reversal setups.
- Combine the levels with other technical indicators for added confirmation.
---
This indicator blends the theory of prime numbers with market analysis, offering traders a novel approach to identifying key levels that might influence price movements.
Поиск скриптов по запросу "GOLD"
FuTech : MACD Crossovers Advanced Alert Lines=============================================================
Indicator : FuTech: MACD Crossovers Advanced Alert Lines
Overview:
The "FuTech: MACD Crossovers Advanced Alert Lines" indicator is designed to assist traders in identifying key technical patterns using the :-
1. MACD (Moving Average Convergence Divergence) and
2. Golden/Death Crossovers
By visualizing these indicators directly on the chart with advanced lines, it helps traders make more informed decisions on when to enter or exit trades.
=============================================================
Key Features of "FuTech: MACD Crossovers Advanced Alert Lines":
1. MACD Crossovers:
a) The MACD is one of the most widely used indicators for identifying momentum shifts and potential buy/sell signals. This indicator plots vertical lines on the chart whenever the MACD line crosses the signal line.
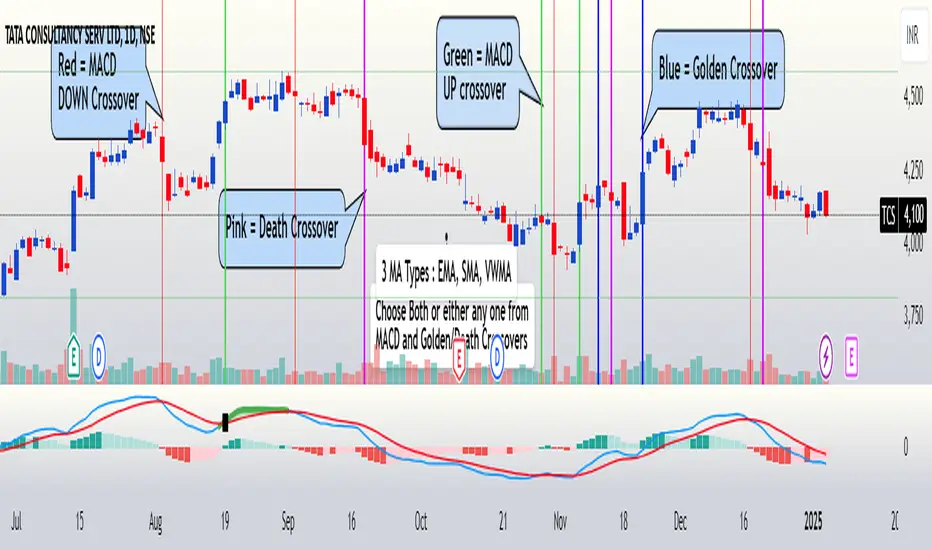
b) Upward Crossover (Bullish Signal) : When the MACD line crosses above the signal line, a green vertical line will appear, indicating a potential buying opportunity.
c) Downward Crossover (Bearish Signal) : When the MACD line crosses below the signal line, a red vertical line will appear, signaling a potential selling opportunity.
2. Golden Cross & Death Cross:
a) The Golden Cross occurs when the price moves above a long-term moving average (like the 50-day moving average), signaling a potential upward trend.
b) The Death Cross occurs when the price moves below a long-term moving average, signaling a potential downward trend.
c) These crossovers are displayed with customizable lines on the chart to easily spot when the market is shifting direction.
d) Golden Cross (Bullish Signal) : A blue vertical line appears when the price crosses above the selected long-term moving average.
e) Death Cross (Bearish Signal) : A purple vertical line appears when the price crosses below the selected long-term moving average.
=============================================================
Customization Options:
This indicator offers several customization options to suit your trading preferences:
1) MACD Settings:
a) Choose between different moving average types (EMA, SMA, or VWMA) for calculating the MACD.
b) Adjust the lengths of the fast, slow, and signal MACD periods.
c) Control the width and color of the vertical lines drawn on the chart for both up and down crossovers.
2) Golden Cross / Death Cross Settings:
a) Select the moving average type for the Golden Cross / Death Cross (EMA, SMA, or VWMA).
b) Define the lookback period for calculating the Golden Cross / Death Cross.
c) Customize the appearance of the Golden and Death Cross lines, including their width and color.
You can use both as well as either of the MACD lines or Golden Crossover / Death Crossover Lines respectively as per your trading strategies
=============================================================
How "FuTech: MACD Crossovers Advanced Alert Lines" indicator Works:
a) The indicator monitors the price and calculates the MACD and Golden/Death Crosses.
b) When the MACD line crosses above or below the signal line, or when the price crosses above or below the long-term moving average, it plots a vertical line on the chart.
c) These lines help traders quickly spot potential turning points in the market, providing clear signals to act upon.
=============================================================
Use Case:
a) Swing Traders: The indicator is useful for spotting momentum shifts and trend reversals, helping you time entries and exits for short- to medium-term trades.
b) Long-Term Traders: The Golden and Death Cross signals help identify major trend changes, giving insights into potential market shifts.
=============================================================
Why Use This "FuTech: MACD Crossovers Advanced Alert Lines" Indicator ?
a) Clear Visuals : The vertical lines provide clear and easy-to-spot signals for MACD crossovers and Golden/Death Crosses.
b) Customizable : Adjust settings for your personal trading strategy, whether you're focusing on short-term momentum or long-term trend shifts.
c) Supports Decision Making : With its advanced line plotting and customizable features, this indicator helps you make quicker and more informed trading decisions.
=============================================================
How to Use:
a) MACD Crossovers: Look for green lines to signal potential buying opportunities (when the MACD line crosses above the signal line) and red lines for selling opportunities (when the MACD line crosses below the signal line).
b) Golden Cross / Death Cross: Use the blue lines to confirm when a positive trend may begin (Golden Cross) and purple lines to warn when a negative trend may start (Death Cross).
=============================================================
Conclusion:
"FuTech: MACD Crossovers Advanced Alert Lines" indicator combines two powerful technical analysis tools, the MACD and Golden/Death Crosses, to provide clear, actionable signals on your chart.
By customizing the appearance of these signals and combining them with your trading strategy, you can enhance your decision-making process and improve your trading outcomes.
=============================================================
Thank you !
Jai Swaminarayan Dasna Das !
He Hari ! Bas Ek Tu Raji Tha !
=============================================================
CE - 42MACRO Fixed Income and Macro This is Part 2 of 2 from the 42MACRO Recreation Series
However, there will be a bonus Indicator coming soon!
The CE - 42MACRO Fixed Income and Macro Table is a next level Macroeconomic and market analysis indicator.
It aims to provide a probabilistic insight into the market realized GRID Macro regimes,
track a multiplex of important Assets, Indices, Bonds and ETF's to derive extra market insights by showing the most important aggregates and their performance over multiple timeframes... and what that might mean for the whole market direction.
For traders and especially investors, the unique functionalities will be of high value.
Quick guide on how to use it:
docs.google.com
WARNING
By the nature of the macro regimes, the outcomes are more accurate over longer Chart Timeframes (Week to Months).
However, it is also a valuable tool to form an advanced,
market realized, short to medium term bias.
NOTE
This Indicator is intended to be used alongside the 1nd part "CE - 42MACRO Equity Factor"
for a more wholistic approach and higher accuracy.
Methodology:
The Equity Factor Table tracks specifically chosen Assets to identify their performance and add the combined performances together to visualize 42MACRO's GRID Equity Model.
For this it uses the below Assets:
Convertibles ( AMEX:CWB )
Leveraged Loans ( AMEX:BKLN )
High Yield Credit ( AMEX:HYG )
Preferreds ( NASDAQ:PFF )
Emerging Market US$ Bonds ( NASDAQ:EMB )
Long Bond ( NASDAQ:TLT )
5-10yr Treasurys ( NASDAQ:IEF )
5-10yr TIPS ( AMEX:TIP )
0-5yr TIPS ( AMEX:STIP )
EM Local Currency Bonds ( AMEX:EMLC )
BDCs ( AMEX:BIZD )
Barclays Agg ( AMEX:AGG )
Investment Grade Credit ( AMEX:LQD )
MBS ( NASDAQ:MBB )
1-3yr Treasurys ( NASDAQ:SHY )
Bitcoin ( AMEX:BITO )
Industrial Metals ( AMEX:DBB )
Commodities ( AMEX:DBC )
Gold ( AMEX:GLD )
Equity Volatility ( AMEX:VIXM )
Interest Rate Volatility ( AMEX:PFIX )
Energy ( AMEX:USO )
Precious Metals ( AMEX:DBP )
Agriculture ( AMEX:DBA )
US Dollar ( AMEX:UUP )
Inverse US Dollar ( AMEX:UDN )
Functionalities:
Fixed Income and Macro Table
Shows relative market Asset performance
Comes with different Calculation options like RoC,
Sharpe ratio, Sortino ratio, Omega ratio and Normalization
Allows for advanced market (health) performance
Provides the calculated, realized GRID market regimes
Informs about "Risk ON" and "Risk OFF" market states
Visuals - for your best experience only use one (+ BarColoring) at a time:
You can visualize all important metrics:
- GRID regimes of the currently chosen calculation type
- Risk On/Risk Off with background colouring and additional +1/-1 values
- a smoother GRID model
- a smoother Risk On/ Risk Off metric
- Barcoloring for enabled metric of the above
If you have more suggestions, please write me
Fixed Income and Macro:
The visualisation of the relative performance of the different assets provides valuable information about the current market environment and the actual market performance.
It furthermore makes it possible to obtain a deeper understanding of how the interconnected market works and makes it simple to identify the actual market direction,
thus also providing all the information to derive overall market health, market strength or weakness.
Utility:
The Fixed Income and Macro Table is divided in 4 Columns which are the GRID regimes:
Economic Growth:
Goldilocks
Reflation
Economic Contraction:
Inflation
Deflation
Top 5 Fixed Income/ Macro Factors:
Are the values green for a specific Column?
If so then the market reflects the corresponding GRID behavior.
Bottom 5 Fixed Income/ Macro Factors:
Are the values red for a specific Column?
If so then the market reflects the corresponding GRID behavior.
So if we have Goldilocks as current regime we would see green values in the Top 5 Goldilocks Cells and red values in the Bottom 5 Goldilocks Cells.
You will find that Reflation will look similar, as it is also a sign of Economic Growth.
Same is the case for the two Contraction regimes.
******
This Indicator again is based to a majority on 42MACRO's models.
I only brought them into TV and added things on top of it.
If you have questions or need a more in-depth guide DM me.
GM

CE - 42MACRO Equity Factor Table This is Part 1 of 2 from the 42MACRO Recreation Series
The CE - 42MACRO Equity Factor Table is a whole toolbox packaged in a single indicator.
It aims to provide a probabilistic insight into the market realized GRID Macro Regime, use a multiplex of important Assets and Indices to form a high probability Implied Correlation expectation and allows to derive extra market insights by showing the most important aggregates and their performance over multiple timeframes... and what that might mean for the whole market direction, as well as the underlying asset.
WARNING
By the nature of the macro regimes, the outcomes are more accurate over longer Chart Timeframes (Week to Months).
However, it is also a valuable tool to form a proper,
market realized, short to medium term bias.
NOTE
This Indicator is intended to be used alongside the 2nd part "CE - 42MACRO Yield and Macro"
for a more wholistic approach and higher accuracy.
Due to coding limitations they can not be merged into one Indicator.
Methodology:
The Equity Factor Table tracks specifically chosen Assets to identify their performance and add the combined performances together to visualize 42MACRO's GRID Equity Model.
For this it uses the below Assets, with more to come:
Dividend Compounders ( AMEX:SPHD )
Mid Caps ( AMEX:VO )
Emerging Markets ( AMEX:EEM )
Small Caps ( AMEX:IWM )
Mega Cap Growth ( NASDAQ:QQQ )
Brazil ( AMEX:EWZ )
United Kingdom ( AMEX:EWU )
Growth ( AMEX:IWF )
United States ( AMEX:SPY )
Japan ( AMEX:DXJ )
Momentum ( AMEX:MTUM )
China ( AMEX:FXI )
Low Beta ( AMEX:SPLV )
International ex-US ( NASDAQ:ACWX )
India ( AMEX:INDA )
Eurozone ( AMEX:EZU )
Quality ( AMEX:QUAL )
Size ( AMEX:OEF )
Functionalities:
1. Correlations
Takes a measure of Cross Market Correlations
2. Implied Trend
Calculates the trend for each Asset and uses the Correlation to obtain the Implied Trend for the underlying Asset
There are multiple functionalities to enhance Signal Speed and precision...
Reading a signal only over a certain threshold, otherwise being colored in gray to signal noise or unclear market behavior
Normalization of Signal
Double Normalization of Signal for more Speed... ideal for the Crypto Market
Using an additional Hull Moving Average to enhance Signal Speed
Additional simple Background coloring to get a Signal from the HMA
Barcoloring based on the Implied Correlation
3. Equity Factor Table
Shows market realized Asset performance
Provides the approximate realized GRID market regimes
Informs about "Risk ON" and "Risk OFF" market states
Now into the juicy stuff...
Visuals:
There is a variety of options to change visual settings of what is plotted and where
+ additional considerations.
Everything that is relevant in the underlying logic which can improve comprehension can be visualized with these options.
More to come
Market Correlation:
The Market Correlation Table takes the Correlation of all the Assets to the Asset on the Chart,
it furthermore uses the Normalized KAMA Oscillator by IkkeOmar to analyse the current trend of every single Asset.
(To enhance the Signal you can apply the mentioned Indicator on the relevant Assets to find your target Asset movements that you intend to capture...
and then change the length of the Indicator in here)
It then Implies a Correlation based on the Trend and the Correlation to give a probabilistically adjusted expectation for the future Chart Asset Movement.
This is strengthened by taking the average of all Implied Trends.
Thus the Correlation Table provides valuable insights about probabilistically likely Movement of the Asset over the defined time duration,
providing alpha for Traders and Investors alike.
Equity Factors:
The table provides valuable information about the current market environment (whether it's risk on or risk off),
the rough GRID models from 42MACRO and the actual market performance.
This allows you to obtain a deeper understanding of how the market works and makes it simple to identify the actual market direction,
makes it possible to derive overall market Health and shows market strength or weakness.
Utility:
The Equity Factor Table is divided in 4 Sections which are the GRID regimes:
Economic Growth:
Goldilocks
Reflation
Economic Contraction:
Inflation
Deflation
Top 5 Equity Factors:
Are the values green for a specific Column?
If so then the market reflects the corresponding GRID behavior.
Bottom 5 Equity Factors:
Are the values red for a specific Column?
If so then the market reflects the corresponding GRID behavior.
So if we have Goldilocks as current regime we would see green values in the Top 5 Goldilocks Cells and red values in the Bottom 5 Goldilocks Cells.
You will find that Reflation will look similar, as it is also a sign of Economic Growth.
Same is the case for the two Contraction regimes.
This whole Indicator, as well as the second part, is based to a majority on 42MACRO's models.
I only brought them into TV and added things on top of it.
If you have questions or need a more in-depth guide DM me.
Will make a guide to all functionalities if necessity becomes apparent.
GM

Color Changing MACDJapanese below / 日本語説明は下記
This indicator shows MACD with its colors changing based on trend strength.
The purpose of this indicator is to visually understand phases of trends, which are beginning, advancing and ending, measuring the range between MACD line and signal line.
Since MACD is originated from moving average, the range between MACD line and signal line gradually expands as trends progress while the range gets narrowed as trends come closer to the end. The indicator visualizes this characteristics.
The colors change as follows:
Green: In bullish trend, the range between MACD and signal gets expanded from previous candle, which indicates up trends continue
Purple: The range between MACD and signal gets narrowed from previous candle, which indicates trends gradually come to end.
Red: In bearish trend, the range between MACD and signal gets expanded from previous candle, which indicates down trends continue
See the chart below.
Features
Coloring
MACD line and signal line's colors change according to the logic above.
You can also fill the gap between MACD line and signal line with the same color changing logic as lines.
Signals
Golden cross and death cross signals can be displayed.
Alert
Alerts can be set when golden and death crosses occur.
---------------------
トレンドの強弱で色が変わるMACDのインジケーターです。トレンドが初期、進展期、終了期と移り変わる様子を視覚的に判断できることを目的に開発しています。
トレンドの強弱はMACDラインとシグナルラインの幅で判断します。
MACDは移動平均線を元にしたインジケーターであるため、トレンドが進展するにつれMACDラインとシグナルラインの幅は徐々に広がります。一方で、トレンドが終盤に差し掛かかるにつれ上記の幅は狭まります。インジケーターはこのMACDの特徴を色で可視化します。
色は以下の通り変化します。
緑:上昇トレンドにおいて、MACDラインとシグナルラインの幅が前のローソク足のそれよりも拡大している場合
=>トレンドの勢いが強まっていることを示唆
紫:MACDラインとシグナルラインの幅が前のローソク足のそれよりも縮小している場合
=>トレンドの勢いが弱まっていることを示唆
赤:下降トレンドにおいて、MACDラインとシグナルラインの幅が前のローソク足のそれよりも拡大している場合
=>トレンドの勢いが強まっていることを示唆
サンプルチャート
機能
色変更
上記のロジックでMACDとシグナルラインの色を変更します。また両ラインの間をラインと同じロジックで塗りつぶすことも可能です。
シグナル
ゴールデンクロスとデッドクロスでシグナルを表示
アラート
ゴールデンクロスとデッドクロスでアラートを設定可能

Correlation Coefficient - DXY & XAUPublishing my first indicator on TradingView. Essentially a modification of the Correlation Coefficient indicator, that displays a 2 ticker symbols' correlation coefficient vs, the chart presently loaded.. You can modify the symbols, but the default uses DXY and XAU, which have been displaying strong negative correlation.
As with the built-in CC (Correlation Coefficient) indicator, readings are taken the same way:
Positive Correlation = anything above 0 | stronger as it moves up towards 1 | weaker as it moves back down towards 0
Negative Correlation = anything below 0 | stronger moving down towards -1 | weaker moving back up towards 0
This is primarily created to work with the Bitcoin weekly chart, for comparing DXY and Gold (XAU) price correlations (in advance, when possible). If you change the chart timeframe to something other than weekly, consider playing with the Length input, which is set to 35 by default where I think it best represents correlations with Bitcoin's weekly timeframe for DXY and Gold.
The intention is that you might be able to determine future direction of Bitcoin based on positive or negative correlations of Gold and/or the US Dollar Index. DXY has been making peaks and valleys prior to Bitcoin since after March 2020 black swan event, where it peaked just after instead. In the future, it may flip over again and Bitcoin may hit major highs or lows prior to DXY, again. So, keep an eye on the charts for all 3, as well as the indicator correlations.
Currently, we've moved back into negative correlation between Bitcoin and DXY, and positive correlation with Bitcoin and Gold:
Negative Correlation b/w Bitcoin and DXY - if DXY moves up, Bitcoin likely moves down, or if DXY moves down, Bitcoin likely moves up (or if Bitcoin were to move first before DXY, as it did on March 2020, instead)
Positive Correlation b/w Bitcoin and Gold - Bitcoin and Gold will likely move up or down with each other.
DXY is represented by the green histogram and label, Gold is represented by the yellow histogram and label. Again, you can modify the tickers you want to check against, and you can modify the colors for their histograms / labels.
The inspiration from came from noticing areas of same date or delayed negative correlation between Bitcoin and DXY, here is one of my most recent posts about that:
Please let me know if you have any questions, or would like to see updates to the indicator to make it easier to use or add more useful features to it.
I hope this becomes useful to you in some way. Thank you for your support!
Cheers,
dudebruhwhoa :)

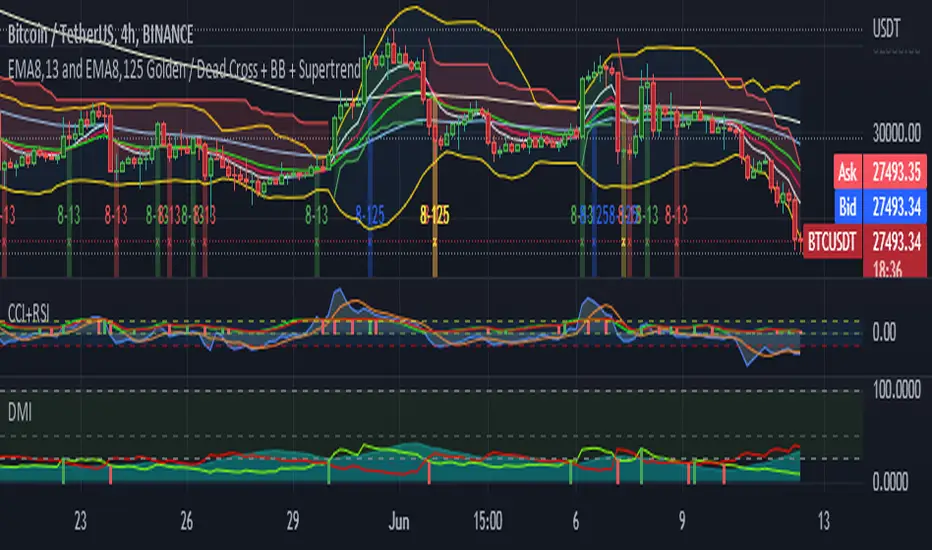
5EMA(8,13,21,55,125) w/ EMA8-13 + EMA8-125 GC/DC Signal-by TerryThis Script are Combined 5 EMAs Indicator with Golden / Death Cross EMA 8 -13 and EMA 8 - 125 within Green or Red Column Line as Default Signal. This Indicator also combined with Ballinger Band and Super Trend Channel.
If you have like this Indicator, please add to your favorite Indicator, and If You Don't, Don't be like a man without woman :) ... God Bless You All
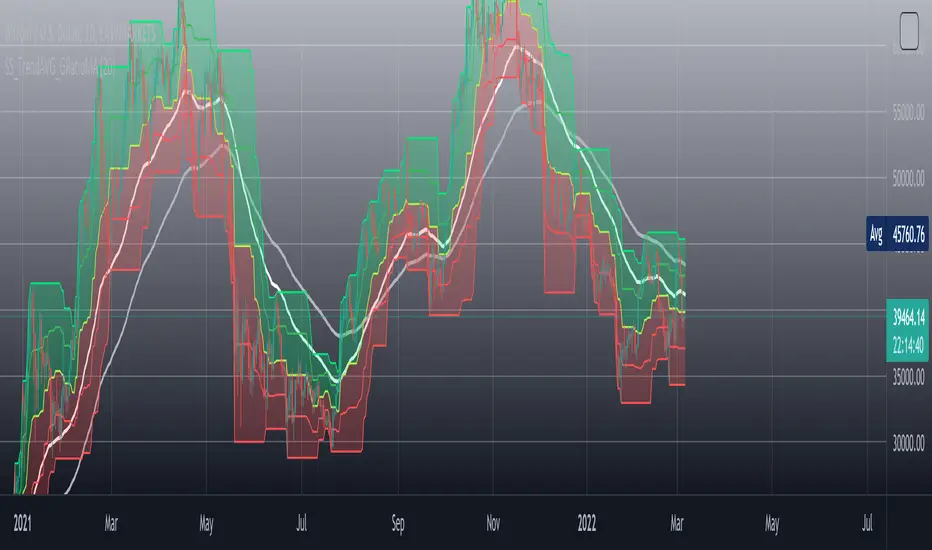
[SS]_TrendAVGZones_and_GoldenRatioMAThe _TrendAVGZones_and_GoldenRatioMA is an indicator that is composed first of a channel made of three price averages ( base average, middle lower and middle upper ) in red is the previous corrections average and in green the previous rises average. So that way we the setting of stop loss targets and price targets can be set up at first glance. It adjusts to any timeframe so no worries 'bout that.
Also I added two exponential moving averages ( white and silver lines ) on the chart which I modified their equations by multiplying as it follows :
is the simple modification I added to fine tune it's precision and after some trials and errors I finally found a perfect spot. Now I tried it with historical data of Bitcoin and when the two Golden Ratio EMA crosses there's a big move coming imminently : if the white one is on top of the silver one the trend is bullish inversely the white one finds itself under the silver line then it needs to cross to expect a reversal.
rphi = 0.6180339887498948 = is the conjugate root of the golden ratio also called the silver ratio
phi = 1.6180339887498948 = golden ratio
It should be used to find short to mid term price targets selling as well as buying ones. If you're a long term trader I suggest using trend lines analysis in combination with it.
I hope to make this indicator a community owned indicator so don't hesitate to perfect it so we can build the best tool traders can hope for ! Together we will no longer ask wen lambo? we will get it!
IF you've got any question you can always DM me
take care of yourselves you future millionaires :D
-SS
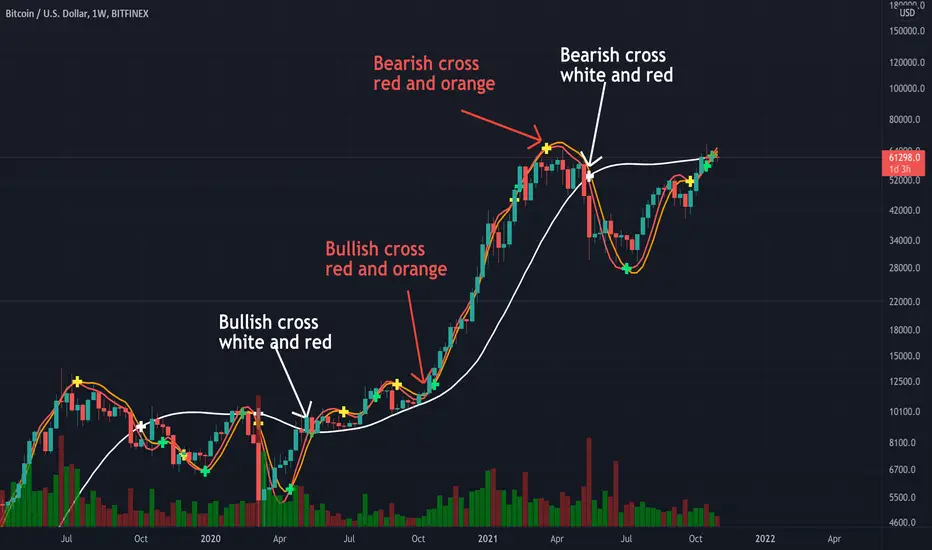
Triple Modified Hull Moving Average Cross By <Zakaria>Triple Modified Hull Moving Average Cross By
What is this?
this is a modified formula for Hull moving average, it is more accurate and predicts the golden and death cross earlier.
How to use?
Work better in high time frames (1D,1W)
the white line vs the red and the orange lines :
1 - when the white line crosses the red and the orange lines from the bottom the price will go down . Death cross!
2 - when the white line crosses the red and the orange lines from the top the price will go up . Golden Cross!
the red line vs the orange line :
1- when the orange line crosses the red line from the bottom the price will go down . Death cross!
2 - when the orange line crosses the red line from the top the price will go up . Golden Cross!
p.s: the lag between these two lines will be very small. use it in the 1W time frame to predict where exactly the bull market will end.
You can input your personalized values if you want!
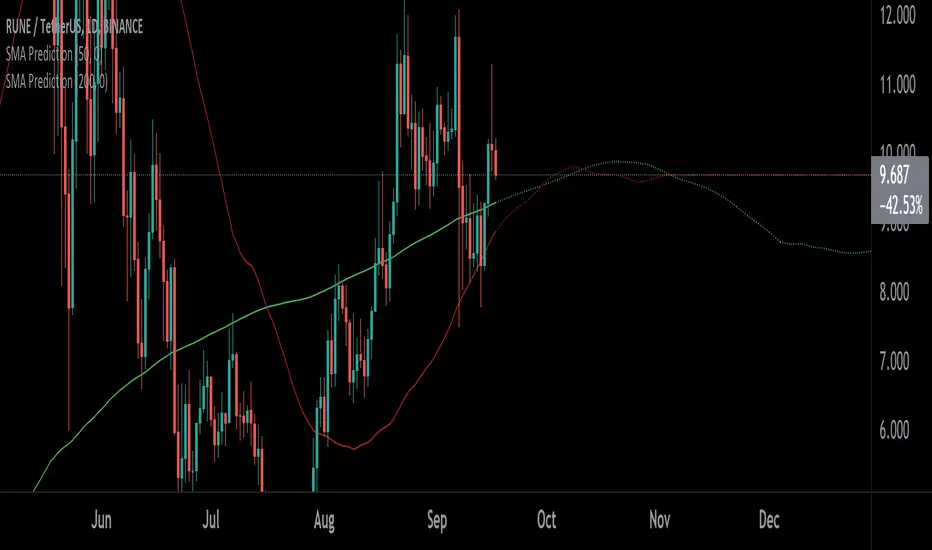
SMA PredictionThis indicator predicts future moving average (SMA) values assuming the prices remains at configured level (-50% to +50%).
It can be used to predict golden/death crosses as well - when two of these indicators are on - one configured for length 50 and one for length 200.
Crypto EMA+MA+MACS by hobbeLeThis is an indicator that includes several EMAs and MAs (Used in Cryptotrading).
In addition, the Golden and Death Cross are also displayed.
Used MAs
MA 7 - Orange Line
MA 21 - Yellow Line
MA 25 - Grey Line
MA 99 - Blue Line
MA 200 - Green Line
Used EMAs
EMA 200 - Grey Dotted Line
EMA 222 - Pink Dotted Line
Golden Cross
Crossover MA25 + MA200
Death Cross
Crossunder MA25 + MA200
What is a Moving Average (MA) ?
A moving average (MA) is a widely used indicator in technical analysis that helps smooth out price action by filtering out the “noise” from random short-term price fluctuations.
Moving average is a trend-following, or lagging, indicator because it is based on past prices. The most common applications of moving averages are:
to identify the trend direction
to determine support and resistance levels
The two basic and commonly used moving averages are the simple moving average ( SMA ), which is the arithmetic average of a security over a defined number of time periods, and the exponential moving average ( EMA ), which gives greater weight to more recent prices.
What is a Golden Cross?
The golden cross is a candlestick pattern that is a bullish signal in which a relatively short-term moving average crosses above a long-term moving average. The golden cross is a bullish breakout pattern formed from a crossover involving a security's short-term moving average (such as the 15-day moving average) breaking above its long-term moving average (such as the 50-day moving average) or resistance level. As long-term indicators carry more weight, the golden cross indicates a bull market on the horizon and is reinforced by high trading volumes.
What Is a Death Cross?
The death cross is a technical chart pattern indicating the potential for a major selloff. The death cross appears on a chart when a stock’s short-term moving average crosses below its long-term moving average.
Source; Investopedia

Ultimate Moving Averages (SMA & EMA)Welcome to the Ultimate Moving Average indicator.
Never again spend time looking for EMA / SMA indicators when you can have them all in this single indicator.
Options include :
Daily Chart: Classic Golden / Death Cross - 50/D and 200/D SMA
Daily Chart: 3-day Golden / Death Cross - 150/D and 600/D SMA
Daily Chart: 140/D SMA
Daily Chart: 700/D SMA
Daily Chart: 1458/D SMA
Daily Chart: Golden Ratio Multiplier
Any Chart: Scalping
9 SMA
10 SMA
20 SMA
21 SMA
30 SMA
34 SMA
50 SMA
80 SMA
100 SMA
200 SMA
8 EMA
10 EMA
13 EMA
20 EMA
21 EMA
26 EMA
30 EMA
34 EMA
50 EMA
55 EMA
80 EMA
89 EMA
100 EMA
200 EMA

Rhaps SMAEMA Combo v1.1There's many versions of this sort of thing around the Tradingview library, but i guess we all like things to our own specifications.
So this is my take on the SMA and EMA version combined.
Bunch of SMA's & EMA's, with labels, and G&D Cross Labels and Alerts.
These values can of course be changed to any you may prefer.
Rhapsodyy's Combo SMAEMA's v1.1
SMA's with Painted Labels : 10/30/50/80/200
EMA's with Painted Labels : 21/50/89/200/377
50SMA / 200SMA Golden & Death Crosses on Current Timeframe & Alerts
Daily 50SMA / 200SMA Golden & Death Crosses overlayed onto Current Timeframe & Alerts
50EMA / 200EMA Golden & Death Crosses on Current Timeframe & Alerts
Daily 50EMA / 200EMA Golden & Death Crosses overlayed onto Current Timeframe & Alerts

S&D Golden Zone: Multi-Strength Trigger & HTF FilterDescription:
This script is a comprehensive Supply & Demand (S&D) trading tool designed to identify high-probability reversal zones and confirm them with multi-strength price action triggers.
Unlike standard SMC indicators, this "Clean Edition" focuses on "Golden Zones"—where Order Blocks (OB) align with key Fibonacci retracement levels (50% - 61.8%).
Key Features:
Golden Zone Detection: Automatically filters and highlights Order Blocks that overlap with the 0.5 - 0.618 Fibonacci Golden Pocket.
Trigger Strength System: Uses specific price action patterns to signal entries with different confidence levels:
◆ Diamond (Strong): Inside Bar False Breakout (IBFB) – High-conviction reversal.
▲ Triangle (Medium): Pin Bar or Engulfing patterns.
● Circle (Weak): Doji with directional follow-through.
HTF Trend Filter: Ensure your entries are aligned with Higher Timeframe (e.g., 4H or Daily) trends.
Smart Zone Management: Option to hide "Mitigated" (already tested) zones to keep your chart clean.
Risk Dashboard: Real-time info table showing Trend alignment, Zone status, and Opposing Zone warnings.
How to Use:
Wait for price to enter a Golden Zone (Demand in green, Supply in red).
Look for the Trigger Shape to appear. Diamond (◆) signals are the most reliable.
Check the HTF Filter on the dashboard to ensure you are trading with the major trend.
----
이 스크립트는 높은 확률의 반전 구간을 식별하고, 가격 액션(Price Action) 트리거를 통해 진입 신호를 세분화하여 제공하는 공급 및 수요(S&D) 분석 도구입니다.
핵심 차별점:
골든존(Golden Zone) 판정: 모든 오더블록을 표시하지 않고, 피보나치 0.5~0.618 구간과 겹치는 '신뢰도 높은' 구역을 골든존으로 자동 분류합니다.
트리거 강도 시스템 (Shape 구분): 단순히 구역에 닿았다고 신호를 주지 않고, 내부에서 발생하는 캔들 패턴에 따라 강도를 구분합니다.
◆ 다이아몬드 (강): 인사이드 바 트랩(IBFB) - 가장 강력한 반전 신호.
▲ 삼각형 (중): 핀바 또는 장대장악형 패턴.
● 원형 (약): 도지 캔들 이후 방향성 확인.
상위 타임프레임(HTF) 필터: 현재 차트보다 상위 시간대의 추세를 실시간으로 체크하여 역추세 매매의 위험을 줄입니다.
대시보드 제공: 현재의 추세 일치 여부, 반대편 구역 존재 여부(리스크 관리) 등을 한눈에 확인할 수 있습니다.

EduVest - IFA-VP Context v3.0 [NEON Edition]📊 IFA-VP Context v3.0
A powerful market context indicator combining Volume Profile analysis with SMA trend detection. Designed with a cyberpunk-inspired NEON color palette for maximum visibility on dark charts.
━━━━━━━━━━━━━━━━━━━━━━━━━━━━━━
🎯 WHAT IT DOES
This indicator helps you understand "where you are" in the market by analyzing:
• Volume Profile (POC, VAH, VAL)
• SMA Alignment (20/50/200)
• Context Score (0-100)
━━━━━━━━━━━━━━━━━━━━━━━━━━━━━━
⚡ KEY FEATURES
🔹 NEON Color Palette - Cyan/Pink/Gold colors optimized for dark mode
🔹 Context Score - Visual score bar (████████░░) shows market strength
🔹 Cross Signals - GOLDEN CROSS / DEATH CROSS with HUGE labels
🔹 POC Reaction - Track price interaction with Point of Control
🔹 Status Panel - All-in-one dashboard with trend, zone, and hints
━━━━━━━━━━━━━━━━━━━━━━━━━━━━━━
📺 THREE DISPLAY MODES
• Impact Mode - Full visual experience with badges, ribbons, and glow effects
• Minimal Mode - Clean SMA lines and VP levels only
• Pro Mode - Complete VP histogram display
━━━━━━━━━━━━━━━━━━━━━━━━━━━━━━
📈 SIGNALS EXPLAINED
▲ GOLDEN CROSS (20×50) - Short-term bullish momentum
▼ DEATH CROSS (20×50) - Short-term bearish momentum
⭐ MAJOR GOLDEN (50×200) - Long-term bull market signal
💥 MAJOR DEATH (50×200) - Long-term bear market signal
Context Badges:
⚡ SUPER BUY/SELL (Score 80+)
🔥 POWER BUY/SELL (Score 70-79)
💪 STRONG BUY/SELL (Score 60-69)
⏸ WAIT (Score <50)
━━━━━━━━━━━━━━━━━━━━━━━━━━━━━━
⏰ RECOMMENDED TIMEFRAMES
✅ 15min - 4H (Best for day trading & swing)
⚠️ 1min-5min (Noisy, use with caution)
━━━━━━━━━━━━━━━━━━━━━━━━━━━━━━
⚠️ DISCLAIMER
This is NOT a buy/sell signal indicator.
It shows market CONTEXT to help your own trading decisions.
Always use proper risk management and combine with your own analysis.
━━━━━━━━━━━━━━━━━━━━━━━━━━━━━━
🏷️ Tags: volume profile, sma, context, trend, neon, dark mode, poc, value area

TQ Gold Trend (Macro Regime)This indicator answers one question only:
Is gold in a monetary uptrend right now?
It does not:
Forecast prices
Time entries
Use momentum or volatility
It simply classifies the macro trend regime of gold.
3️⃣ Logic (Simple, Explicit)
Timeframe: Weekly
Indicator: 30-week Simple Moving Average
Interpretation:
Bullish: Price above a rising 30W SMA
Bearish: Price below a falling 30W SMA
Neutral: Everything else (transition / range)
This is classic macro trend / stage analysis, adapted for gold as a monetary asset.
4️⃣ How to Use It (User Instructions)
How to read the chart
>If Gold is Bull, precious metals matter.
>If Gold is Bear, ignore silver and miners.
>If Gold is Neutral, wait — no edge.
Best use
Check once per week
Use as the first filter before looking at:
Gold/DXY
Gold/SPY
Silver/Gold
Recommended timeframe
Weekly only (designed for macro regimes, not trading)

EDUVEST QQE Grade System - S/A/B/C Signal ClassificationEDUVEST QQE Grade System - S/A/B/C Signal Classification
━━━━━━━━━━━━━━━━━━━━━━━━━━━━━━━━━━━━━━━━━━━━━━━━
█ ORIGINALITY
This indicator introduces a unique grading system (S/A/B/C) for QQE signals, combining traditional QQE analysis with SMC (Smart Money Concepts) price zones and trading session filters. Unlike standard QQE indicators that show all signals equally, this version classifies signals by quality to help traders focus on the highest probability setups.
━━━━━━━━━━━━━━━━━━━━━━━━━━━━━━━━━━━━━━━━━━━━━━━━
█ WHAT IT DOES
- Generates BUY/SELL signals with S/A/B/C grade classification
- Automatically detects asset type and applies optimized QQE factors
- Integrates SMC price zones (support/resistance) for grade enhancement
- Filters signals by trading session time
- Displays real-time session and market status
Grade Hierarchy:
- S (Gold/Orange): Signal near SMC zone + active trading hours - Highest quality
- A (Green/Red): Score 70+ during trading hours - High quality
- B (Darker): Score 50-69 during trading hours - Medium quality
- C (Gray, small): Outside trading hours or weak signal - Low quality
━━━━━━━━━━━━━━━━━━━━━━━━━━━━━━━━━━━━━━━━━━━━━━━━
█ HOW IT WORKS
【QQE Core Calculation】
The QQE (Quantitative Qualitative Estimation) is calculated as:
1. RSI with configurable period (default: 14)
2. EMA smoothing of RSI (Smoothing Factor: 5)
3. Dynamic bands using Wilder's smoothing: RSI ± (ATR of RSI × QQE Factor)
QQE Factor is auto-adjusted per asset:
- USD/JPY: 4.238
- EUR/USD: 3.8
- Gold (XAU/USD): 8.0
- NASDAQ/US100: 9.0
【Signal Generation】
- BUY: QQE line crosses above its trailing stop (QQExlong == 1)
- SELL: QQE line crosses below its trailing stop (QQExshort == 1)
【Internal Scoring System】
Score components (0-100):
- Signal Base: +25 points when signal occurs
- QQE Strength: +10 to +20 based on RSI distance from 50
- Volatility: +15 (optimal ATR ratio 1.1-2.0), -10 (low volatility)
- Volume Confirmation: +10 (high volume), -5 (low volume)
- Session Bonus: +5 during London/NY sessions
- Base: +20 points
【Grade Assignment】
- Grade S: Signal near user-defined SMC price zone (within tolerance %) AND during trading hours
- Grade A: Internal score >= 70 AND during trading hours
- Grade B: Internal score >= 50 AND during trading hours
- Grade C: Outside trading hours OR score < 50
【SMC Price Zone Integration】
Users can set support/resistance levels for each asset. When price is within the tolerance percentage of these levels, signals are upgraded to S-grade, indicating confluence with institutional price levels.
【Trading Session Filter】
Configurable active trading hours (JST timezone):
- Default: 15:00 - 01:00 JST (London + NY overlap)
- Signals outside this window receive C-grade
━━━━━━━━━━━━━━━━━━━━━━━━━━━━━━━━━━━━━━━━━━━━━━━━
█ HOW TO USE
【Recommended Settings】
- Timeframe: 15M, 1H, 4H
- Best on: USD/JPY, EUR/USD, Gold, NASDAQ
- Focus on: S and A grade signals
【Trading Strategy】
- S-Grade (Gold/Orange): Highest conviction - consider larger position
- A-Grade (Green/Red): Strong signal - standard position
- B-Grade: Valid but use additional confirmation
- C-Grade: Avoid or use minimal size
【Setting Up SMC Zones】
1. Identify key support/resistance on higher timeframe
2. Input prices in SMC Price Settings
3. Adjust tolerance % (default: 0.15%)
4. S-grade appears when signal occurs near these levels
【Info Panel】
Top-right panel shows:
- Asset name and detection mode (Auto/Manual)
- Current session (Tokyo/London/NY)
- Trading hours status
- SMC zone proximity
【Alert Setup】
1. Enable alerts in settings
2. Create alert with "Any alert() function call"
3. Alerts include grade, price, and session info
━━━━━━━━━━━━━━━━━━━━━━━━━━━━━━━━━━━━━━━━━━━━━━━━
█ SETTINGS
Basic Settings:
- Enable Alerts: Turn on/off notifications
- Time Filter: Activate trading hour filter
- Start/End Hour: Define active trading window (JST)
QQE Settings:
- RSI Period: RSI calculation period
- RSI Smoothing: EMA smoothing factor
- Auto QQE Factor: Auto-detect optimal factor per asset
- Manual QQE Factor: Override when auto is disabled
SMC Price Settings:
- Support/Resistance levels for each asset
- Tolerance %: How close to SMC line for S-grade
Display Settings:
- Grade Only: Hide QQE lines, show only signals
- Show SMC Lines: Display support/resistance on chart
- Show Debug: Display asset detection info
━━━━━━━━━━━━━━━━━━━━━━━━━━━━━━━━━━━━━━━━━━━━━━━━
█ CREDITS
QQE concept originally developed by John Ehlers.
SMC (Smart Money Concepts) integration and grading system by EduVest.
License: Mozilla Public License 2.0

ICT Liquidity + BOS + FVG + Entries (NY)ICT Liquidity + BOS + FVG + Entries (NY Session)
This indicator is designed for ICT / Smart Money Concepts traders, focusing on high-probability New York session setups, especially for Gold (XAUUSD) on lower timeframes like M5.
It automates the classic ICT execution model:
Liquidity → Break of Structure → Fair Value Gap → Entry

Supertrend BUY Only - Optimized for Gold M15 TimeframeOverview
The Supertrend BUY Only - Production Optimized is a high-performance trend-following indicator specifically tuned for XAUUSD (Gold) on the 15-minute timeframe. Unlike standard Supertrend scripts, this version focuses exclusively on bullish cycles to align with long-term upward bias and uses parameters discovered through deep data analysis of over 20,000 bars of historical market data.
Key Features
Data-Optimized Parameters: Defaults are set to ATR Period 7 and Multiplier 2.1, which backtesting has shown to provide a superior balance between sensitivity and noise reduction for Gold.
Production-Ready Alerts: Includes built-in alertcondition triggers for both BUY (Trend Flip) and STOP BUY (Trend Exit), complete with dynamic messages that include price and interval.
Trailing Support Band: Uses a trailing logic that locks in support levels during upward moves, preventing the band from dropping until the trend officially reverses.
Clean Visuals: Focuses on chart clarity by only plotting the support line during active uptrends and utilizing clean shape labels for entries and exits.
How to Use
Entry (BUY): When the Supertrend line flips from Red to Green and a "BUY" label appears. This indicates bullish momentum has overcome recent volatility.
Exit (STOP BUY): When the price closes below the Green support line. The indicator will plot a red "X" and clear the green background.
Setting Alerts: * Click the Alerts icon in TradingView.
Select this indicator under "Condition."
Choose "BUY Signal" for entries and "STOP BUY / EXIT" for managing your trade or taking profit.
Technical Details
The script allows users to toggle between the TradingView (RMA) ATR calculation and the Standard (SMA) method. For production and live trading, the RMA method is recommended as it provides a smoother response to volatility spikes common in the Gold market.

Price vs Moving Average Cross (Golden & Death Signals)This indicator detects price crossings against multiple moving averages, not crossings between moving averages themselves.
🔹 Core Concept
A Golden Signal occurs when the price (close) crosses above a selected moving average.
A Death Signal occurs when the price (close) crosses below a selected moving average.
⚠️ This is NOT a moving-average-to-moving-average crossover indicator.
It is a price-to-moving-average crossover indicator.
📈 Moving Average Settings
The indicator uses three independent moving averages, each configurable by the user:
1️⃣ Moving Average 1 (Golden Signal)
Default: 20-period
Type: EMA or SMA
Signal:
Price crossing above MA → Golden Signal
2️⃣ Moving Average 2 (Golden Signal)
Default: 50-period
Type: EMA or SMA
Signal:
Price crossing above MA → Golden Signal
3️⃣ Moving Average 3 (Death Signal)
Default: 100-period
Type: EMA or SMA
Signal:
Price crossing below MA → Death Signal
🔔 Signal Logic
Signal Type Condition
Golden Cross 1 Close price crosses above MA 1
Golden Cross 2 Close price crosses above MA 2
Death Cross Close price crosses below MA 3
Each signal is evaluated independently.
📊 Visual Representation
Green Up Arrow → Price crosses above MA 1
Purple Up Arrow → Price crosses above MA 2
Red Down Arrow → Price crosses below MA 3
All moving averages are plotted directly on the price chart.
🎯 Practical Use Cases
Identifying trend initiation points
Confirming pullback breakouts
Acting as an entry timing assistant
Using MA 3 as a trend filter / exit warning
⚠️ Important Notes
This indicator may generate false signals in sideways or ranging markets.
Best used in combination with:
Higher-timeframe trend confirmation
Volume indicators
Support & resistance levels
🧠 Summary
✔️ Price ↔ Moving Average crossover
❌ Moving Average ↔ Moving Average crossover
This indicator is designed for trend-following traders who want clear and simple price confirmation signals.
원하시면
“True MA Golden Cross version”
Scalping-optimized version (3m / 5m)
Trend + Momentum filtered version

GMMA fill (v5) + Golden Crossover HighlightsGMMA Fill (v5) + Golden Crossover Highlights
This setup combines the Guppy Multiple Moving Average (GMMA) Fill version 5 with Golden Crossover signals to identify strong trend continuation and potential breakout points. GMMA provides layered moving averages for short- and long-term trend analysis, while the Golden Crossover highlights bullish momentum shifts, making it ideal for spotting entry opportunities in trending markets.

🟡 GOLD 4H HUD v12 — Time-Safe Nuclear Edition🟡 GOLD 4H HUD v12 — Time-Safe Nuclear Edition
A full–scale Smart Money Concepts (SMC) analytics engine designed exclusively for XAUUSD on the 4-Hour timeframe.
This script combines market structure, liquidity, displacement, order blocks, imbalance, volume profile, SMT divergence, and institutional behavior modeling into a single unified HUD.
Built with a time-safe architecture, all structural elements (OB/FVG/Sweep) are stored by timestamp to minimize repainting and preserve event integrity.
📌 Core Features (12 Modules + Full HUD)
1 — Market Structure Engine
Automatically detects:
HH / HL / LH / LL
BOS (Break of Structure)
MSS (Market Structure Shift)
CHOCH (Change of Character)
Real swing pivots & trend state
2 — Sweep Engine (Liquidity Grab Detection)
Identifies institutional liquidity grabs:
Break + reclaim of highs/lows
ATR-filtered invalidation
Displacement-backed sweeps
3 — Time-Safe FVG Engine
Detects Bullish/Bearish Fair Value Gaps
ATR-tolerant FVG logic
Automatic right-extension
Auto-delete when filled or invalid
4 — Time-Safe Order Block Engine
Demand & Supply OB detection
Strength classification (Weak vs Strong)
FVG-overlap confirmation
Timestamp-locked (non-repainting)
5 — Volume Profile Engine (HVN / LVN / POC)
Real-time micro-profile:
High Volume Node (HVN)
Low Volume Node (LVN)
Point of Control (POC)
6 — SMT Engine (Gold vs DXY Divergence)
Smart Money Divergence built-in:
Bullish SMT
Bearish SMT
Directional confirmation with zero lag
7 — Displacement Engine
Measures institutional impulse:
Body-based impulse detection
Multi-leg continuation signals
FVG continuation moves
Generates displacement score
8 — Premium / Discount Model
Auto-classifies price into:
Discount (Buy zone)
Premium (Sell zone)
9 — SMC Trend Engine (Score-Based)
Combines 10+ factors:
Structure
FVG
OB power
Displacement
POC positioning
SMT conditions
Outputs:
BULL / BEAR / RANGE
Full scoring system
10 — Institutional Imbalance Model (IMB Engine)
Combines:
PD zones
Sweep direction
Displacement
SMT
OB strength
CHOCH/MSS
A complete institutional bias filter.
11 — Entry Engine (Signal Fusion Model)
Entry conditions fuse:
Sweep
CHOCH
Displacement
OB strength
FVG alignment
SMT confirmation
Also outputs:
Suggested SL/TP
Entry score
12 — Trendline Engine
Auto-draws:
HL → HL bullish trendlines
LH → LH bearish trendlines
+ Full Nuclear HUD
Displays:
Market structure
Trend direction
SMT / CHOCH / MSS
FVG / OB zones
HVN / LVN / POC
Liquidity strength
Entry model
Liquidity Magnet direction
SL/TP map
A complete institutional dashboard in one place.
⚠ Usage Requirement
This script is designed ONLY for the 4H timeframe.
✨ Summary
GOLD 4H HUD v12 — Time-Safe Nuclear Edition
is not just an indicator.
It is a full institutional-grade SMC analysis system, built specifically for Gold.
If you trade XAUUSD on the 4H timeframe —
this is your complete market intelligence HUD

RSI Golden & Dead Cross AlertRSI 14 Golden And Dead Cross Indicator
It will give you an alert when there are rsi golden and dead cross.
It is a intergated signal: Crossing up and Crossing down of RSI.
