Поиск скриптов по запросу "GOLD"
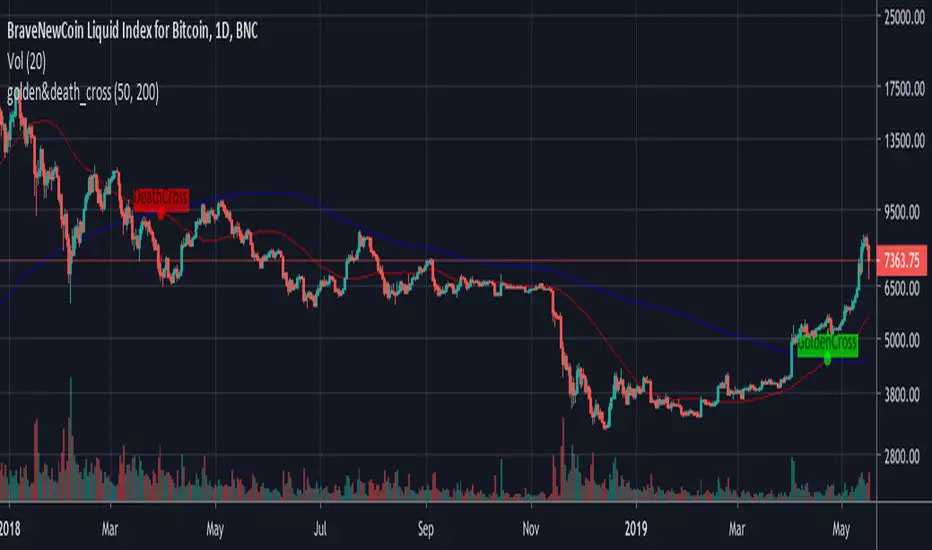
GoldenCross & DeathCrossBNC:BLX
Its a simple Golden- and Death-Cross Indicator BNC:BLX
... it highlights the Crosses and labels them. It also highlights the bar where the cross happend.
Enjoy and buy me a coffee if you liked it.
ETH: 0x4F27c7eC42b898E0B79fA9a35dC9b585e4c56579
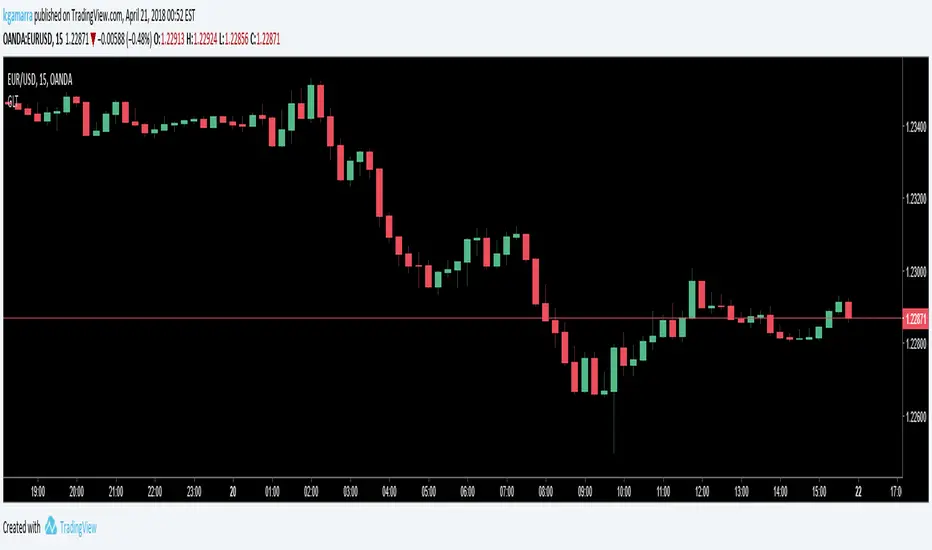
Golden Short Testing 1.1New version of Golden Short Strategy based on the golden number theory and is for long positions. It has two parameters:
1. Step to form the body of candle to generate a possible enter
2. Number of steps to form the body of the candle
Profit 1: 1:0.61 Risk/Reward Ratio -> WinRate on EURUSD: 61.41%
Values on EURUSD:
Interval: 1h
Step: 0.00022
Body: 3

Golden Long Testing 1.1New version of Golden Long Strategy based on the golden number theory and is for long positions. It has two parameters:
1. Step to form the body of candle to generate a possible enter
2. Number of steps to form the body of the candle
Profit 1: 1:0.61 Risk/Reward Ratio -> WinRate on EURUSD: 66.70%
Profit 2: 1:1.61 Risk/Reward Ratio -> WinRate on EURUSD: 48.04%
Profit 3: 1:3.23 Risk/Reward Ratio -> WinRate on EURUSD: 28.40%
Values on EURUSD:
Interval: 1h
Step: 0.00022
Body: 7

Golden Short TestingThis scripts is based on the golden number theory and is for short entries. It has three parameters:
1. Step of the body i.e: pip-0.0001, cents-0.01
2. Number of steps of the body of the candle
2. Number of contracts to put on 3 orders executed at the same time

Golden Long TestingThese scripts is based on the golden number theory and is for long entries. It has two parameters:
1. Number of pips of the body of candles to put an entry
2. Number of contracts to put on 3 orders executed at the same time
GoldenCross by PuffyThis is a simple trading strategy that seeks the Golden Cross and Death Cross on the 4HR chart. The fast moving indicator in this strategy is the EMA 50 and the slow moving indicator is the EMA 200. When the EMA 50 crosses over the EMA 200 the strategy indicates a buy. When the EMA 50 crosses below the EMA 200 the strategy indicates a sell. This strategy averages trades in the 40 - 50 day range and as such should not be used with heavy leverage.

GOLD QUANTUM MASTER🥇 GOLD QUANTUM MASTER 🥇
━━━━━━━━━━━━━━━━━━━━━━━━━━━━━━━━━━━━━━━━━━━━━━━━━━━━━━━━━━━━━━━━━
A high-performance technical analysis suite engineered for institutional-grade precision on Gold (XAUUSD) and Bitcoin (BTCUSD). This Core Edition focuses on raw analytical power without external API overhead.
🚀 KEY FEATURES:
• INSTITUTIONAL FOOTPRINT: Advanced volume-to-MA filters to identify "Big Money" participation.
• HTF REVERSAL SCANNER: Specialized logic for 30m, 1H, and 4H charts to detect Pinbar and Engulfing reversals.
• LIQUIDITY FLOW ANALYTICS: Detects and highlights Previous Day High (PDH) and Low (PDL) sweeps.
• TREND EXHAUSTION FILTERS: Built-in RSI divergence logic to prevent entries at trend peaks or bottoms.
• PREMIUM DATA LABELS: Real-time on-chart display of Signal Mode, Quality Score, and dynamic targets.
• NEON VISUAL SYSTEM: High-contrast, glassmorphic layout for maximum clarity during trading sessions.
BEST FOR: Technical Analysts, Manual Traders, and High-Performance Charting.
━━━━━━━━━━━━━━━━━━━━━━━━━━━━━━━━━━━━━━━━━━━━━━━━━━━━━━━━━━━━━━━━━
The best work on Higher time frames, I still not tested on lower time frames, but should be also precise.
Feel free to adjust the settings to your own needs.
Make your own decisions when you trade, do not put all confidence into a script, it may fail also.

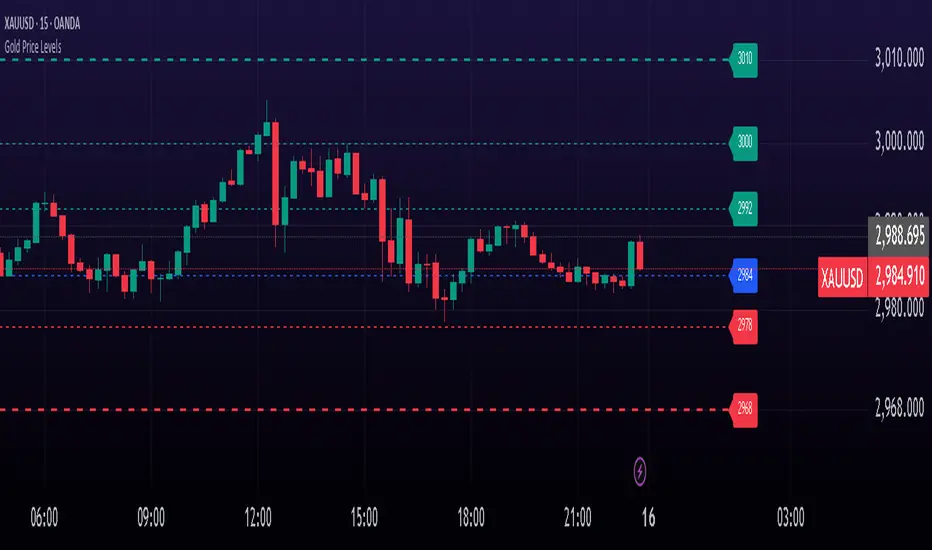
Gold Price LevelsThis indicator identifies and displays key price levels for gold trading. It highlights important psychological and technical price points that often act as support and resistance levels.
Features
Automatically identifies and displays key price levels ending in 92, 84, 78, 55, 42, 27, and 00
Special emphasis on critical levels ending in 68, 32, and 10 with increased line width
Color-coded visualization: green for levels above current price, red for levels below
Customizable line style, width, and label visibility
Automatically adjusts to different price ranges (works with any gold price)
How to Use
This indicator helps gold traders identify potential support and resistance zones. Watch for price reactions at these levels for potential trade entries, exits, or stop placement. The thicker lines (68, 32, 10) often represent more significant price levels where stronger reactions may occur.
Perfect for both day traders and swing traders looking to optimize their gold trading strategy with key price levels.
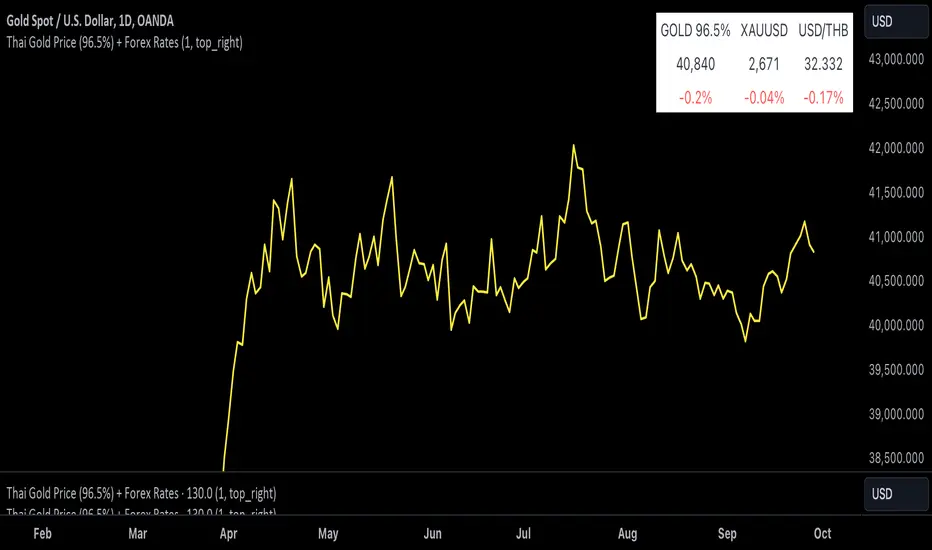
Thai Gold 96.5%Gold 96.5% Price Display (Test Version)
This Pine Script indicator is a test version designed to display the current price of Thai gold (96.5%) in a customizable table on your TradingView chart. The script calculates the gold price using the latest values for XAU/USD and USD/THB, reflecting the price of gold in Thai Baht (THB) with a purity adjustment.
Features:
- Price Calculation: Computes the Thai gold price by multiplying the XAU/USD price with USD/THB and adjusting for gold purity (0.49 * 0.965).
- Customizable Display: Adjust text size, text color, background color, and table position (Top Right, Top Left, Bottom Right, Bottom Left).
- Formatted Output: Gold price is formatted with commas for better readability.
Inputs:
- Text Size: Choose from tiny, small, normal, large, or huge.
- Text Color: Customize the text color.
- Background Color: Select a background color for the table.
- Table Position: Choose the table position on the chart.
Usage:
Add this test script to your TradingView chart to see the current Thai gold price displayed in a table format. This version is for testing purposes and may be updated based on feedback.
Feel free to test and customize the script further!
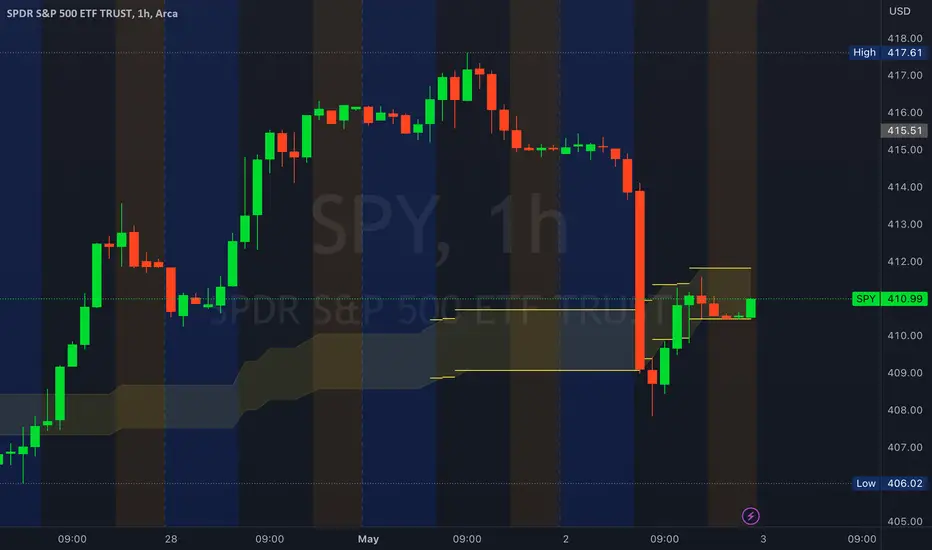
Golden ZoneIntroducing the "Golden Zone" indicator, a powerful tool that simplifies the Fibonacci indicator by creating a clear Golden Zone to identify potential future price movements. The Golden Zone is a supply or demand zone that corresponds to the 61.8% and 50% Fibonacci retracement levels. These levels are important because they often mark zones where the price reacts, making it an essential area for traders to watch.
The script plots the Fibonacci levels in the background, enabling traders to identify potential support and resistance levels quickly. The Golden Zone is highlighted with a yellow filled area, making it easy to spot on the chart. Traders use this zone to identify areas where the stock price may react, either bouncing off the support level or encountering resistance at the resistance level.
For example, if a stock price is moving up and reaches the Golden Zone, a trader may look for signs of resistance and consider selling the stock if the price begins to move back down. Conversely, if a stock price is moving down and reaches the Golden Zone, a trader may look for signs of support and consider buying the stock if the price begins to move back up.
The "Golden Zone" indicator is highly versatile and can be used in all markets, whether you are a swing trader or a day trader. It can be combined with other strategies, such as an EMA crossover strategy or price action, or as an area of confluence.
In summary, the "Golden Zone" indicator is a must-have tool for traders looking to identify potential price movements and locate key support and resistance levels. Its user-friendly inputs and clear display make it a valuable addition to any trading arsenal.
So, the "Golden Zone" indicator is like a magic tool that helps people who trade in the stock market find valuable things to buy or sell. And with its ability to identify key support and resistance levels, it can help traders make better-informed decisions when buying or selling stocks.
I hope you like it!
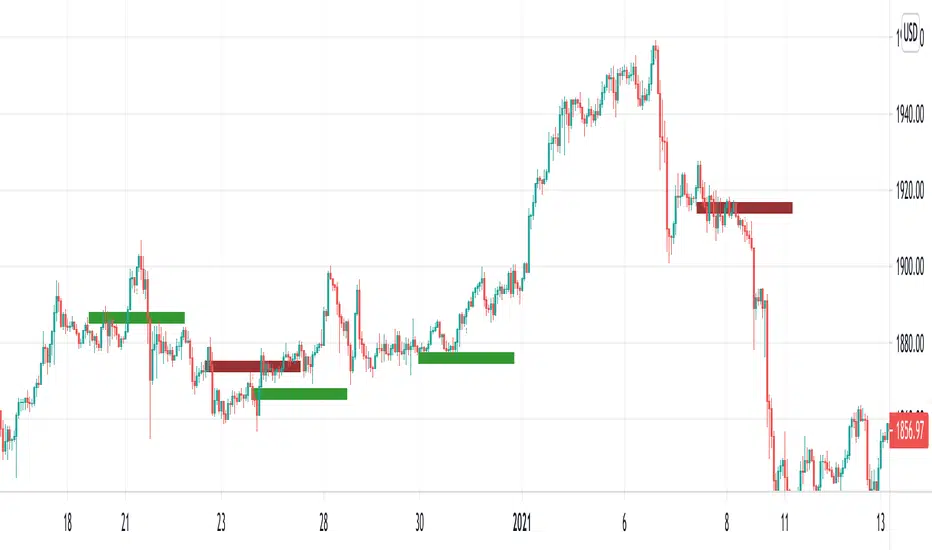
Golden PocketGolden Pocket
This marks up the fibonacci retracement levels of 0.65 and 0.618 by default, these levels are often referred to as the golden pocket.
They are known by this because when price has an impulse either to the up or downside, price will end up retracing at some point. This Golden pocket often lines up with other means of confluence where it's considered a good entry price from the retrace.
Unlike standard fib retracement indicators, these boxes will extend with current price until they are hit. As well as this, there is a moving average filter which you can set to higher timeframes meaning that you can choose to only look for golden pockets which are following the higher time frame trend. You can easily monitor all of your settings by setting up just 1 alert.
Settings
You have the option to enable/disable the line which marks out the pivot points the fib is being calculated from, you can also change the colour and style of the line.
Below this you have the option to choose what colour the fib boxes are and what colour they change to once price hits it. If you want them to disappear change the colours opacity to 0%.
If you want to change the golden pocket levels you can do that by changing the 0.618 or 0.65 levels in the settings.
The pivot distance controls what part defines a pivot high or low, it must be the highest/lowest to the left/right of the pivot candle count.
MA filter will only accept golden pockets which are trending with the Moving average.
You can change all the settings of the Moving average which acts as a filter including which timeframe it is calculated on.
Alerts
Simply toggle this on int the settings and then click on the 3 dots next to the indicators name, 'add alert', leave the top boxes as they are, you can name the alert anything you like but once you confirm this, it will monitor all golden pockets on the particular asset and timeframe you are looking at. The alerts are set up to trigger as soon as price touches one of the boxes.
Use Cases
We like setting are moving average up on the daily timeframe and using the Moving average filter so we know we are only trading with the higher timeframe trend. From there we can set up alerts on any lower timeframe.
Feel free to use any part of this script in your own code, please just give us a mention so we can check out your contributions to the community as well!
Happy to take in any suggestions or ways of improving

T3 Gold Sniper [RickAtw]Gold Sniper based on support and resistance looks for a sniper entry for trades. Used together with EMA
Key signal
Buy ------> Green Line
Sell ------> Red Line
Functional
The system was made for gold and everything is tuned for it.
I am a professional investor and I test each system for how long. If the system makes an income, it gets to my page. Use it for gold, cryptocurrencies and pairs AUD/USD GBP/USD
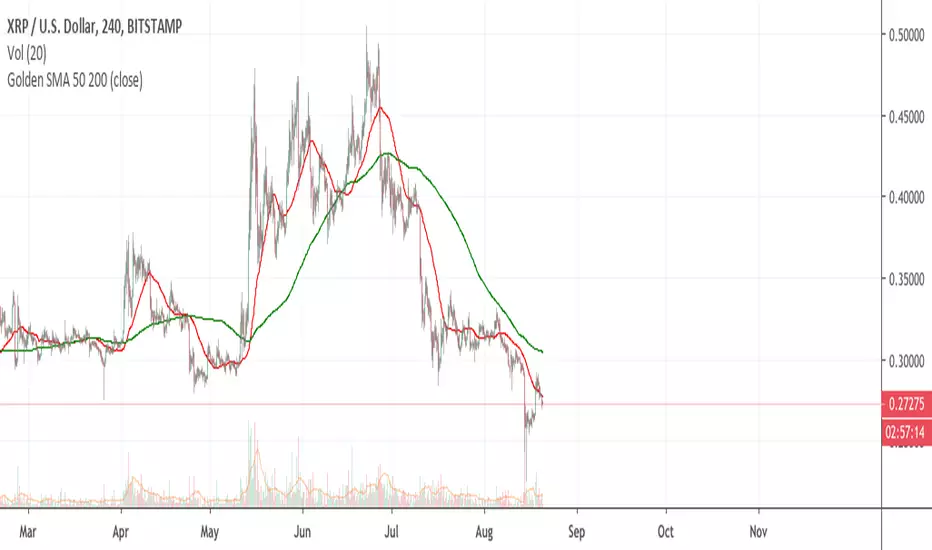
Golden Cross by -Westy-Quick Guide
- Yellow cross and green MA on top = Potential uptrend
- Yellow cross and red MA on top = Potential downtrend
A simple golden cross indicator of the green 50 and red 200 SMA with a yellow cross for ease of visibility and backtesting.
Generally, longer time frames more powerful signals but are less frequent. I typically use it on the 4 hour, daily and weekly.

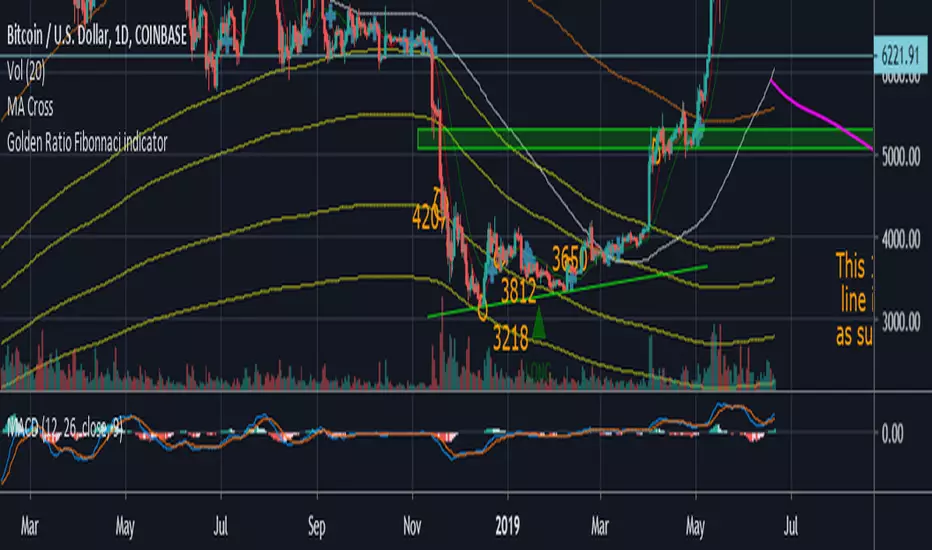
Golden Ratio Fibonacci Multipliers IndicatorBased on "The Golden Ratio Multiplier" article by Philip Swift (@PositiveCrypto) on Medium.
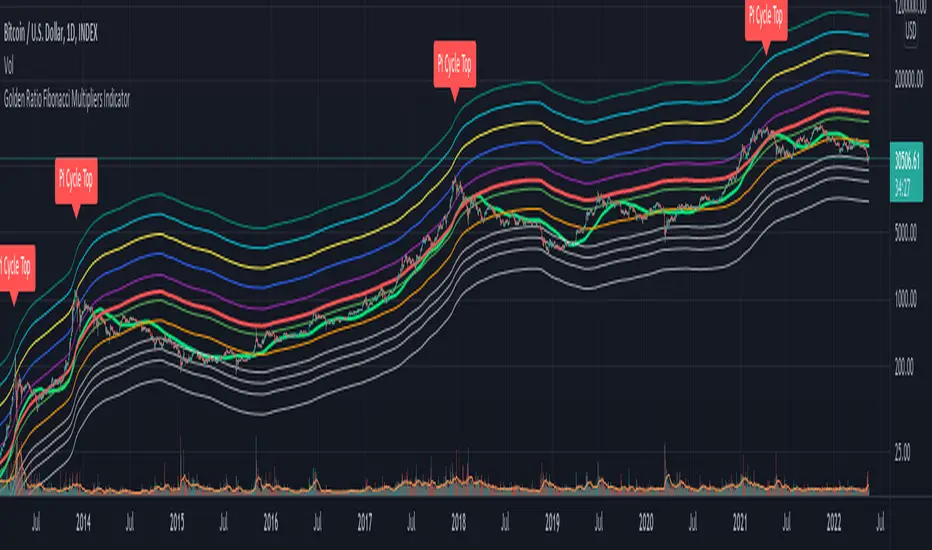
Golden Ratio Fibinnaci IndicatorI didn't see this one already it isn't my original idea either. I pulled the formula's from an article on medium, I also added few bear market bottom fib indicators.
Credit to the article I pulled the formula from.
The Golden Ratio Multiplier
Unlocking the mathematically organic nature of Bitcoin adoption
Go to the profile of Philip Swift (@PositiveCrypto)
Philip Swift (@PositiveCrypto)
Jun 17, 2019
By Philip Swift
Gold Profit Target SystemGOLD PROFIT TARGET SYSTEM
Track Real Profits, Exit With Confidence
Best on Daily or Weekly - copy and mod as you see fit. Have fun!
WHAT THIS INDICATOR DOES:
This indicator tracks your gold position from entry and shows color-coded profit targets as the price rises. Instead of guessing when to exit, you see exact profit levels in real-time: 1%, 2%, 3%, 4%, 5%, 10%, 15%, 20%, 25%, and 25%+.
Simple concept: BUY on the signal, SELL at YOUR chosen profit level.
HOW IT WORKS - 3 SIMPLE STEPS:
STEP 1: Wait for BUY Signal
• Green triangle (▲) appears below the composite line
• Triggered when inverse assets (DXY, rates, etc.) show strong correlation and are falling
• Entry price is automatically recorded
• Position tracking begins
STEP 2: Watch Profit Targets Appear
• As gold rises, color-coded symbols appear above the composite line
• Each symbol represents a profit milestone
• The info table shows your current profit
• You decide when to exit based on YOUR target
STEP 3: Exit at Your Chosen Level
• Conservative? Exit at 5-10%
• Moderate? Exit at 10-15%
• Aggressive? Hold for 20%+
• The indicator just shows the levels - YOU make the call
THE COMPOSITE LINE - WHAT IT MEANS:
The main line is a weighted composite of inverse-correlated assets:
• DXY (US Dollar Index)
• Real Interest Rates (10Y TIPS)
• US 10-Year Treasury Yield
• US 2-Year Treasury Yield
• Bitcoin (optional)
• Copper (optional)
Line Position:
• Below -30 (Bright Green): Very strong inverse correlation - excellent BUY conditions
• Below 0 (Green): Inverse correlation present - moderate BUY conditions
• Above 0 (Red): Inverse assets rising - neutral to bearish
• Above 30 (Bright Red): Strong inverse rally - bearish for gold
What Causes BUY Signals:
When the composite line is negative (inverse assets falling) AND shows strong correlation (>0.3), this suggests gold is likely to rise. The indicator records your entry and begins tracking profits.
COLOR-CODED PROFIT TARGETS:
EARLY PROFITS (Green Circles):
• 1% - Very Light Green (#c8e6c9) - First confirmation
• 2% - Light Green (#a5d6a7) - Building profit
• 3% - Green (#81c784) - Good profit
• 4% - Medium Green (#66bb6a) - Strong profit
• 5% - Dark Green (#4caf50) - Solid profit!
EXCELLENT PROFIT (Yellow Diamond):
• 10% - Yellow (#ffd54f) - Double digits, excellent trade!
OUTSTANDING PROFIT (Orange Diamonds):
• 15% - Orange (#ffb74d) - Exceptional profit, consider partial exit
EXCEPTIONAL PROFIT (Red Diamonds):
• 20% - Light Red (#ff8a65) - Rare territory, strong exit consideration
• 25% - Red (#f44336) - Extraordinary profit, very rare!
PEAK PROFIT (Purple Star):
• 25%+ - Purple (#9c27b0) - Once in a blue moon! The home run trade!
STOP LOSS (Red X):
• Default -5% - Protection against losses
• Position auto-resets if stop is hit
THE PROFIT BAR (Histogram):
Below the composite line, you'll see a colored histogram when in position:
Bar Color = Your Current Profit Tier
• Light green bar = 1-2% profit
• Green bar = 3-5% profit
• Yellow bar = 10% profit
• Orange bar = 15% profit
• Red bar = 20-25% profit
• Purple bar = 25%+ profit
• Red negative bar = Currently at a loss
Bar Height = Current Profit %
The taller the bar, the larger your profit. Negative bars extend downward when you're at a loss.
THE INFORMATION TABLE:
The table (top-right by default) shows everything at a glance:
Position: ✓ IN (green) or ✗ OUT (gray)
Shows whether you're currently holding a position
Entry Price: Your recorded buy price
Example: 2,100.50
Current Price: Gold's current price
Example: 2,142.75
Current P/L: YOUR PROFIT %
This is the most important metric - shows exactly how much you're up (or down)
Color matches your current profit tier
Example: +2.01% in light green
Profit Tier: Current milestone reached
Shows which profit level you've hit: "1%", "2%", "5%", "10%", etc.
Next Target: The next profit level to watch
Tells you what milestone is coming up next
Bars Held: How long you've been in the trade
Helps track holding time
Composite: Current correlation strength
Shows the underlying composite correlation value
REFERENCE LINES:
Zero Line (Gray):
The center line. Above = bearish for gold, Below = bullish for gold
Strong Bull Line (Green dashed at -30):
When composite crosses below -30, very strong BUY conditions
Strong Bear Line (Red dashed at +30):
When composite crosses above +30, strong bearish conditions
BACKGROUND SHADING:
Very Light Green Background:
You're in profit (position open and above entry price)
Very Light Red Background:
You're at a loss (position open and below entry price)
No Background:
No position currently open
SYMBOLS ON CHART:
▲ Green Triangle Below Line: BUY SIGNAL
Enter long position here. Entry price recorded.
● Small Green Circles Above Line: 1-5% Profits
Early profit targets. Light green to dark green progression.
◆ Diamonds Above Line: 10-25% Profits
Major profit milestones. Yellow → Orange → Red progression.
★ Purple Star Above Line: 25%+ Profit
The holy grail! Peak profit achieved.
✖ Red X Below Line: STOP LOSS HIT
Trade went against you. Position resets (if auto-reset enabled).
PROFIT-TAKING STRATEGIES:
Strategy 1: Fixed Target (Simple)
Pick one target (e.g., 10%) and always exit there.
Best for: Beginners, disciplined traders
Strategy 2: Scaled Exit (Advanced)
Exit in portions:
• 5% profit → Sell 25%
• 10% profit → Sell 25% (50% total out)
• 15% profit → Sell 25% (75% total out)
• 20%+ profit → Let final 25% ride
Best for: Risk management, maximizing upside
Strategy 3: Trailing Stop
• Hit 10%? Set stop at 5%
• Hit 15%? Set stop at 10%
• Lock in profits while letting winners run
Best for: Trend followers, bull markets
Strategy 4: Adaptive
• Strong uptrend → wait for 15-20%
• Choppy market → exit at 5-10%
• Weakening trend → exit at any profit
Best for: Experienced traders
SETTINGS YOU CAN CUSTOMIZE:
Profit Target Levels:
Change any profit % to match your strategy
• Conservative: Lower targets (0.5%, 1%, 2%, 3%, 5%)
• Aggressive: Higher targets (2%, 5%, 10%, 20%, 30%)
Assets to Include:
• Enable/disable Bitcoin
• Enable/disable Copper
• Toggle which inverse assets to track
Display Options:
• Show all targets or just current tier
• Show/hide profit bar
• Show/hide composite line
• Move table position
Stop Loss:
• Set your risk tolerance (default 5%)
• Enable/disable auto-reset on stop loss
Correlation Periods:
• Adjust for your timeframe
• Hourly: 14/30/60
• Daily: 20/50/100
• Weekly: 10/20/50
ALERTS AVAILABLE:
Set alerts for any profit milestone:
Critical Alerts:
• "BUY Signal" - Entry notification
• "5% Profit Target" - First major milestone
• "10% Profit Target" - Decision point
• "Stop Loss Hit" - Risk protection
Optional Alerts:
• 1%, 2%, 3%, 4% - Early confirmations
• 15%, 20%, 25% - Major milestones
• Individual levels for your strategy
BEST TIMEFRAMES:
Daily Chart (Recommended):
Best for swing traders holding 3-10 days
Use default settings (20/50/100 periods)
Target 5-15% profits
4-Hour Chart:
Good for active swing traders
Adjust periods to 14/30/60
Target 3-10% profits
Hourly Chart:
For day traders and scalpers
Use shorter periods (14/30/60)
Target 1-5% profits
Adjust profit levels lower (0.5%, 1%, 2%, 3%)
WHY THIS INDICATOR IS DIFFERENT:
Most indicators tell you WHEN to enter.
This one tells you WHEN TO EXIT with profit.
Most indicators use vague signals.
This one shows EXACT profit percentages.
Most indicators leave exit decisions to you.
This one gives CLEAR, COLOR-CODED milestones.
Most indicators don't track your P/L.
This one shows your profit in text you can't miss.
QUICK START GUIDE:
1. Add indicator to gold chart (XAUUSD, GLD, GC1!)
2. Wait for green triangle (▲) BUY signal
3. Watch your profit grow in the table
4. Exit when you hit YOUR target (5%, 10%, 15%, etc.)
5. Repeat
That's it. Simple. Effective. Profitable.
IMPORTANT NOTES:
• This is for LONG positions only - not for shorting gold
• Position tracking begins only after a BUY signal
• The indicator shows levels - YOU decide when to exit
• Always use stop losses (default 5% is reasonable)
• Past performance doesn't guarantee future results
• Not financial advice - use for educational purposes
PRO TIPS:
Tip 1: Don't get greedy - 10-15% is an excellent profit for most trades
Tip 2: Purple stars (25%+) are RARE - don't wait for them on every trade
Tip 3: The profit bar color change is your visual cue - green→yellow→orange→red
Tip 4: Combine with resistance levels - "10% profit + resistance = exit"
Tip 5: Set alerts for YOUR target level so you never miss it
Tip 6: The giant P/L number in the table removes emotion from decisions
EXAMPLE TRADE:
Day 1: ▲ BUY signal at $2,100
Table shows: Position ✓ IN | Entry: 2,100
Day 2: Current P/L: +1.8%
First green circle appears (1% target hit)
Table tier: "1%"
Day 4: Current P/L: +5.2%
Dark green circle appears (5% target hit)
Profit bar is dark green
Decision point: Exit 50% here?
Day 7: Current P/L: +10.5%
Yellow diamond appears (10% target hit!)
Table shows: +10.5% in yellow text
Decision point: Exit remaining 50%?
Result: Average exit ~7.5% over 7 days. Excellent swing trade!
WORKS ON:
• Gold Spot (XAUUSD)
• Gold Futures (GC1!)
• Gold ETFs (GLD, IAU)
• Any gold instrument
Inverse Assets Tracked:
• DXY (US Dollar Index)
• Real Interest Rates (TIPS)
• US Treasury Yields (2Y, 10Y)
• Bitcoin (optional)
• Copper (optional)
THE BOTTOM LINE:
Stop guessing when to take profits.
Start SEEING your profit levels in real-time.
The indicator shows you the targets.
YOU choose when to cash out.
That's YOUR edge.
Developed for traders who want clear, actionable profit targets instead of vague signals.

Gold Inverse Correlation TrackerGold Inverse Correlation Tracker - Professional Multi-Asset Analysis
What This Indicator Does:
This indicator monitors the real-time correlation between Gold and five key financial assets that historically move inversely (opposite) to gold prices. It displays these relationships across three different timeframes simultaneously, giving you both short-term trading signals and long-term trend confirmation.
The indicator tracks:
US Dollar Index (DXY) - Historical correlation: -0.63
Real Interest Rates (TIPS) - Historical correlation: -0.82 (strongest inverse relationship)
10-Year Treasury Yield - Nominal interest rate proxy
S&P 500 (SPX) - Equity market sentiment (variable correlation)
VIX - Volatility index (optional, flight-to-safety indicator)
Why Inverse Correlations Matter for Gold Trading:
Understanding inverse correlations is critical for gold traders because:
Predictive Power - When assets move opposite to gold consistently, you can use their strength/weakness to predict gold's next move
Hedging Opportunities - Strong inverse correlations let you hedge gold positions by trading the inverse asset
Regime Detection - When correlations break down, it signals a market regime change or increased uncertainty
Confirmation Signals - Multiple strong inverse correlations validate your gold trade thesis
Risk Management - Knowing what moves against gold helps you understand your portfolio's true exposure
The Science Behind the Numbers:
Real interest rates have the strongest inverse correlation to gold (approximately -0.82) because:
Gold pays no yield or dividend
When real rates rise, the opportunity cost of holding gold increases
Investors shift to interest-bearing assets when they offer positive real returns
When real rates go negative, gold becomes relatively more attractive
The US Dollar shows strong inverse correlation (approximately -0.63) because:
Gold is priced in US dollars globally
A stronger dollar makes gold more expensive for foreign buyers, reducing demand
A weaker dollar makes gold cheaper internationally, increasing demand
Both compete as reserve assets and stores of value
Why the Indicator is Weighted This Way:
Three Timeframe Approach:
Short-term (20 periods) - Captures recent correlation shifts for day trading and swing trading
Medium-term (50 periods) - The primary signal - balances noise reduction with responsiveness
Long-term (100 periods) - Confirms structural correlation trends for position trading
Correlation Thresholds:
Strong Inverse (<-0.7) - Statistically significant inverse relationship; highest confidence for inverse trades
Moderate Inverse (<-0.3) - Meaningful inverse relationship; still useful but less reliable
Weak Inverse (<0.0) - Slight inverse tendency; correlation may be breaking down
Positive (>0.0) - Assets moving together; inverse relationship has failed
How to Use This Indicator:
For Inverse Trading Strategies:
When DXY shows RED correlation (<-0.7), consider shorting DXY when gold is strong
When Real Rates show RED correlation, rising rates = falling gold (and vice versa)
When multiple assets show strong inverse correlation, confidence is highest
For Regime Detection:
All RED = Classic gold market behavior; correlations intact
Mixed colors = Transitional market; be cautious
All GREEN/GRAY = Correlation breakdown; paradigm shift occurring
For Hedging:
Use assets with strong inverse correlation to hedge gold positions
When correlation weakens, reduce hedge size
When correlation strengthens, increase hedge effectiveness
Alert System:
The indicator includes built-in alerts for:
Individual assets crossing strong inverse threshold
Multiple assets simultaneously showing strong inverse correlation (highest probability setup)
Correlation breakdowns that may signal regime changes
Color Guide:
RED - Strong inverse correlation (<-0.7) - Best inverse trading opportunity
ORANGE - Moderate inverse (<-0.3) - Useful but less reliable
YELLOW - Weak inverse (<0.0) - Correlation weakening
GRAY - Weak positive (0.0 to 0.7) - Assets moving together
GREEN - Strong positive (>0.7) - Inverse relationship broken
Recommended Settings:
Day Trading (1H-4H charts):
Short: 14 periods
Medium: 30 periods
Long: 60 periods
Swing Trading (Daily charts):
Short: 20 periods (default)
Medium: 50 periods (default)
Long: 100 periods (default)
Position Trading (Weekly charts):
Short: 10 periods
Medium: 20 periods
Long: 50 periods
Pro Tips:
Watch for divergences - when gold moves but correlations don't confirm
Correlation breakdowns often precede major trend reversals
The Medium-term (50p) correlation is plotted on the chart as your primary reference
Use the Status column for quick assessment of each asset's relationship
Set alerts for "Multiple Strong Inverse" to catch highest-probability setups
Important Notes:
This indicator is designed for Gold charts only (XAUUSD, GLD, GC1!, etc.)
Correlations are not static - they change over time based on market conditions
A correlation of -0.82 means 82% of gold's price movements can be explained by real interest rates
Always combine with other technical analysis and fundamental factors
Past correlations do not guarantee future relationships
Based on Research:
The correlation coefficients used in this indicator are based on peer-reviewed research:
Erb & Harvey (1997-2012): Real rates to gold correlation of -0.82
World Gold Council (2024): US Dollar to gold correlation of -0.63
Multiple academic studies confirming gold's inverse relationship with opportunity cost assets
Use this indicator to trade smarter, hedge better, and understand the macro forces driving gold prices.

Gold/Silver Ratio with Supply ZonesGold/Silver Ratio with Supply Zones
Overview
Professional-grade indicator that tracks the Gold/Silver Ratio in real-time
Identifies potential market imbalances and rotation opportunities between precious metals
Features customizable threshold bands, moving averages, and automated trading signals
Built on Pine Script v6 for maximum stability and performance
Key Features
Real-Time Ratio Calculation : Automatically calculates Gold/Silver ratio using OANDA:XAUUSD and OANDA:XAGUSD price feeds
Dynamic Threshold Zones : Visual bands showing when silver or gold may be undervalued relative to each other
Moving Average Overlay : 20-period SMA to identify trend direction and momentum
Automated Buy Signals : Triangle markers appear when ratio reaches extreme levels
Live Information Table : Displays current ratio, moving average, individual metal prices, and market interpretation
Custom Alerts : Set notifications when ratio crosses your defined thresholds
Color-Coded Zones : Green zones indicate gold undervaluation, red zones indicate silver undervaluation
Trading Applications
Mean Reversion Strategy : Enter silver positions when ratio exceeds 90, enter gold when ratio falls below 70
Rotation Trading : Switch between metals based on relative value signals
Portfolio Rebalancing : Identify optimal times to adjust precious metals allocation
Divergence Analysis : Compare ratio behavior against individual metal price action
Default Settings
High Threshold : 90.0 (Silver undervalued zone)
Low Threshold : 70.0 (Gold undervalued zone)
Moving Average : 20-period SMA
Historical Reference : 80:1 ratio marked as long-term mean
How to Interpret
Ratio Above 90 : Silver is undervalued relative to gold - consider increasing silver exposure
Ratio Below 70 : Gold is undervalued relative to silver - consider increasing gold exposure
Ratio Between 70-90 : Neutral range - no clear relative value advantage
Rising Ratio : Gold outperforming silver
Falling Ratio : Silver outperforming gold
Signal Logic
Green Triangle (Bottom) : Ratio crosses above high threshold → Buy Silver Signal
Red Triangle (Top) : Ratio crosses below low threshold → Buy Gold Signal
MA Crossovers : Use 20-period MA for trend confirmation and entry timing
Visual Elements
Blue Line : Current gold/silver ratio value
Orange Line : 20-period moving average smoothing
Red Shaded Zone : Area where gold is relatively expensive
Green Shaded Zone : Area where gold is relatively cheap
Gray Dotted Line : Historical mean at 80:1
Info Table : Real-time statistics and market interpretation
Best Practices
Use on daily timeframe or higher for most reliable signals
Combine with volume analysis and individual metal technicals
Monitor Federal Reserve policy and USD strength as macro context
Consider industrial demand factors for silver (solar, EV, electronics)
Watch safe-haven flows during economic uncertainty for gold
Customization Options
Adjust threshold levels based on your preferred lookback period
Modify moving average length to suit your trading timeframe
Toggle bands on/off for cleaner chart visualization
Change data source tickers if using different brokers (FXCM, FOREXCOM, etc.)
Alert Conditions
Silver Undervalued Alert : Triggers when ratio crosses above your high threshold
Gold Undervalued Alert : Triggers when ratio crosses below your low threshold
Receive notifications via TradingView mobile app , email , or webhook
Who This Is For
Precious metals traders seeking relative value opportunities
Portfolio managers balancing gold and silver allocations
Macro traders using metals as inflation hedges
Swing traders capitalizing on mean reversion patterns
Long-term investors optimizing entry points
Important Notes
This indicator tracks price ratios , not physical supply data
COMEX warehouse stocks are not directly available in TradingView
Ratio analysis assumes historical mean reversion tendencies
Always combine with fundamental analysis and risk management
Past performance does not guarantee future results
Data Sources
Gold Price : OANDA:XAUUSD (spot gold in US dollars)
Silver Price : OANDA:XAGUSD (spot silver in US dollars)
Update Frequency : Real-time during market hours
Historical Data : Full TradingView historical coverage available

Gold Projection DivergenceGOLD PROJECTION DIVERGENCE
Oscillator Companion for the Gold Macro Projection Model
OVERVIEW
The Gold Projection Divergence oscillator quantifies how far gold is trading from its projected fair value. While the main indicator shows where gold should be, this oscillator shows how extreme the mispricing is—providing precise timing signals for entries and exits.
HOW IT WORKS
The oscillator calculates the difference between actual gold price and the projected value, then normalizes it as a Z-score . This statistical measure shows how many standard deviations gold is trading away from its projected fair value.
Z > +2 — Gold is 2+ standard deviations above fair value (extremely overvalued)
Z > +1 — Gold is moderately overvalued
Z = 0 — Gold is trading at projected fair value
Z < -1 — Gold is moderately undervalued
Z < -2 — Gold is 2+ standard deviations below fair value (extremely undervalued)
VISUAL ELEMENTS
Histogram — Color-coded divergence magnitude
Yellow Line — Smoothed Z-score
Dashed Lines — +2 and -2 standard deviation levels
Dotted Lines — +1 and -1 standard deviation levels
Triangle Markers — Extreme crossover signals
Circle Markers — Zero-line crossings
HISTOGRAM COLORS
Dark Red — Z > +2 (extreme overvaluation)
Orange — Z between +1 and +2
Light Orange — Z between 0 and +1
Light Green — Z between -1 and 0
Green — Z between -2 and -1
Lime — Z < -2 (extreme undervaluation)
COMPONENT TABLE
The breakdown table shows divergence from each individual factor:
Silver — Is gold over/undervalued relative to silver?
M2 — Is gold over/undervalued relative to money supply?
DXY — Is gold over/undervalued relative to dollar strength?
Equity — Is gold over/undervalued relative to stocks?
TIPS — Is gold over/undervalued relative to real rates?
TRADING APPLICATIONS
Mean Reversion Strategy
Enter LONG when Z < -2 and begins rising
Enter SHORT when Z > +2 and begins falling
Use zero-line crossings for trend confirmation
Trend Following Filter
Only take long trades when Z < 0 (undervalued)
Only take short trades when Z > 0 (overvalued)
Divergence Confirmation
Bearish: Price makes new highs while Z-score makes lower highs
Bullish: Price makes new lows while Z-score makes higher lows
ALERTS
Extreme Undervaluation — Z crosses below -2
Extreme Overvaluation — Z crosses above +2
Moderate Undervaluation — Z crosses below -1
Moderate Overvaluation — Z crosses above +1
Divergence Turned Positive — Crossed above zero
Divergence Turned Negative — Crossed below zero
COMBINED USAGE
For best results, use both indicators together :
Main Indicator — Visual context of actual vs. projected on price chart
Divergence Oscillator — Precise measurement for timing decisions
The main indicator shows where gold should be; the oscillator shows how extreme the mispricing is and when to act.
Disclaimer: This indicator is for educational purposes only. Past correlations do not guarantee future relationships. Market conditions can alter historical relationships. Always use proper risk management.

Gold Macro Projection ModelGOLD MACRO PROJECTION MODEL
Multi-Factor Fair Value Estimation for Gold
OVERVIEW
The Gold Macro Projection Model estimates gold's fair value based on its historical relationships with key macroeconomic drivers. By synthesizing data from silver , M2 money supply , the US Dollar Index , TIPS (real rates proxy) , and major equity indices , this indicator projects where gold should theoretically be trading—helping traders identify potential overvaluation and undervaluation conditions.
HOW IT WORKS
This indicator employs three complementary projection methodologies :
Correlation-Weighted Z-Score Composite (50% weight)
Calculates rolling correlations between gold and each input factor. Factors with stronger correlations receive more influence. Each factor is normalized to a z-score, combined into a composite, then converted back to gold's price scale.
Silver/Gold Ratio Mean Reversion (35% weight)
The silver/gold ratio historically exhibits mean-reverting behavior. This component projects gold's implied price based on current silver prices and the historical average ratio.
M2 Money Supply Relationship (15% weight)
Gold tracks monetary expansion over long time horizons. This anchors the projection to the fundamental relationship between gold and the monetary base.
INPUT FACTORS
Silver — Strong positive correlation; precious metals move together
M2 Money Supply — Positive correlation; gold as inflation hedge
US Dollar Index (DXY) — Typically negative correlation; inverse relationship
TIPS ETF — Real interest rate proxy; gold responds to real yields
Equity Indices — Variable correlation; risk-on/risk-off dynamics
VISUAL ELEMENTS
Yellow Line — Actual gold price
Aqua Line — Projected fair value
Green Fill — Gold trading below projection (potentially undervalued)
Red Fill — Gold trading above projection (potentially overvalued)
Aqua Bands — Standard deviation envelope around projection
INFO TABLE
The indicator displays a real-time information panel showing:
Current actual vs. projected price
Divergence percentage and Z-score
Rolling correlations for each factor
Dynamic weight allocation
Buy/Sell signal based on divergence extremes
SIGNAL INTERPRETATION
STRONG BUY — Z-score below -2 (extremely undervalued)
BUY — Z-score between -2 and -1 (moderately undervalued)
NEUTRAL — Z-score between -1 and +1 (fairly valued)
SELL — Z-score between +1 and +2 (moderately overvalued)
STRONG SELL — Z-score above +2 (extremely overvalued)
SETTINGS
Correlation Period — Lookback for correlation calculations (default: 60)
Regression Period — Lookback for mean/standard deviation (default: 120)
Smoothing Period — EMA smoothing for projection line (default: 10)
Auto Weights — Toggle between correlation-based or manual weights
Band Multiplier — Standard deviation multiplier for bands (default: 1.5)
ALERTS
Gold Extremely Undervalued — Z crosses below -2
Gold Extremely Overvalued — Z crosses above +2
Gold Crossed Above Projection
Gold Crossed Below Projection
BEST PRACTICES
Use on daily timeframe for most reliable signals
Combine with the companion Gold Divergence Oscillator for timing
Disclaimer: This indicator is for educational purposes only. Past correlations do not guarantee future relationships. Always use proper risk management.

Gold/Silver RatioOverview
This indicator displays the Gold/Silver Ratio by dividing the price of gold (XAUUSD) by the price of silver (XAGUSD) on the same timeframe. It is a widely used tool in macroeconomic and precious metals analysis, helping traders and investors evaluate the relative value of gold compared to silver.
📈 What it does
Plots the ratio between gold and silver prices as a line on the chart.
Displays two key horizontal levels:
Overbought level at 90 (dashed red line).
Oversold level at 70 (dashed green line).
Highlights the chart background to show extreme conditions:
Red shading when the ratio exceeds 90 (gold is likely overvalued relative to silver).
Green shading when the ratio drops below 70 (silver is likely overvalued relative to gold).
🧠 How to Use
When the ratio exceeds 90, it suggests that gold may be overbought or silver may be undervalued. Historically, these have been good times to consider shifting exposure from gold to silver.
When the ratio falls below 70, it may indicate silver is overbought or gold is undervalued.
This tool is best used in conjunction with technical analysis, macroeconomic trends, or RSI/Bollinger Bands applied to the ratio.
⚙️ Inputs
This version of the script uses OANDA's XAUUSD and XAGUSD pairs for spot gold and silver prices. You may edit the request.security() calls to change data sources (e.g., FXCM, FOREXCOM, or CFD tickers from your broker).
✅ Best For:
Macro traders
Commodity investors
Ratio and spread traders
Long-term portfolio reallocators

GOLD MonitorI'm using this platform from sometime and I carry out trading on Gold, using a kind of scalping strategy.
Scalping is not an easy task to do. Personally I found a lot of problems while detecting the trend direction.
So I decided to develop an indicator that is capable, in a discrete way, to give an instant-view on the market that is interesting.
This indicator can summarize in a small table all interesting figures related to gold scalping trading and is useful while joined with technical and fundamental analysis.
In this way it is possible to easy take under control all important aspects related to gold trading that I summarize here and you can find inside the table:
1) Gold / USD current direction
2) USD dollar strength (instant DXY) indicator take under consideration the DXY value every each tick and measures the increase or decrease in percentage. If there is a decrease the indicator displays a red low arrow, if there is an increase the indicator displays a green high arrow
also Gold friends are important so it is possible to find also:
3) NZDUSD (that is a Gold friend) variation percentage. If there is a decrease the indicator displays a red low arrow, if there is an increase the indicator displays a green high arrow
4) AUDUSD (that is a Gold friend) variation percentage. If there is a decrease the indicator displays a red low arrow, if there is an increase the indicator displays a green high arrow
then it is possible to find DXY USD dollar strength calculated between previous period (e.g. in timeframe M5 last 5 minutes) and current period (current 5 minutes). This indication is represented by an high arrow if there has been an increase, or by an low arrow if there has been a decrease.
Last but not least the information about the Gold trend itself with the possible forecast for the current period. This information must be carefully interpreted together with other instruments for technical analysis like Fibonacci lines.
