Polynomial Regression Keltner Channel [ChartPrime]Polynomial Regression Keltner Channel
⯁ OVERVIEW
The Polynomial Regression Keltner Channel [ ChartPrime ] indicator is an advanced technical analysis tool that combines polynomial regression with dynamic Keltner Channels. This indicator provides traders with a sophisticated method for trend analysis, volatility assessment, and identifying potential overbought and oversold conditions.
◆ KEY FEATURES
Polynomial Regression: Uses polynomial regression for trend analysis and channel basis calculation.
Dynamic Keltner Channels: Implements Keltner Channels with adaptive volatility-based bands.
Overbought/Oversold Detection: Provides visual cues for potential overbought and oversold market conditions.
Trend Identification: Offers clear trend direction signals and change indicators.
Multiple Band Levels: Displays four levels of upper and lower bands for detailed market structure analysis.
Customizable Visualization: Allows toggling of additional indicator lines and signals for enhanced chart analysis.
◆ FUNCTIONALITY DETAILS
⬥ Polynomial Regression Calculation:
Implements a custom polynomial regression function for trend analysis.
Serves as the basis for the Keltner Channel, providing a smoothed centerline.
//@function Calculates polynomial regression
//@param src (series float) Source price series
//@param length (int) Lookback period
//@returns (float) Polynomial regression value for the current bar
polynomial_regression(src, length) =>
sumX = 0.0
sumY = 0.0
sumXY = 0.0
sumX2 = 0.0
sumX3 = 0.0
sumX4 = 0.0
sumX2Y = 0.0
n = float(length)
for i = 0 to n - 1
x = float(i)
y = src
sumX += x
sumY += y
sumXY += x * y
sumX2 += x * x
sumX3 += x * x * x
sumX4 += x * x * x * x
sumX2Y += x * x * y
slope = (n * sumXY - sumX * sumY) / (n * sumX2 - sumX * sumX)
intercept = (sumY - slope * sumX) / n
n - 1 * slope + intercept
⬥ Dynamic Keltner Channel Bands:
Calculates ATR-based volatility for dynamic band width adjustment.
Uses a base multiplier and adaptive volatility factor for flexible band calculation.
Generates four levels of upper and lower bands for detailed market structure analysis.
atr = ta.atr(length)
atr_sma = ta.sma(atr, 10)
// Calculate Keltner Channel Bands
dynamicMultiplier = (1 + (atr / atr_sma)) * baseATRMultiplier
volatility_basis = (1 + (atr / atr_sma)) * dynamicMultiplier * atr
⬥ Overbought/Oversold Indicator line and Trend Line:
Calculates an OB/OS value based on the price position relative to the innermost bands.
Provides visual representation through color gradients and optional signal markers.
Determines trend direction based on the polynomial regression line movement.
Generates signals for trend changes, overbought/oversold conditions, and band crossovers.
◆ USAGE
Trend Analysis: Use the color and direction of the basis line to identify overall trend direction.
Volatility Assessment: The width and expansion/contraction of the bands indicate market volatility.
Support/Resistance Levels: Multiple band levels can serve as potential support and resistance areas.
Overbought/Oversold Trading: Utilize OB/OS signals for potential reversal or pullback trades.
Breakout Detection: Monitor price crossovers of the outermost bands for potential breakout trades.
⯁ USER INPUTS
Length: Sets the lookback period for calculations (default: 100).
Source: Defines the price data used for calculations (default: HLC3).
Base ATR Multiplier: Adjusts the base width of the Keltner Channels (default: 0.1).
Indicator Lines: Toggle to show additional indicator lines and signals (default: false).
⯁ TECHNICAL NOTES
Implements a custom polynomial regression function for efficient trend calculation.
Uses dynamic ATR-based volatility adjustment for adaptive channel width.
Employs color gradients and opacity levels for intuitive visual representation of market conditions.
Utilizes Pine Script's plotchar function for efficient rendering of signals and heatmaps.
The Polynomial Regression Keltner Channel indicator offers traders a sophisticated tool for trend analysis, volatility assessment, and trade signal generation. By combining polynomial regression with dynamic Keltner Channels, it provides a comprehensive view of market structure and potential trading opportunities. The indicator's adaptability to different market conditions and its customizable nature make it suitable for various trading styles and timeframes.
Поиск скриптов по запросу "KELTNER"

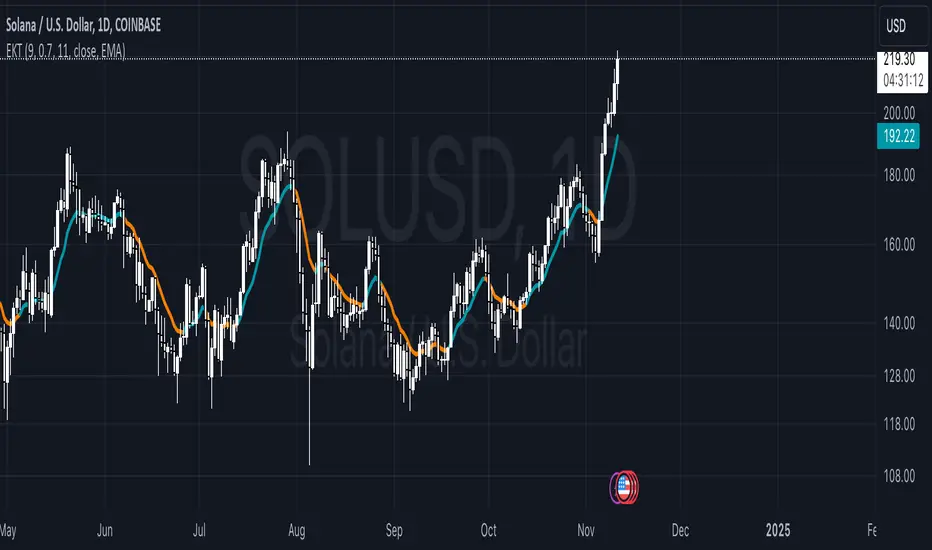
Enhanced Keltner TrendThe Enhanced Keltner Trend (EKT) indicator builds on the classic Keltner Channel, using volatility to define potential trend channels around a central moving average. It combines customizable volatility measures moving average, giving traders flexibility to adapt the trend channel to various market conditions.
How It Works?
MA Calculation:
A user-defined moving average forms the central line (or price basis) of the Keltner Channel.
Channel Width:
The width of the Keltner Channel depends on market volatility.
You can choose between two methods for measuring the volatility:
ATR-based Width: Uses the Average True Range (ATR) with customizable periods and multipliers.
Price Range Width: Uses the high and low price range over a defined period.
Trend Signal:
The trend is evaluated by price in relation to the Keltner Channel:
Bullish Trend (Blue Line): When the price crosses above the upper band, it signals upward momentum.
Bearish Trend (Orange Line): When the price crosses below the lower band, it signals downward momentum.
What Is Unique?
This Enhanced version of the Keltner Trend is for investors who want to have more control over the Keltner's channels calculation, so they can calibrate it to provide them more alpha when combined with other Technical Indicators.
Use ATR: Gives the user the choice to use the ATR for the channel width calculation, or use the default High - Low over specified period.
ATR Period: Users can modify ATR length to calculate the channels width (Volatility).
ATR Multiplier: Users can fine-tune how much of the volatility they want to factor into the channels, providing more control over the final calculation.
MA Period: Smoothing period for the Moving Averages.
MA Type: Choosing from different Moving Averages types providing different smoothing types.
Setting Alerts:
Built-in alerts for trend detection:
Bullish Trend: When price crosses the upper band, it signals a Bullish Signal (Blue Color)
Bearish Trend: When price crosses the lower band, it signals a Bearish Signal (Orange Color)
Credits to @jaggedsoft , it's a modified version of his.
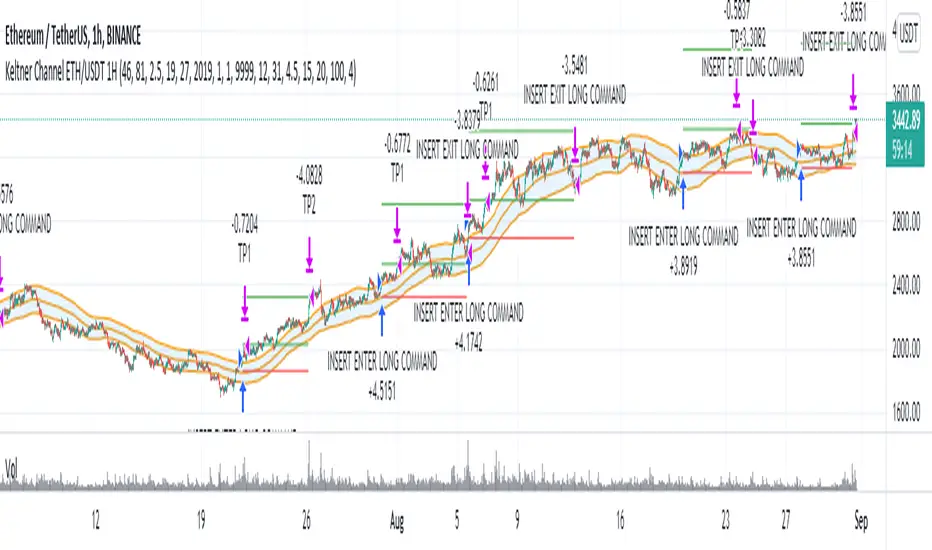
Dual Keltner Channels Strategy [Eastgate3194]This strategy utilised 2 Keltner Channels to perform counter trade.
The strategy have 2 steps:
Long Position:
Step 1. Close price must cross under Outer Lower band of Keltner Channel.
Step 2. Close price cross over Inner Lower band of Keltner Channel.
Short Position:
Step 1. Close price must cross over Outer Upper band of Keltner Channel.
Step 2. Close price cross under Inner Upper band of Keltner Channel.

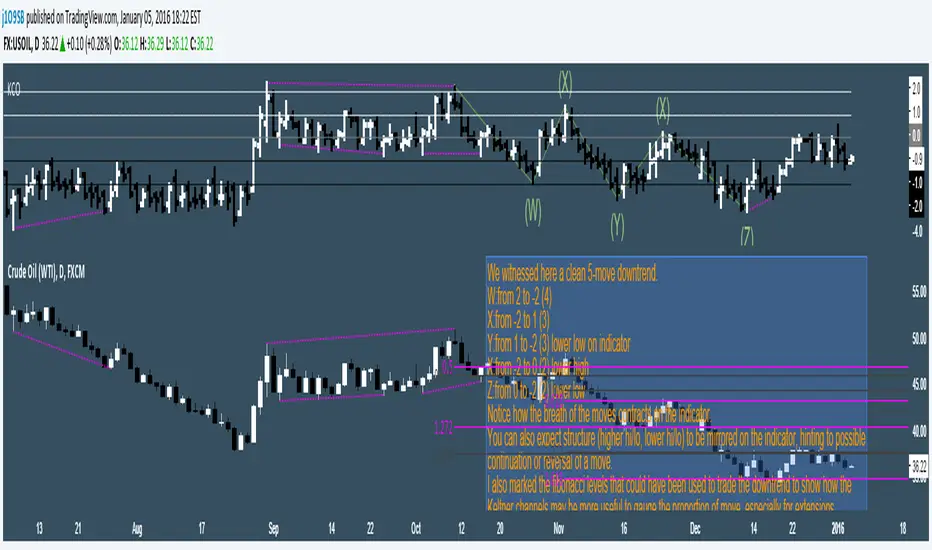
Keltner Center Of Gravity Channel ( KeltCOG )I have the ambition to create a ‘landscape’ which enables the user to see the ‘mood’ of the market about the price of an instrument, simply by looking where the candles go. Prices are a simple phenomenon , they go up or down or stay the same. This is represented quite well for the short term by a candle. I recommend to study candle patterns. Prices not only fluctuate but also trend up, down or go sideways. The user should analyze this by determining the COG (Center Of Gravity) and the ‘normal’ current range by using the historical data in a lookback period.
As a COG the center line of a Donchian Channel is often used. I.m.o. a COG should be a zone, in this channel I use the gray zone of my Donchian Fibonacci Channel, The ‘normal’ range is a multiple of Average True Range, as used in a Keltner Channel. Combining the two can give a cumbersome result, as one can see in my Keltner Fibonacci Channel. In this KeltCOG channel I solved this by not using all Fibonacci levels and by making the Keltner lines strictly parallel to the nearest COG line. To do this, I use the fact that the COG lines have horizontal stretches, there I make the Keltner lines horizontal too. Only where the COG lines change value, the Keltner lines are recalculated. This way the channel gets a very regular shape with three clear zones.
Interpretation of a chart by using the KeltCOG channel.
Overbought: If the candles go higher then the blue zone, the market is hyper enthusiast, creating an overbought situation. This is often followed by a reversion to the COG.
Uptrend: If the candles form in the blue zone, the market is enthusiast and willing to pay more.
Hopeful: If the candles form in or near the upper uncolored zone, the market is hopeful and is thinking about paying more. Sometimes prices go a little up.
Content: If the candles form in the gray zone, which represents COG, the market is happy with the current prices, so these move sideways
Disappointed: If the candles form in or near the lower uncolored zone, the market is disappointed and contemplates paying less, sometimes prices go a little down.
Downtrend: If the candles form in red zone, the market doesn’t like the instrument at all, rejects the current price and is only prepared to pay less.
Oversold: If the candles form below the red zone, the market overdoes its disgust, creating an oversold situation, often followed by a reversion to the COG.

Keltner Channels Bands (RMA)Keltner Channel Bands
These normally consist of:
Keltner Channel Upper Band = EMA + Multiplier ∗ ATR
Keltner Channel Lower Band = EMA − Multiplier ∗ ATR
However instead of using ATR we are using RMA
This gives us a much smoother take of the KCB
We are also using 2 sets of bands built on 1 Moving average, this is a common set up for mean reversion strategies.
This can often be paired with RSI for lower timeframe divergences
Divergence
This is using the RSI to calculate when price sets new lows/highs whilst the RSI movement is in the opposite direction.
The way this is calculated is slightly different to traditional divergence scripts. instead of looking for pivot highs/lows in the RSI we are logging the RSI value when price makes it pivot highs/lows.
Gradient Bands
The Gradient Colouring on the bands is measuring how long price has been either side of the MA.
As Keltner bands are commonly used as a mean reversion strategy, I thought it would be useful to see how long price has been trending in a certain direction, the stronger the colours get,
the longer price has been trending that direction which could suggest we are looking for a retrace soon.
Alerts
Alerts included let you choose whether you want to receive an alert for the inside, outside or both band touches.
To set up these alerts, simply toggle them on in the settings, then click on the 3 dots next to the indicators name, from there you click 'Add Alert'.
From there you can customise the alert settings but make sure to leave the 2 top boxes which control the alert conditions. They will be default selected onto your correct settings, the rest you may want to change.
Once you create the alert, it will then trigger as soon as price touches your chosen inside/outside band.
Suggestions
Please feel free to offer any suggestions which you think could improve the script
Disclaimer
The default settings/parameters were shared by Jimtalbott, feel free to play about with the and use this code to make your own strategies.

mForex - Keltner channel + EMA Scalping systemTransaction setup parameters
Time frame: M5, M15
Currency pair: EUR / USD , GPB / USD
Transaction: London, USA
Number of orders / day: 10 - 15 orders
Trading strategies
=== BUY ===
Candles close on the upper Keltner
EMA10 crosses the upper Keltner range from below
Stop loss in the middle band or up to 12 pips
Profit target: 15-25 pips
=== SELL ===
Candles close below Keltner below
EMA10 crosses the Keltner range below from above
Stop loss in the middle band or up to 12 pips
Profit target: 15-25 pips

Keltner Channel - Trend Based StrategyThis strategy is based on 3 main indicators.
1st indicator is a trend indicator, which consists of SMA and EMA
2nd is Keltner Channel
3rd is DM indicator.
The conditions for the entry of this strategy are following:
First of all the assets need to be in an upward trend, this will occur when the EMA will cross SMA. The next condition for the entry is the opening and the closure of the candle. The open price of the candle should be in the upper part of the Keltner Channel and the close price should be above the Keltner channel. The third condition for the DM indicator is to be above a certain benchmakr. This benchmark can be set in the settings of the strategy.
The strategy has two potential Take Profit levels and single stop-loss levels. For the more efficient way you may try an use the trailing stop or extend the number of take-profit levels.
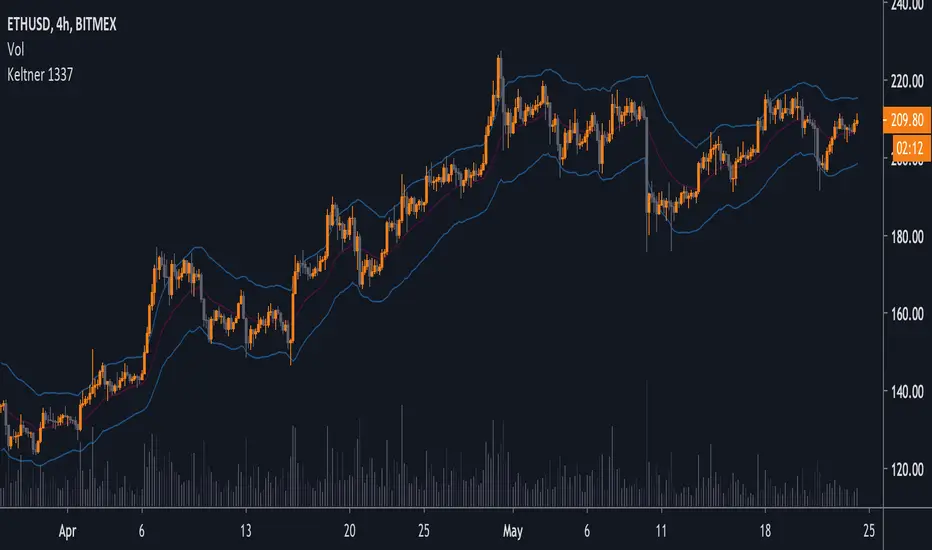
Adam H Grimes - Keltner Channels with Day's High & LowThe indicator shows the day's high and low along with the Keltner Channels.
Keltner Channel Period - 20
Keltner Channel Multiple - 2.25

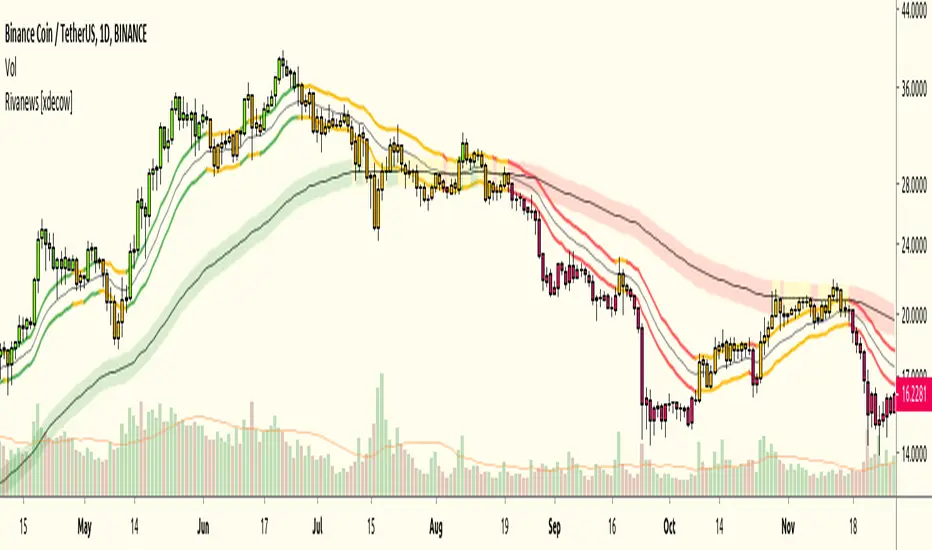
Rivanews Setup - Riva-Keltner, Média Rock [xdecow]This setup was created by Rivadavila S. Malheiros
There are 2 Keltner Channels with exponential moving averages of 21 (riva) and 89 (rock) and ATR multiplier of 0.618.
When the price is between the bands, it is a sign of consolidation (yellow).
When the price is above the bands, it is an upward trend (green).
When the price is below the bands, it is a downward trend (red).
When the price crosses rock 89 and closes up / down, it may be a sign of a reversal. But it has a high probability of testing rock 89 again.
------------------------------------------------------------------------------------------
PT-BR
Este setup foi criado por Rivadavila S. Malheiros
São 2 Keltner Channels com médias móveis exponenciais de 21 (riva) e 89 (rock) e multiplicador do ATR de 0.618.
Quando o preço está entre as bandas, é sinal de consolidação (amarelo).
Quando o preço está acima das bandas, é uma tendencia de alta (verde).
Quando o preço está abaixo das bandas, é uma tendencia de baixa (vermelho).
Quando o preço cruza a rock 89 e fecha acima/abaixo, pode ser sinal de reversão. Mas tem uma alta probabilidade de testar a rock 89 novamente.
Keltner Channel Strategy The Keltner Channel, a classic indicator
of technical analysis developed by Chester Keltner in 1960.
The indicator is a bit like Bollinger Bands and Envelopes.
WARNING:
- This script to change bars colors.

Keltner Channel The Keltner Channel, a classic indicator
of technical analysis developed by Chester Keltner in 1960.
The indicator is a bit like Bollinger Bands and Envelopes.

Keltner Trend V3It's just a simple keltner trend with options added to:
Eradicate repainting
more MAs
Json alerts (useful for bots)
I recommend using "open" option for all sources if you are going to use it with a bot, or if you want to be safe and enter with confirmations. Using the default settings would also show you all the entries without repainting as it uses high and low prices to check breakouts and not solely the close price (which is generally a false representative in historic analysis).
My favorite lengths are 7, 14, and 21. There is no specific reason, they just seem to work well most of the time. You can (and should) optimize it to your purposes.
Thanks to the original author @jaggedsoft this script is just a improved version of theirs.

Advanced Keltner ChannelsThis is a more advanced version of the standard Keltner Channels indicator. It allows you to change the type of the moving average (Simple, Exponential, Weighted, Volume-weighted, Triple EMA or a moving average that uses RSI ). The indicator also allows you to volume weight the indicator (turned on by default). If you want to weight the indicator against the true range instead of volume this is also possible. By default, this will be done automatically for assets that do not support volume .

Keltner Channels Oscillator v2A cleaner aesthetic and an introduction to the indicator's uses.
I would also be very appreciative of any Keltner Channels related ideas or concepts you may have run across to add features to this indicator.
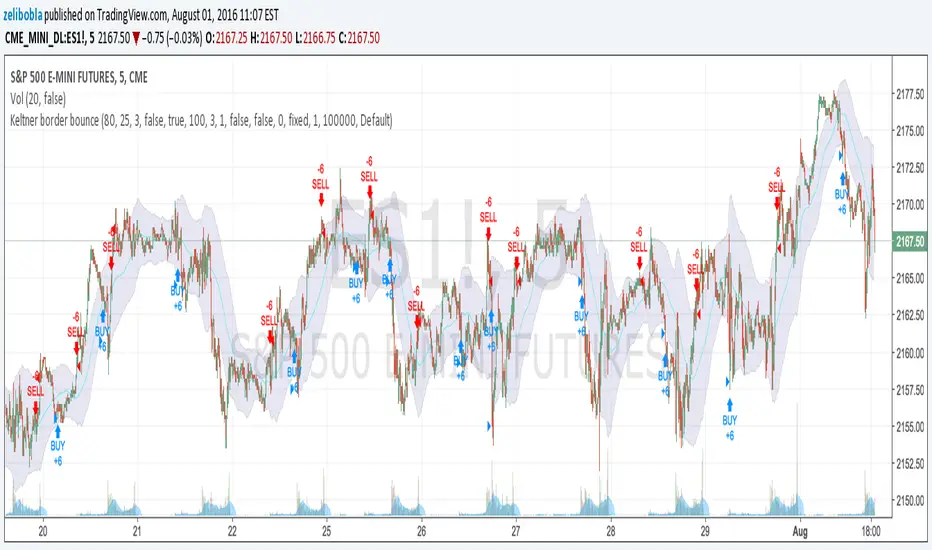
Keltner bounce from border. No repaint. V2 (by Zelibobla)WARNING: despite of strategy doesn't use future data (not repaints) it doesn't consider broker`s commissions, which can be harmful for real life high frequency trading. Strategy will definitely fail on non-ordinary security behavior. But if new behavior will get stable, tuned params should make strategy profitable again.
This is the second version of this strategy
I've added emergency stop-loss ordering, parametrized trade size and enabled to switch strategy entry mode. Now it looks good on bigger timeframes such as 5min (ES1!) on screenshot. You are welcome to bring new ideas to enhance performance.
Keltner bounce from border. No repaint. (by Zelibobla)WARNING: despite of strategy doesn't use future data (not repaints) it doesn't consider broker`s commissions, which can be harmful for real life high frequency trading.
Strategy works well on ES futures short bars like 1min.

Keltner Channel with auto highlighting of Bear/Bull reversals*** New version @ ****
All options configurable.
Reversals are marked using crosses. as well as highlighted using green/red color (depending on bull/bear). Enjoy!

Keltner-1-2-3Keltner Bands with 3 different widths
Customizable for
Middle band as EMA/SMA
ATR as EMA/SMA
Lookback period
Width of the 3 bands

Bollinger Bands + Keltner Channel Refurbished█ Goals
This is an indicator that brings together Bollinger Bands and Keltner's Channels in one thing.
Both are very similar, so I decided to make a merge of the best features I found out there.
Here there is the possibility of choosing one of these two as needed.
In addition, I added the following resources:
1. Pre-Defined intermediate bands with Fibonacci values;
2. Detachment of the bands in which the price was present;
3. Choice of Moving Average:
"Simple", "Exponential", "Regularized Exponential", "Hull", "Arnaud Legoux", "Weighted Moving Average", "Least Squares Moving Average (Linear Regression)", "Volume Weighted Moving Average", "Smoothed Moving Average", "Median", "VWAP");
4. Statistics: bars count within the bands.
█ Concepts
Keltner Channels vs. Bollinger Bands
"These two indicators are quite similar.
Keltner Channels use ATR to calculate the upper and lower bands while Bollinger Bands use standard deviation instead.
The interpretation of the indicators is similar, although since the calculations are different the two indicators may provide slightly different information or trade signals."
(Investopedia)
Bollinger Bands (BB)
"Bollinger Bands (BB) are a widely popular technical analysis instrument created by John Bollinger in the early 1980’s.
Bollinger Bands consist of a band of three lines which are plotted in relation to security prices.
The line in the middle is usually a Simple Moving Average (SMA) set to a period of 20 days (the type of trend line and period can be changed by the trader; however a 20 day moving average is by far the most popular).
The SMA then serves as a base for the Upper and Lower Bands which are used as a way to measure volatility by observing the relationship between the Bands and price.
Typically the Upper and Lower Bands are set to two standard deviations away from the SMA (The Middle Line); however the number of standard deviations can also be adjusted by the trader."
(TradingView)
Keltner Channels (KC)
"The Keltner Channels (KC) indicator is a banded indicator similar to Bollinger Bands and Moving Average Envelopes.
They consist of an Upper Envelope above a Middle Line as well as a Lower Envelope below the Middle Line.
The Middle Line is a moving average of price over a user-defined time period.
Either a simple moving average or an exponential moving average are typically used. The Upper and Lower Envelopes (user defined) are set a range away from the Middle Line.
This can be a multiple of the daily high/low range, or more commonly a multiple of the Average True Range."
(TradingView)
█ Examples
Bollinger Bands with 200 REMA:
Keltner Channel with 200 REMA:
Bollinger Bands with 55 ALMA:
Keltner Channel with 55 ALMA:
Bollinger Bands with 55 Least Squares Moving Average:
█ Thanks
- TradingView (BB, KC, ATR, MA's)
- everget (Regularized Exponential Moving Average)
- TimeFliesBuy ("Triple Bollinger Bands")
- Rashad ("Fibonacci Bollinger Bands")
- Dicargo_Beam ("Is the Bollinger Bands assumption wrong?")

LNL Keltner ExhaustionLNL Keltner Exhaustion resolves the constant issue of Bands vs. EMAs
With the keltner exhaustion wedges, you can easily see the keltner channel extremes witout using the actual bands. That way, you will know whether the price is outside of the keltner channels + you can use other indicators (such as EMAs) on chart without the bands so the chart does not look messy & hard to read.
Two Types of Wedges:
1. Green/Red Wedge - Price action is extended outside the regular band. More of a "profit taking" zone rather than "entry taking" (default set to 3.0 ATR factor).
2. Purple Wedge - Price action is extended outside of the extreme band. Chances are price will revert to mean soon (default set to 4.0 ATR factor).
Works great as a target tool with the squeeze setup or as an overall extension gauge.
Hope it helps.

LNL Keltner CandlesLNL Keltner Candles
This indicator plots mean reversion (reversal) arrows with custom painted candles based on the price touch or close above or below keltner channel limits (upper & lower bands). This study was created primarily for swing trading & higher time frames such as daily and weekly. Lower time frames might result in more false signals.
Mean Reversal Arrows:
1. Reversal Arrow Up - If the price drops below the lower band extremes, reversal up is the trigger for a bullish mean reversion.
2. Reversal Arrow Down - Once the price reach the higher band extremes, reversal down is the trigger for a bearish mean reversion.
The Concept of Mean Reversion:
There are just two types of moves in any market: The market is either expanding from the mean or retracing back to the mean. These reversions & epxansions are happening across all types of markets. The goal of this study is to catch the powerful mean reversion from extremes back to the mean. Once the candles light up green / red, it is time to look for the reversal (purple) arrow which triggers the mean reversion setup. Mean reversion is not about catching the next big swing turn to new highs or lows. It is all about the base hits = the mean. So the target here is always the average price. The idea here is to catch the average market ebbs & flows, not the next home run.
What Do I Mean by Mean?
Mean is usually the average price from the last 20-30 bars. Basically something like a 20 MA or Keltner Channel or Bollinger Band midline are really good visual representators of the mean (average price).
Hope it helps.

Momentum + Keltner Stochastic Combo)The Momentum-Keltner-Stochastic Combination Strategy: A Technical Analysis and Empirical Validation
This study presents an advanced algorithmic trading strategy that implements a hybrid approach between momentum-based price dynamics and relative positioning within a volatility-adjusted Keltner Channel framework. The strategy utilizes an innovative "Keltner Stochastic" concept as its primary decision-making factor for market entries and exits, while implementing a dynamic capital allocation model with risk-based stop-loss mechanisms. Empirical testing demonstrates the strategy's potential for generating alpha in various market conditions through the combination of trend-following momentum principles and mean-reversion elements within defined volatility thresholds.
1. Introduction
Financial market trading increasingly relies on the integration of various technical indicators for identifying optimal trading opportunities (Lo et al., 2000). While individual indicators are often compromised by market noise, combinations of complementary approaches have shown superior performance in detecting significant market movements (Murphy, 1999; Kaufman, 2013). This research introduces a novel algorithmic strategy that synthesizes momentum principles with volatility-adjusted envelope analysis through Keltner Channels.
2. Theoretical Foundation
2.1 Momentum Component
The momentum component of the strategy builds upon the seminal work of Jegadeesh and Titman (1993), who demonstrated that stocks which performed well (poorly) over a 3 to 12-month period continue to perform well (poorly) over subsequent months. As Moskowitz et al. (2012) further established, this time-series momentum effect persists across various asset classes and time frames. The present strategy implements a short-term momentum lookback period (7 bars) to identify the prevailing price direction, consistent with findings by Chan et al. (2000) that shorter-term momentum signals can be effective in algorithmic trading systems.
2.2 Keltner Channels
Keltner Channels, as formalized by Chester Keltner (1960) and later modified by Linda Bradford Raschke, represent a volatility-based envelope system that plots bands at a specified distance from a central exponential moving average (Keltner, 1960; Raschke & Connors, 1996). Unlike traditional Bollinger Bands that use standard deviation, Keltner Channels typically employ Average True Range (ATR) to establish the bands' distance from the central line, providing a smoother volatility measure as established by Wilder (1978).
2.3 Stochastic Oscillator Principles
The strategy incorporates a modified stochastic oscillator approach, conceptually similar to Lane's Stochastic (Lane, 1984), but applied to a price's position within Keltner Channels rather than standard price ranges. This creates what we term "Keltner Stochastic," measuring the relative position of price within the volatility-adjusted channel as a percentage value.
3. Strategy Methodology
3.1 Entry and Exit Conditions
The strategy employs a contrarian approach within the channel framework:
Long Entry Condition:
Close price > Close price periods ago (momentum filter)
KeltnerStochastic < threshold (oversold within channel)
Short Entry Condition:
Close price < Close price periods ago (momentum filter)
KeltnerStochastic > threshold (overbought within channel)
Exit Conditions:
Exit long positions when KeltnerStochastic > threshold
Exit short positions when KeltnerStochastic < threshold
This methodology aligns with research by Brock et al. (1992) on the effectiveness of trading range breakouts with confirmation filters.
3.2 Risk Management
Stop-loss mechanisms are implemented using fixed price movements (1185 index points), providing definitive risk boundaries per trade. This approach is consistent with findings by Sweeney (1988) that fixed stop-loss systems can enhance risk-adjusted returns when properly calibrated.
3.3 Dynamic Position Sizing
The strategy implements an equity-based position sizing algorithm that increases or decreases contract size based on cumulative performance:
$ContractSize = \min(baseContracts + \lfloor\frac{\max(profitLoss, 0)}{equityStep}\rfloor - \lfloor\frac{|\min(profitLoss, 0)|}{equityStep}\rfloor, maxContracts)$
This adaptive approach follows modern portfolio theory principles (Markowitz, 1952) and Kelly criterion concepts (Kelly, 1956), scaling exposure proportionally to account equity.
4. Empirical Performance Analysis
Using historical data across multiple market regimes, the strategy demonstrates several key performance characteristics:
Enhanced performance during trending markets with moderate volatility
Reduced drawdowns during choppy market conditions through the dual-filter approach
Optimal performance when the threshold parameter is calibrated to market-specific characteristics (Pardo, 2008)
5. Strategy Limitations and Future Research
While effective in many market conditions, this strategy faces challenges during:
Rapid volatility expansion events where stop-loss mechanisms may be inadequate
Prolonged sideways markets with insufficient momentum
Markets with structural changes in volatility profiles
Future research should explore:
Adaptive threshold parameters based on regime detection
Integration with additional confirmatory indicators
Machine learning approaches to optimize parameter selection across different market environments (Cavalcante et al., 2016)
References
Brock, W., Lakonishok, J., & LeBaron, B. (1992). Simple technical trading rules and the stochastic properties of stock returns. The Journal of Finance, 47(5), 1731-1764.
Cavalcante, R. C., Brasileiro, R. C., Souza, V. L., Nobrega, J. P., & Oliveira, A. L. (2016). Computational intelligence and financial markets: A survey and future directions. Expert Systems with Applications, 55, 194-211.
Chan, L. K. C., Jegadeesh, N., & Lakonishok, J. (2000). Momentum strategies. The Journal of Finance, 51(5), 1681-1713.
Jegadeesh, N., & Titman, S. (1993). Returns to buying winners and selling losers: Implications for stock market efficiency. The Journal of Finance, 48(1), 65-91.
Kaufman, P. J. (2013). Trading systems and methods (5th ed.). John Wiley & Sons.
Kelly, J. L. (1956). A new interpretation of information rate. The Bell System Technical Journal, 35(4), 917-926.
Keltner, C. W. (1960). How to make money in commodities. The Keltner Statistical Service.
Lane, G. C. (1984). Lane's stochastics. Technical Analysis of Stocks & Commodities, 2(3), 87-90.
Lo, A. W., Mamaysky, H., & Wang, J. (2000). Foundations of technical analysis: Computational algorithms, statistical inference, and empirical implementation. The Journal of Finance, 55(4), 1705-1765.
Markowitz, H. (1952). Portfolio selection. The Journal of Finance, 7(1), 77-91.
Moskowitz, T. J., Ooi, Y. H., & Pedersen, L. H. (2012). Time series momentum. Journal of Financial Economics, 104(2), 228-250.
Murphy, J. J. (1999). Technical analysis of the financial markets: A comprehensive guide to trading methods and applications. New York Institute of Finance.
Pardo, R. (2008). The evaluation and optimization of trading strategies (2nd ed.). John Wiley & Sons.
Raschke, L. B., & Connors, L. A. (1996). Street smarts: High probability short-term trading strategies. M. Gordon Publishing Group.
Sweeney, R. J. (1988). Some new filter rule tests: Methods and results. Journal of Financial and Quantitative Analysis, 23(3), 285-300.
Wilder, J. W. (1978). New concepts in technical trading systems. Trend Research.
