Moving Average CrossNote: This is just an idea, I did not test this for trading.
MA Cross normally uses close as source in the moving averages, this script uses highs and lows as source.
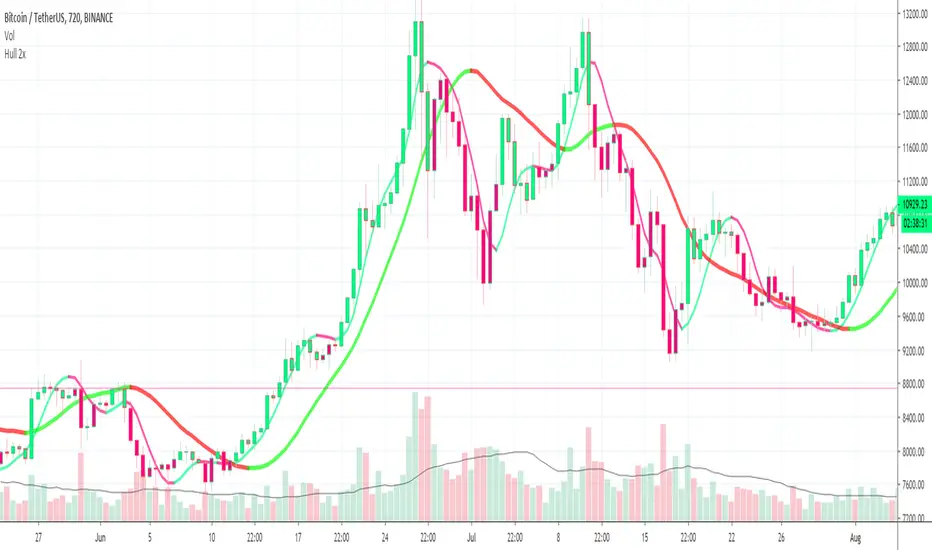
In an uptrend you will see the 20 period high EMA and 50 period low EMA, once they cross, the indicator will switch to 20 period low EMA and 50 period high EMA. This gives it way less fake crosses as you see in the image on BTC.
As i said above, this is just an idea. If you change the settings, they might not cross at all.. so do your own testing.
Hope this code can help someone.
Индикатор Pine Script®