Modified MACD with Zero LineBased on Adam H. Grimes' Modified MACD. Uses a 3/10 simple MA for the fast line and a 16 for the signal line. Added a zero line.
Поиск скриптов по запросу "MACD"
Arpeet MACDOverview
This strategy is based on the zero-lag version of the MACD (Moving Average Convergence Divergence) indicator, which captures short-term trends by quickly responding to price changes, enabling high-frequency trading. The strategy uses two moving averages with different periods (fast and slow lines) to construct the MACD indicator and introduces a zero-lag algorithm to eliminate the delay between the indicator and the price, improving the timeliness of signals. Additionally, the crossover of the signal line and the MACD line is used as buy and sell signals, and alerts are set up to help traders seize trading opportunities in a timely manner.
Strategy Principle
Calculate the EMA (Exponential Moving Average) or SMA (Simple Moving Average) of the fast line (default 12 periods) and slow line (default 26 periods).
Use the zero-lag algorithm to double-smooth the fast and slow lines, eliminating the delay between the indicator and the price.
The MACD line is formed by the difference between the zero-lag fast line and the zero-lag slow line.
The signal line is formed by the EMA (default 9 periods) or SMA of the MACD line.
The MACD histogram is formed by the difference between the MACD line and the signal line, with blue representing positive values and red representing negative values.
When the MACD line crosses the signal line from below and the crossover point is below the zero axis, a buy signal (blue dot) is generated.
When the MACD line crosses the signal line from above and the crossover point is above the zero axis, a sell signal (red dot) is generated.
The strategy automatically places orders based on the buy and sell signals and triggers corresponding alerts.
Advantage Analysis
The zero-lag algorithm effectively eliminates the delay between the indicator and the price, improving the timeliness and accuracy of signals.
The design of dual moving averages can better capture market trends and adapt to different market environments.
The MACD histogram intuitively reflects the comparison of bullish and bearish forces, assisting in trading decisions.
The automatic order placement and alert functions make it convenient for traders to seize trading opportunities in a timely manner, improving trading efficiency.
Risk Analysis
In volatile markets, frequent crossover signals may lead to overtrading and losses.
Improper parameter settings may cause signal distortion and affect strategy performance.
The strategy relies on historical data for calculations and has poor adaptability to sudden events and black swan events.
Optimization Direction
Introduce trend confirmation indicators, such as ADX, to filter out false signals in volatile markets.
Optimize parameters to find the best combination of fast and slow line periods and signal line periods, improving strategy stability.
Combine other technical indicators or fundamental factors to construct a multi-factor model, improving risk-adjusted returns of the strategy.
Introduce stop-loss and take-profit mechanisms to control single-trade risk.
Summary
The MACD Dual Crossover Zero Lag Trading Strategy achieves high-frequency trading by quickly responding to price changes and capturing short-term trends. The zero-lag algorithm and dual moving average design improve the timeliness and accuracy of signals. The strategy has certain advantages, such as intuitive signals and convenient operation, but also faces risks such as overtrading and parameter sensitivity. In the future, the strategy can be optimized by introducing trend confirmation indicators, parameter optimization, multi-factor models, etc., to improve the robustness and profitability of the strategy.

Uptrick: MACD Slope Buy/Sell SignalsThe "Uptrick: MACD Slope Buy/Sell Signals" indicator is an advanced technical analysis tool meticulously crafted to provide traders with precise buy and sell signals derived from the slope changes of the Moving Average Convergence Divergence (MACD) signal line. This indicator integrates user-defined parameters for the MACD calculation, including the fast length, slow length, and signal smoothing period. These parameters allow traders to customize the indicator according to their specific trading strategies and timeframes, ensuring adaptability across various market conditions.
The primary function of this indicator is to monitor the slope of the MACD signal line and detect significant shifts that indicate potential changes in market momentum. The indicator calculates the slope by comparing the current value of the signal line to its previous value, and further determines the change in slope to identify acceleration or deceleration in the trend. A buy signal is generated when the slope of the signal line transitions from negative to positive, signaling an upward momentum, while a sell signal is triggered when the slope moves from positive to negative, indicating a downward trend. To enhance signal accuracy, the indicator distinguishes between regular and strong signals. A strong buy signal requires the slope change to be greater than the simple moving average (SMA) of recent slope changes, whereas a strong sell signal necessitates the slope change to be less than the negative SMA of recent slope changes.
A unique feature of this indicator is its dynamic and intuitive visualization. When a strong buy or sell signal is identified, it plots labels ('B' for buy and 'S' for sell) directly on the price chart. These labels are strategically positioned below or above the respective bars to ensure clear visibility and reduce chart clutter. The indicator also includes an option to connect consecutive signals with lines, which enhances the visual tracking of signal sequences and provides a coherent view of the trend's progression. The color intensity of the plotted signals varies based on the absolute value of the slope, offering an immediate visual cue on the strength of the detected trend changes. A steeper slope results in a darker color, signaling a stronger trend.
To facilitate comprehensive analysis, the indicator also plots the MACD and signal lines on the chart, providing traders with a reference to the underlying data that drives the buy and sell signals. These lines are color-coded for easy differentiation: the MACD line is typically blue, and the signal line is orange. This visual aid ensures that traders have a clear understanding of the indicator's basis and can cross-reference the generated signals with the MACD behavior.
The calculation of this indicator is grounded in well-established technical analysis principles. It employs the MACD function to derive the MACD line and signal line based on the user-defined parameters. The slope of the signal line is then computed, followed by the calculation of the slope change. The buy and sell signals are determined by comparing the current and previous slopes, and the strong signals are filtered through an additional layer of slope change analysis relative to its moving average.
The accuracy and reliability of the "Uptrick: MACD Slope Buy/Sell Signals" indicator stem from its thorough and methodical approach to signal generation. By combining user customization, detailed slope analysis, and robust visual elements, this indicator serves as a powerful tool for traders seeking precise entry and exit points in the market. Its ability to adapt to different trading styles and market conditions, coupled with its clear visual cues, makes it a valuable addition to any trader's toolkit, enhancing decision-making and improving trading outcomes.

5 min scalp macd5 min scalp macd, 5 min scalp macd, 5 min scalp macd, 5 min scalp macd, 5 min scalp macd, 5 min scalp macd, 5 min scalp macd, 5 min scalp macd

Combo Backtest 123 Reversal & MACD Crossover with Trail and Stop
This is a modification of @HPotter "Combo Backtest 123 Reversal & MACD Crossover" script.
I've added a trail stop, basic leverage simulation and stop loss.
Below is HPotter's explanation of the script principals.
First strategy
This System was created from the Book "How I Tripled My Money In The
Futures Market" by Ulf Jensen, Page 183. This is reverse type of strategies.
The strategy buys at market, if close price is higher than the previous close
during 2 days and the meaning of 9-days Stochastic Slow Oscillator is lower than 50.
The strategy sells at market, if close price is lower than the previous close price
during 2 days and the meaning of 9-days Stochastic Fast Oscillator is higher than 50.
Second strategy
MACD – Moving Average Convergence Divergence. The MACD is calculated
by subtracting a 26-day moving average of a security's price from a
12-day moving average of its price. The result is an indicator that
oscillates above and below zero. When the MACD is above zero, it means
the 12-day moving average is higher than the 26-day moving average.
This is bullish as it shows that current expectations (i.e., the 12-day
moving average) are more bullish than previous expectations (i.e., the
26-day average). This implies a bullish , or upward, shift in the supply/demand
lines. When the MACD falls below zero, it means that the 12-day moving average
is less than the 26-day moving average, implying a bearish shift in the
supply/demand lines.
A 9-day moving average of the MACD (not of the security's price) is usually
plotted on top of the MACD indicator. This line is referred to as the "signal"
line. The signal line anticipates the convergence of the two moving averages
(i.e., the movement of the MACD toward the zero line).
Let's consider the rational behind this technique. The MACD is the difference
between two moving averages of price. When the shorter-term moving average rises
above the longer-term moving average (i.e., the MACD rises above zero), it means
that investor expectations are becoming more bullish (i.e., there has been an
upward shift in the supply/demand lines). By plotting a 9-day moving average of
the MACD , we can see the changing of expectations (i.e., the shifting of the
supply/demand lines) as they occur.
WARNING:
- For purpose educate only
- This script to change bars colors.

G-MACD ColorIt's just MACD and fill the color
How to use
RED : MACD < Signal line and MACD < 0
Blue : MACD > Signal line and MACD < 0
GREEN : MACD > Signal liine and MACD > 0
Yellow : MACD < Signal line and MACD < 0
Goodluck :D

SMACD - Standardised MACDStandardised MACD - this uses the MACD indicator, but expressed as a percentage of Close price. This allows for the relative comparison between stocks which have different absolute values. MACD will give a high value to a high priced stock, whereas SMACD will represent stock performance in a standardised format, relative to the closing price of the stock. It effect it represents the MACD as a percentage of share price. An added advantage of SMACD over MACD is that since the indicator is relative to the price, later values are not inflated (assuming rising trend). Thus the scale is not linear, rather it more like a log scale, offering a truer picture of growth over time. It is for this reason the SMACD lines may slightly differ from MACD, but it is a more valid representation in my view. The difference is minor. (Developed by Des Bleakley - Melbourne)

BTC Scalping 3m | Supertrend + MACD Squeeze (NY) [v6 FINAL]BTC 3-Minute Scalping Strategy
Supertrend Bias + MACD Squeeze (New York Session)
This is a fully mechanical BTC scalping strategy designed to capture short momentum bursts that occur when volatility expands in the direction of the higher-timeframe trend.
The strategy combines trend confirmation, volatility compression/expansion, and strict session filtering to reduce noise and improve consistency.
How It Works
Trend Bias
Uses a 15-minute Supertrend to define market direction.
Trades are taken only in the direction of the higher-timeframe trend.
Counter-trend signals are ignored.
Timing & Entry
Executes on the 3-minute chart.
Waits for volatility compression using a LazyBear-style MACD Squeeze.
Enters only when the squeeze releases and momentum turns positive.
Entry occurs on candle close above the execution-timeframe Supertrend.
Session Filter
Trades only during the New York session (13:00–21:00 UTC).
This avoids low-liquidity periods and reduces false breakouts.
Risk & Exits
Dynamic stop-loss placed at the execution-timeframe Supertrend.
Risk is calculated using the actual filled entry price for accurate R-based exits.
Primary profit target is 0.5R, optimized for scalping.
Positions are exited immediately if:
Price closes against Supertrend
Supertrend flips direction
Momentum (MACD histogram) turns negative
Trades are typically short-lived (1–3 candles), keeping exposure minimal.
Key Characteristics
Non-repainting logic
Fully rule-based (no discretion)
High win-rate, low-RR scalping profile
Designed for BTC futures/perpetuals
Optimized for New York session volatility
Usage Notes
Run on BTC 3-minute charts
Best results during active NY hours
Performance will vary by exchange, fees, and slippage
This strategy is intended for education and testing, not financial advice
Summary
This strategy focuses on trading volatility expansion aligned with trend, using Supertrend for structure and MACD Squeeze for timing. By restricting trades to high-liquidity hours and enforcing strict exits, it aims for consistent, repeatable scalps rather than large directional bets.

Waduji MACD with Timeframe This indicator will not change any setting or information for standard MACD but only display selected timeframe on MACD this will be helpful for the traders who trade purely MTF MACD

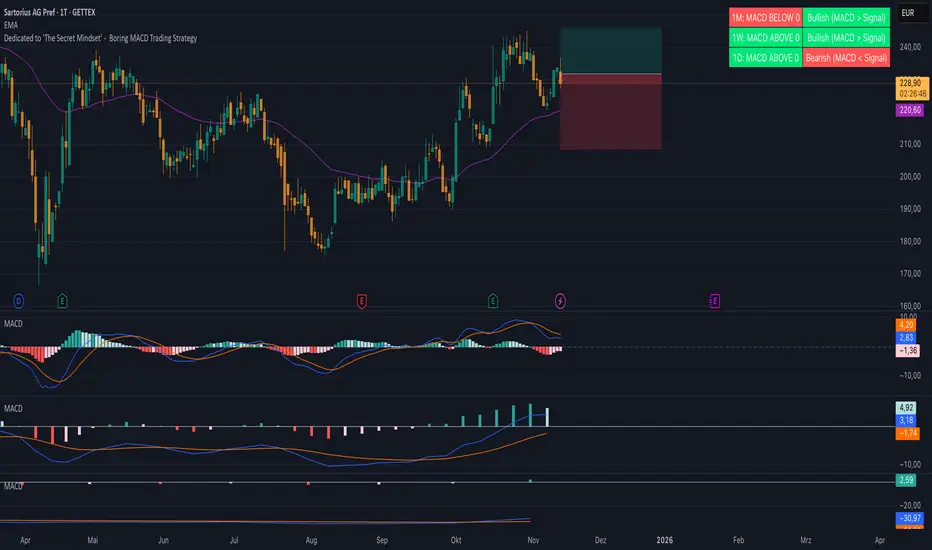
Boring MACD Trading Strategy - Dedicated to 'The Secret Mindset'This indicator displays the MACD status across three selectable timeframes, regardless of the chart timeframe you are currently viewing.
For each timeframe, it shows whether the MACD line is above or below the zero line, indicating bullish or bearish momentum.
It also shows whether the MACD line is above or below the signal line, revealing the current trend condition as bullish, bearish, or neutral.

Multi Color Normalized MACD + Candles (NMACD) [cI8DH]One simple indicator for volatility, divergence and relative momentum
Features:
- Normalized MACD (by slow MA)
- Candle MACD (fast MA length is set to 0 in candle mode, i.e. price minus slow MA)
- Multi color histogram
- Background coloring based on MACD direction
- Choice of different MA types (Exponential, Simple, Weighted, Smoothed, Triple EMA)
- Triple EMA smoothing
Benefits of normalization:
- Absolutely better than RSI for comparing across different periods and assets
Applications and benefits of candle visualization:
- Zero cross: most traders use MAs overlaid on the main chart and look for price distance and MA cross visually. In candle mode, this indicator measures the difference between price and the slow moving MA. When this indicator crosses zero, it means price is crossing the slow moving MA.
- Divergence: full candle visualization (OHLC) is not possible for most other indicators. Candle visualization allows measuring divergence between price high, low and close simultaneously. Some trades incorrectly measure divergence between high, low of price against indicator tops and bottoms while having the indicator input set to default (usually close). With this indicator, you don't need to worry about such complexities.
Recommended setting:
- Enjoy candle mode :)
- Source set to hlc3

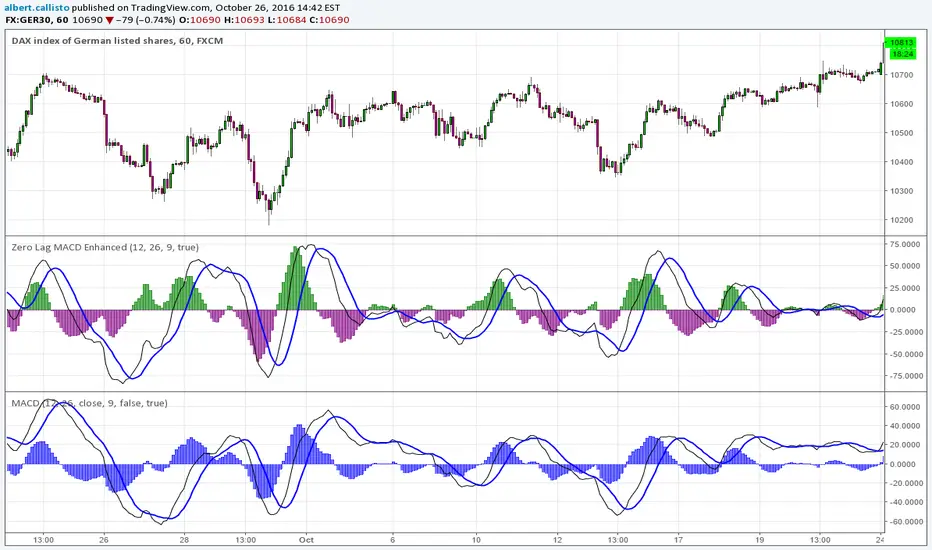
Zero Lag MACD Enhanced - Version 1.0*Zero Lag MACD indicator - Enhanced version 1.0*
Based on ZeroLag EMA - see Technical Analysis of Stocks and Commodities, April 2000
Original version by user Glaz. Thanks ! (see at the end of this description).
Tweaked by Albert Callisto
Displayed components:
Fast and slow "zero lag" moving averages
Histogram showing delta between the two moving averages
You can choose between SMA or EMA for the moving averages. They give slightly different results. Glaz had used SMA instead of EMA. Most "zero MACD" scripts are based upon EMA.
Usage is similar to the classic MACD and it can be integrated in an existing strategy, you will notice the crossing occurs earlier.
This is the original version by Glaz:
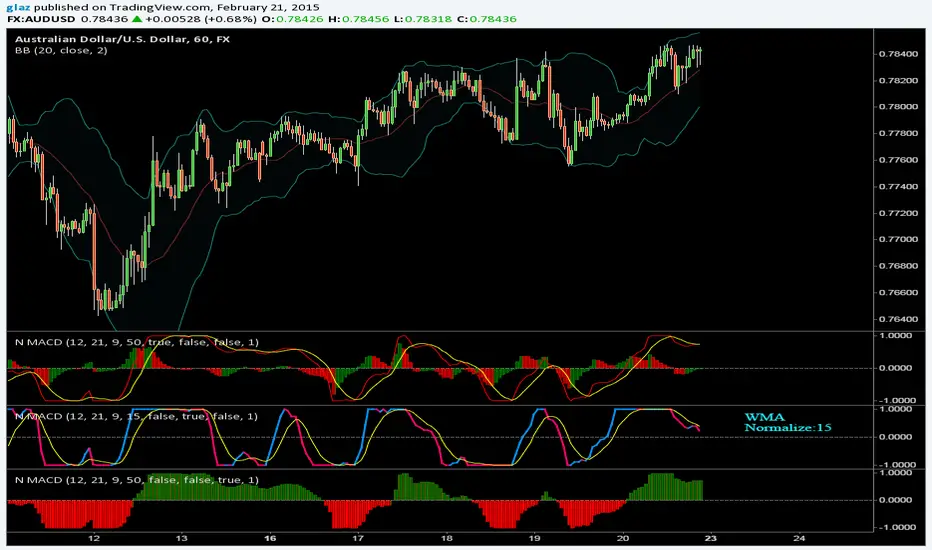
Normalized MACDNormalized MACD
There are varius options like choosing the moving average to use, sometimes i prefer the wma it is much smoother
Added also macd line to swap color and Fill that plots columns
BR Cross Swing - MACD HistRawThis strategy looks at the MACD Relationship through the same logic but mainly focuses on breaking things down and the application on raw values.

Sharktank - MACD ExtendedThe MACD, but with added features. Features are:
* Different color schemes.
* Change between different MA types (EMA and SMA) for both the oscillator and the signal MA.
* Show normal bearish and bullish divergence on both the oscillator and the signal MA.
* Show hidden bearish and bullish divergence on both the oscillator MA and the signal MA.
* Change line styles.

Percentage MACDPercentage MACD number range won't change with the great price change.
Convenient for log scale.
TRIX MACDAn experiment using TRIX to construct a MACD instead of the standard EMAs.
Warning - colors bars (can be disabled in settings)
Optional volume weighting.
-----------------------------------------------------------------------------------
If you find it useful please consider a tip/donation : BTC - 3BMEXEDyWJ58eXUEALYPadbn1wwWKmf6sA
Multicolor MACD 12 & 26 periodIf you're tired of the single colored MACD indicator on TradingView, this is a good alternative. Setup with the same 12 & 26 day periods but has clear green/red histogram.
Riz Coloured MACD - StudyThis is a souped up common or garden MACD . The Histogram is coloured giving a clear visual representation of where we are UpTicking or DownTicking on the Histogram to help support trading decisions.
When colour changes from pink to green market is bullish , and visa versa.
Very useful as a supporting indicator to confirm other strategies, or even as a standalone strategy to some extent.
Backtesting of strategy is enabled by converting script from a Study to a strategy, see comments in code. This version focuses on this indicators use as a day to day study rather than a useful strategy for automated trading.
