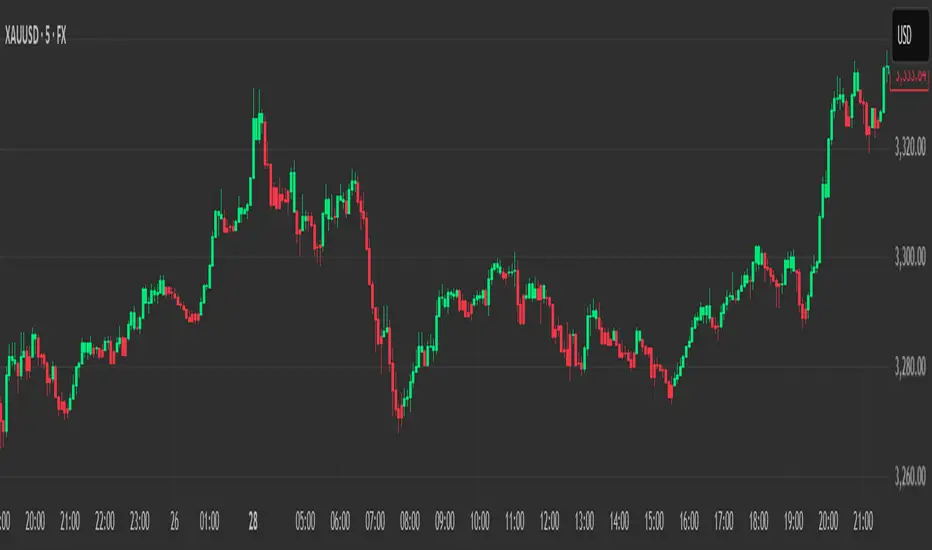
OHLC-Tables New FeatureHello All,
The command shows the opening-high-low-closing-change values of that day based on the previous value in each period.
You can set the clock in any time zone you want.
You can use the indicator by adapting it wherever you want on your screen. You can adjust its position. Top-Left-Middle Left- Bottom Left/ Top Right-Middle Right- Bottom Right.
Although it is not a command with a Buy-Sell indicator, its user-friendliness and convenience were taken into account while developing it.
The purpose of the indicator is to allow you to consider the values while focusing not only on the chart you are watching.
Поиск скриптов по запросу "OHLC"


$0 Monthly Weekly & Daily OHLC Viewer
Visualizer of current or previous month(s), week(s) & days ranges
Purpose: View last Monthly, Weekly, Daily, and/or a custom time interval OHLC, i.e. previously closed/confirmed or the ongoing higher time interval ranges
Main configurations available:
- 2 main reporting modes: View the current/ongoing M/W/D candles' OHLC (live, repaints) or report OHLC of last closed ones, i.e. previous Montly, Weekly and/or Daily
- View only latest Monthly, Weekly and/or Daily OHLC (lines) or all past ones (~channel)
- Set your own time interval for its price range(s) to be reported, e.g. last quarter '3M', 12H '720', or hide it
- View one specific day of the week OHLC reported all over the week
Graphic/visual configuration:
- Show the High & Low levels or not
- Show the Open & close levels or not
- Display a background color between top & down or lines only
- Change the background color depending if is/was rising or falling price
- Highlight the top & down breaches of higher timeframe resolution candles: Daily breaching last Weekly range, and/or the Weekly the Monthly one
- Colors & styling can be edited from the indicator's styling configuration panel
Depending on its expected usage, those configurations enable to:
- Consider previously closed candles OLHC as reference top & down ranges (support & resistance, breaches)
- Review chart's current candles evolution within their higher time interval / candle (M/W/D)
- Consider specific week days' range as a reference for the week trend
- Have a general overview of the market evolution trends
Default config is to view current candles evolving within their higher time interval / candle, while reporting last previously closed M+W is a preferred usage. Play with the config settings to find your setup.
View ongoing M+W+D OHLC with dynamic background color:
View previously closed M+W+D OHLC:
View closed H&L for M+W+D, latest only:
View Mondays' OHLC:
Feedback & support welcome.

Previous Key Levels (fadi)Previous Key Levels indicator is a highly configurable OHLC levels tool designed to provide traders with the ability to plot multiple levels while minimizing screen clutter. This indicator is perfect for those who want to monitor various timeframes simultaneously without overloading their charts with unnecessary information.
How to Use It
This indicator offers traders the flexibility to track up to 6 higher timeframes (HTFs) and multiple candles for each timeframe. For example, a trader can choose to monitor the OHLC of the last four 4-hour candles, providing a comprehensive view of significant price levels over different periods.
Key Features
Highly Configurable: Customize the number of timeframes and candles to suit your trading strategy.
Minimal Screen Clutter: Efficiently plot multiple levels without overwhelming your chart.
Flexible Application: Ideal for identifying support and resistance levels, liquidity sweeps, target levels, and more, adapting to various trading styles.
Traders have diverse trading styles and preferences. Some may use these levels to identify support and resistance zones, while others might look for liquidity sweeps or set target levels. By offering a high degree of customization, the Previous Key Levels indicator caters to the unique needs of individual traders, helping them make informed decisions based on historical price action across multiple timeframes.
Timeframe Settings
Toggle to track 6 HTF settings and the number of candles to track for each.
Limit to next HTFs only can be used to limit the HTF levels displayed based on the current timeframe.
Hide Above will disable the indicator above the specified interval.
Offset to Left and Right are used to specify where the level line starts and ends based on the current candle.
Offset between HTFs extends HTF levels to become more readable.
HTF Settings
Choice of the OHLC levels to track.
Specify the color, line style, and line width for each level.
Mark the start of that level, for example, draw a vertical line where the 4H candle has started.
Trace back to draw optional lines to track back to the origin of the level.
Label Settings
Highly configurable labels that allow traders to customize the labels to their liking.
Label color, background, and size.
Customize using up to 9 configurable parts.
Fading Levels
To prevent clutter, the indicator offers the option to change the transparency of the levels based on their distance from the current price. The distance is calculated based on a configurable Average True Range (ATR).
Change Transparency to a percentage of its current color.
Range should be within X candles will fade any level that is X candles length away from the current price.
ATR length used in calculation will calculate the average size of candles in the calculation.

PineVersatilitiesBundleLibrary "PineVersatilitiesBundle"
Versatilities (aka, Versatile Utilities) Pack includes:
- Eighteen Price Variants bundled in a Map,
- Nine Smoothing Variants bundled in a Map,
- Visualisations that indicate on both - pane and chart.
price_variants(lb)
Computes Several different averages using current and previous OHLC values
Parameters:
lb (int) : - lookback distance for combining OHLC values from the past with the present
Returns: Map of Eighteen Uncommon Combinations of single and two-bar OHLC averages (rounded-to-mintick)
dynamic_MA(masrc, malen, lsmaoff, almasgm, almaoff, almaflr)
Dynamically computes Eight different MAs and returns a Map containing Nine MAs
Parameters:
masrc (float) : source series to compute MA
malen (simple int) : lookback distance for MA
lsmaoff (simple int) : optional LSMA offset - default is 0
almasgm (simple float) : optional ALMA sigma - default is 5
almaoff (simple float) : optional ALMA offset - default is 0.5
almaflr (simple bool) : optional ALMA floor flag - default is false
Returns: Map of MAs - 'ALMA', 'EMA', 'HMA', 'LSMA', 'RMA', 'SMA', 'SWMA', 'WMA', 'ALL' (rounded-to-mintick)

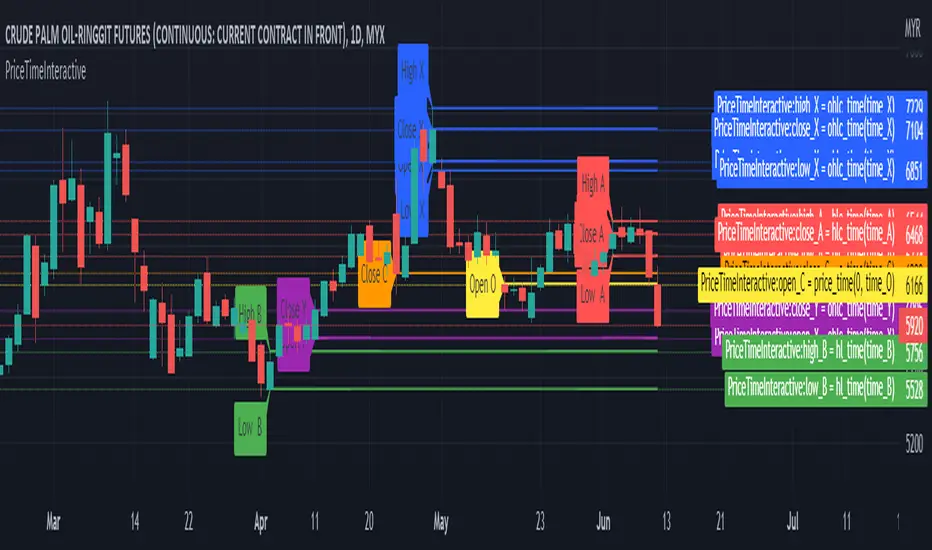
PriceTimeInteractive█ OVERVIEW
This library was intended to Get price of given time.input
█ CREDITS
Credits to TradingView for CAGR Custom Range.
█ FUNCTIONS
ohlc_time()
: Get OHLC price of given time.input
Parameters:
: : Time (t) must be using time.input
Returns: : OHLC
hlc_time()
: Get HLC price of given time.input
Parameters:
: : Time (t) must be using time.input
Returns: : HLC
hl_time()
: Get HL price of given time.input
Parameters:
: : Time (t) must be using time.input
Returns: : HL
BEST Supertrend MAHello traders,
That one is an experiment
I was curious to see what a supertrend based on moving average cross could give
How does it work?
Bull event: fast moving average crossing over the slow moving average
Bear event: fast moving average crossing under the slow moving average
When the event is triggered, the script will plot the Supertrend as follow
UP Trend = ohlc4+ ATR * Factor
DOWN Trend = ohlc4- ATR * Factor
Interesting to see the results given by ohlc4 vs hl2 and hl3
Documentation: www.tradingview.com
This is an alternative of the classical Supertrend based on candle close being above/beyond the previous Supertrend level.
Hope you'll enjoy it and it will improve your trading making you a better trader
Dave

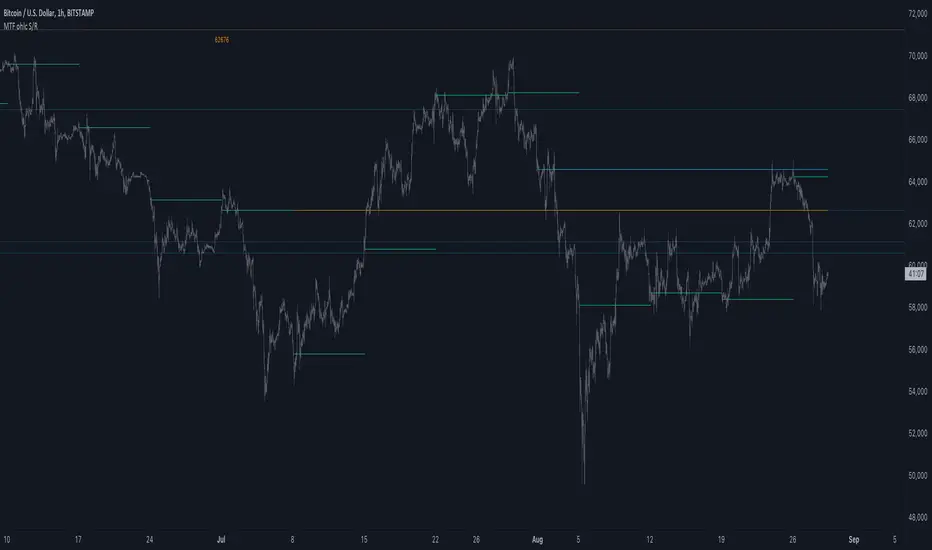
MTF ohlc S/RA very simple idea, a close (or high, low, ohlc4 or open) from a higher Time Frame
will give future Support/Resistance area's
In this example of BTC/USD we see:
- Yearly close 2017 gave Resistance in June 2019
- Yearly close 2018 gave Support in March 2020
We are now pushing to the Resistance of Yearly close 2019...
Since there is a limit for the amount of lines (since it is just too much if everything is plotted)
there are different options:
- 4 different Time Frames, each can be enabled/disabled,
- TF can be chosen,
- source can be changed (close, open, high, low, ohlc4)
- Period can be changed, for example TF Month:
You can choose just to show a particular year, Month,...
You also can choose between which prices you want to see lines,
for example Monthly close, since the beginning till now, but only between $6000 - $8000:
This helps to know the closest S/R around the present price
Other example:
- Lines can be extended to the right, or not
- Labels can be enabled/disabled:
- Linewidth and brightness of the line can be changed, also the style (solid, dashed or dotted line)
Default only 2 very high TF's are enabled (3 Month = one quarter, and 1 Year)
The 3 Month has a dotted line, which helps distinguish the line against the yearly line
- Prices above 1000 are rounded since it seems distracting to see for example 6478,878654,
seems better just to see 6479, prices below 1000 are just seen as intended
Have fun!
Test OHLCV LibraryThis indicator, "Test OHLCV Library," serves as a practical example of how to use the OHLCVData library to fetch historical candle data from a specific timeframe (like 4H) in a way that is largely impervious to the chart's currently selected time frame.
Here's a breakdown of its purpose and how it addresses request.security limitations:
Indicator Purpose:
The main goal of this indicator is to demonstrate and verify that the OHLCVData library can reliably provide confirmed historical OHLCV data for a user-specified timeframe (e.g., 4H), and that a collection of these data points (the last 10 completed candles) remains consistent even when the user switches the chart's time frame (e.g., from 5-second to Daily).
It does this by:
Importing the OHLCVData library.
Using the library's getTimeframeData function on every bar of the chart.
Checking the isTargetBarClosed flag returned by the library to identify the exact moment a candle in the target timeframe (e.g., 4H) has closed.
When isTargetBarClosed is true, it captures the confirmed OHLCV data provided by the library for that moment and stores it in a persistent var array.
It maintains a list of the last 10 captured historical 4H candle opens in this array.
It displays these last 10 confirmed opens in a table.
It uses the isAdjustedToChartTF flag from the library to show a warning if the chart's time frame is higher than the target timeframe, indicating that the data fetched by request.security is being aligned to that higher resolution.
Circumventing request.security Limitations:
The primary limitation of request.security that this setup addresses is the challenge of getting a consistent, non-repainting collection of historical data points from a different timeframe when the chart's time frame is changed.
The Problem: Standard request.security calls, while capable of fetching data from other timeframes, align that data to the bars of the current chart. When you switch the chart's time frame, the set of chart bars changes, and the way the requested data aligns to these new bars changes. If you simply collected data on every chart bar where request.security returned a non-na value, the resulting collection would differ depending on the chart's resolution. Furthermore, using request.security without lookahead=barmerge.lookahead_off or an offset ( ) can lead to repainting on historical bars, where values change as the script recalculates.
How the Library/Indicator Setup Helps:
Confirmed Data: The OHLCVData library uses lookahead=barmerge.lookahead_off and, more importantly, provides the isTargetBarClosed flag. This flag is calculated using a reliable method (checking for a change in the target timeframe's time series) that accurately identifies the precise chart bar corresponding to the completion of a candle in the target timeframe (e.g., a 4H candle), regardless of the chart's time frame.
Precise Capture: The indicator only captures and stores the OHLCV data into its var array when this isTargetBarClosed flag is true. This means it's capturing the confirmed, finalized data for the target timeframe candle at the exact moment it closes.
Persistent Storage: The var array in the indicator persists its contents across the bars of the chart's history. As the script runs through the historical bars, it selectively adds confirmed 4H candle data points to this array only when the trigger is met.
Impervious Collection: Because the array is populated based on the completion of the target timeframe candles (detected reliably by the library) rather than simply collecting data on every chart bar, the final contents of the array (the list of the last 10 confirmed 4H opens) will be the same regardless of the chart's time frame. The table then displays this static collection.
In essence, this setup doesn't change how request.security fundamentally works or aligns data to the chart's bars. Instead, it uses the capabilities of request.security (fetching data from another timeframe) and Pine Script's execution model (bar-by-bar processing, var persistence) in a specific way, guided by the library's logic, to build a historical collection of data points that represent the target timeframe's candles and are independent of the chart's display resolution.

Bursa Malaysia Index SeriesERVIEW
This indicator is intend to display Bursa Malaysia Index Series.
█ FEATURES
1. Choose available sector based on Bursa Malaysia Index.
2. Plot close or OHLC.
3. Color of Closing price plot adapt to chart background color.
4. Font size can be selected.
█ EXAMPLES / USAGES

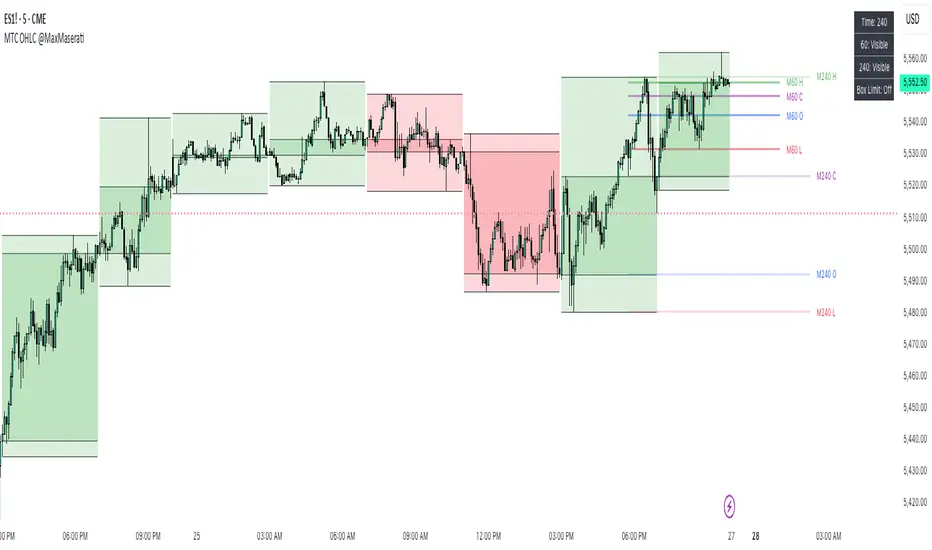
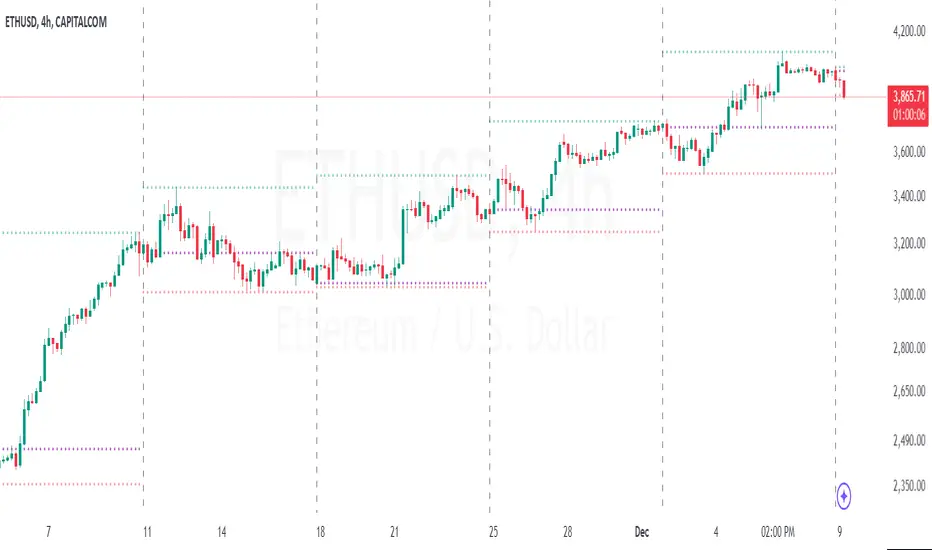
Multi TimeFrame OHLC Overlay @MaxMaseratiMulti TimeFrame OHLC Overlay @MaxMaserati
A powerful and versatile indicator that displays OHLC (Open, High, Low, Close) data across multiple timeframes with enhanced visualization features. Perfect for traders who need to analyze price action across different time periods simultaneously.
Key Features:
Customizable multi-timeframe OHLC visualization with box and line overlays
Extended OHLC lines from higher timeframes with clear labeling
Distinct bullish and bearish candle representations
Fully configurable color schemes and display options
Real-time timeframe information display
Main Components:
Multi-Timeframe Display
Primary timeframe OHLC visualization with boxes and lines
Extended timeframe overlay for broader market context
Clear visual distinction between timeframes
Customizable Visuals
Separate color settings for bullish and bearish patterns
Adjustable transparency for both body and wick components
Configurable OHLC line colors and visibility
Extended Lines Features
Higher timeframe OHLC level overlay
Custom labels with timeframe identification
Adjustable line properties and visibility
Information Display
Current timeframe indicator
Extended timeframe reference
Clean and unobtrusive interface
Settings Groups:
Extended OHLC Lines
Labels Options
Display Options
Bullish/Bearish Candle Settings
OHLC Lines Configuration
Usage Tips:
Start with the default 240-minute timeframe or adjust to your preferred interval
Use the extended lines feature to view higher timeframe levels
Customize colors and transparency to match your chart theme
Enable/disable specific components based on your analysis needs
Perfect For:
Multi-timeframe analysis
Support/Resistance identification
Price action trading
Trend following strategies
Market structure analysis
This indicator combines powerful multi-timeframe analysis capabilities with clean visualization, making it an essential tool for traders who need to maintain awareness of price action across different time periods.
Note:
For optimal performance, adjust the visual settings according to your chart's timeframe and color scheme. The indicator is designed to work seamlessly across all trading instruments and timeframes.
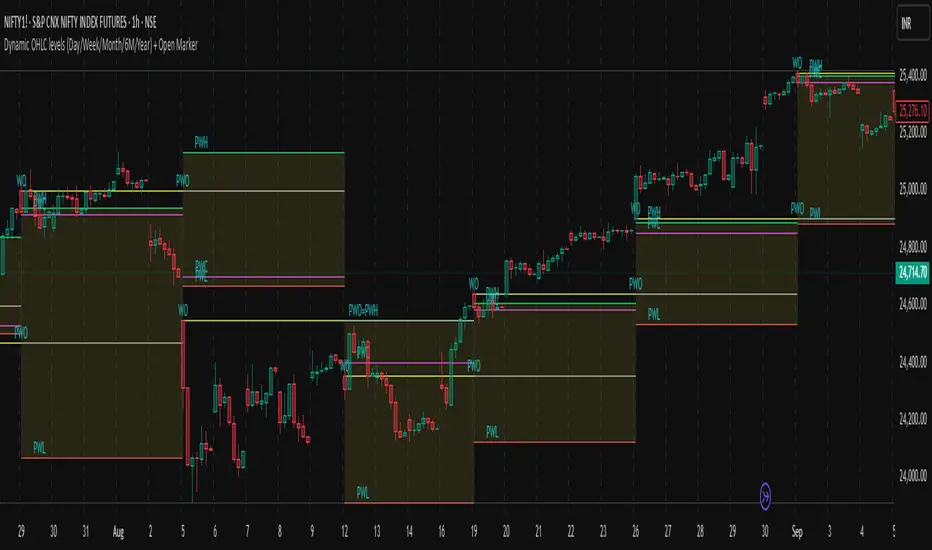
Dynamic OHLC levels(Day/Week/Month/6M/Year)+Open MarkerThis indicator automatically displays the Open, High, Low, and Close (OHLC) levels from the previous trading period directly on your chart. It's a versatile tool for identifying key support and resistance zones based on historical price action. The indicator offers a unique "Auto" mode that intelligently selects the most relevant time frame (Daily, Weekly, Monthly, 6M, or Yearly) based on your current chart's time frame. Alternatively, you can choose a specific time frame in "Manual" mode.
The indicator is designed to provide traders with clear visual cues for important price levels, helping them make more informed trading decisions. It's a valuable resource for both intraday and swing traders, as these levels often act as significant psychological barriers and turning points in the market.
Key Benefits 🎯
Identifies Key Levels Instantly: Automatically plots crucial support and resistance levels from the previous session, saving you time and effort.
Adaptable & Versatile: The "Auto" mode intelligently adjusts to your chart's time frame, ensuring you always see the most relevant OHLC levels.
Customizable: You have full control over which levels to display (High, Low, Open, Close), their colors, line styles, and thickness.
Visual Clarity: The option to highlight the area between the previous high and low provides a clear visual representation of the past session's range.
Multi-Session Support: It supports both Regular Trading Hours (RTH) and Extended Trading Hours (ETH), with a configurable timezone, making it globally applicable.
Core Features ✨
Dynamic Timeframe Selection:
Auto Mode: Automatically displays previous Day OHLC on intraday charts (e.g., 1-hour), previous Week OHLC on daily charts, and so on.
Manual Mode: Allows you to explicitly choose between previous Day, Week, Month, 6-Month, or Year OHLC levels.
Customizable Visuals:
Show Previous High: Plots the highest price of the previous period.
Show Previous Low: Plots the lowest price of the previous period.
Show Previous Open: Plots the opening price of the previous period.
Show Previous Close: Plots the closing price of the previous period.
Show Current Open Marker Line: A separate line that marks the open of the current period.
Highlight Area: Fills the space between the previous high and low with a customizable color.
Global Trading Support:
Session Mode: Choose to display levels based on Regular Trading Hours, Extended Hours, or both.
Timezone Selection: Configure the session timezone to align with major markets like New York, London, Tokyo, or Kolkata.
Line Styling: Adjust the line thickness, style (Solid, Dashed, Dotted), and transparency for each level to match your chart's aesthetics.
Labels: Toggle on/off text labels that clearly identify each plotted level (e.g., "PDH" for Previous Day High).
Who is this indicator for? 👤
This indicator is a powerful tool for a wide range of traders looking to incorporate historical price action into their analysis.
Intraday Traders: Can use the previous Daily OHLC levels to identify potential support/resistance for breakouts and reversals during the trading day.
Swing Traders: Can leverage the previous Weekly, Monthly, or Yearly OHLC levels on higher time frames to spot long-term trend continuation or reversal points.
Day Traders: Use the Previous Daily High/Low to frame the day's trading range and identify key levels for potential mean-reversion trades.
Technical Analysts: Those who rely on key levels and price action will find this indicator invaluable for their analysis.
This indicator simplifies a crucial part of technical analysis, providing a clean, customizable, and adaptive way to visualize and trade off of historical price levels.
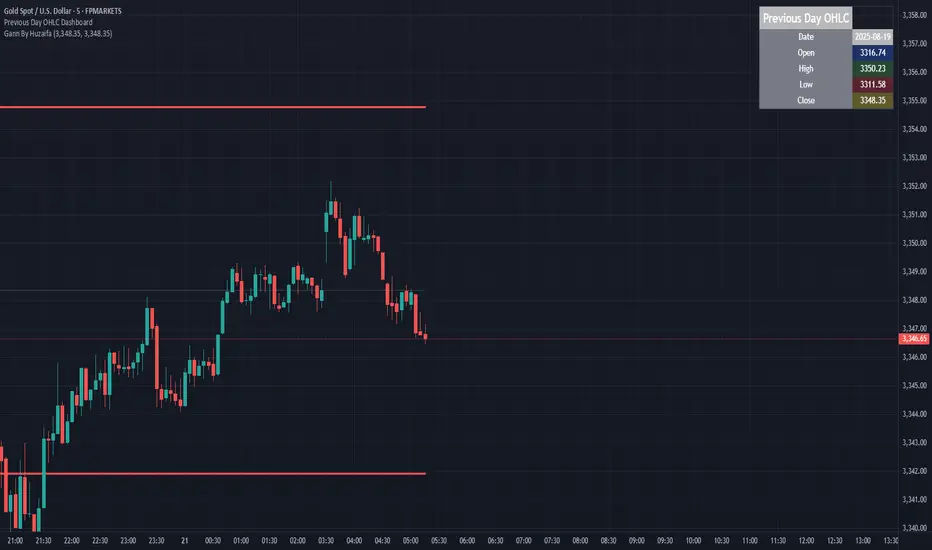
Previous Day OHLC Dashboard (Last N Days)Indicator: Previous Day OHLC Dashboard (Multi-Day)
This indicator displays a dashboard-style table on your chart that shows the Open, High, Low, and Close (OHLC) of the previous trading days. It’s designed to help traders quickly reference key daily levels that often act as important support and resistance zones.
🔑 Features:
Dashboard Table: Shows OHLC data for the last N trading days (default = 3, up to 10).
Customizable Appearance:
Change the position of the dashboard (Top-Right, Top-Left, Bottom-Right, Bottom-Left).
Adjust text size (Tiny → Huge).
Customize colors for header, labels, and each OHLC column.
Yesterday’s OHLC Lines (optional): Plots horizontal lines on the chart for the previous day’s Open, High, Low, and Close.
Intraday & Multi-Timeframe Compatible: Works on all timeframes below Daily — values update automatically from the daily chart.
📊 Use Cases:
Quickly identify yesterday’s key levels for intraday trading.
Track how current price reacts to previous day’s support/resistance.
Keep a multi-day reference for trend bias and range context.
⚙️ How it Works:
The indicator pulls daily OHLC values using request.security() with lookahead_on to ensure prior day’s values are extended across the next session.
These values are displayed in a compact table for quick reference.
Optionally, the most recent daily levels (D-1) are plotted as chart lines.
✅ Perfect for day traders, scalpers, and swing traders who rely on yesterday’s price action to plan today’s trades.
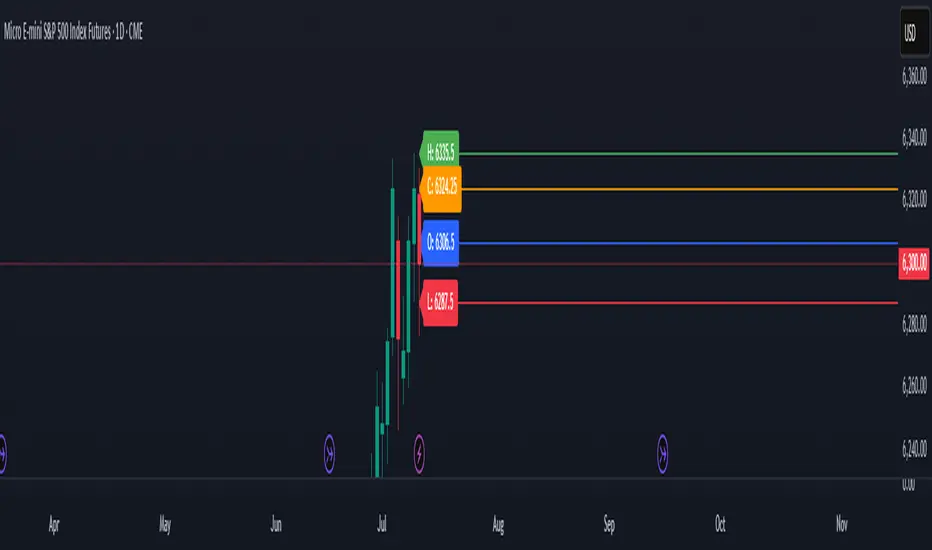
Previous Day OHLC# Previous Day OHLC Levels Indicator
## Overview
The Previous Day OHLC indicator is a simple yet powerful tool that plots the Open, High, Low, and Close levels from previous trading sessions. This indicator helps traders identify key support and resistance levels based on historical price action, making it easier to spot potential reversal zones and breakout levels.
## Key Features
### 📊 **Previous Day OHLC Levels**
- Displays the Open, High, Low, and Close prices from 1-5 days ago
- Lines automatically extend to the right for easy visualization
- Updates daily to show the most relevant levels
### 🎨 **Fully Customizable Styling**
- **Individual Line Colors**: Choose unique colors for each OHLC level
- **Line Styles**: Select from Solid, Dashed, or Dotted lines for each level
- **Line Width**: Adjust thickness from 1-4 pixels for better visibility
- **Price Labels**: Display actual price values on each line with customizable sizing
### ⚙️ **Flexible Settings**
- **Lookback Period**: Choose to display levels from 1-5 days ago (maximum safety limit)
- **Label Control**: Toggle price labels on/off and adjust their size
- **Performance Optimized**: Clean code that won't slow down your charts
## How to Use
1. **Add to Chart**: Apply the indicator to any timeframe chart
2. **Customize Settings**: Adjust colors, styles, and lookback period to your preference
3. **Identify Levels**: Use the plotted lines as potential support/resistance zones
4. **Trade Setup**: Look for price reactions at these key levels for entry/exit signals
## Best Practices
- **Day Trading**: Use 1-day lookback for intraday support/resistance
- **Swing Trading**: Extend lookback to 2-5 days for broader context
- **Multi-Timeframe**: Combine with other timeframe analysis for confirmation
- **Risk Management**: Use these levels for stop-loss and take-profit placement
## Color Coding (Default)
- **Open**: Blue - Starting price of the previous session
- **High**: Green - Highest price reached
- **Low**: Red - Lowest price reached
- **Close**: Orange - Final price of the session
## Why This Indicator Works
Previous day OHLC levels are among the most watched price points by professional traders. These levels often act as:
- **Support/Resistance**: Price tends to react at these historical levels
- **Breakout Confirmation**: Strong moves beyond these levels can signal trend continuation
- **Reversal Zones**: Price often bounces from these key levels
- **Psychological Levels**: Market participants remember these important price points
## Technical Specifications
- **Pine Script Version**: v6
- **Overlay**: Yes (plots directly on price chart)
- **Performance**: Optimized for smooth chart operation
- **Compatibility**: Works on all timeframes and instruments
Perfect for traders of all experience levels who want to incorporate previous day levels into their technical analysis toolkit!
Donchian x WMA Crossover (2025 Only, Adjustable TP, Real OHLC)Short Description:
Long-only breakout system that goes long when the Donchian Low crosses up through a Weighted Moving Average, and closes when it crosses back down (with an optional take-profit), restricted to calendar year 2025. All signals use the instrument’s true OHLC data (even on Heikin-Ashi charts), start with 1 000 AUD of capital, and deploy 100 % equity per trade.
Ideal parameters configured for Temple & Webster on ASX 30 minute candles. Adjust parameter to suit however best to download candle interval data and have GPT test the pine script for optimum parameters for your trading symbol.
Detailed Description
1. Strategy Concept
This strategy captures trend-driven breakouts off the bottom of a Donchian channel. By combining the Donchian Low with a WMA filter, it aims to:
Enter when volatility compresses and price breaks above the recent Donchian Low while the longer‐term WMA confirms upward momentum.
Exit when price falls back below that same WMA (i.e. when the Donchian Low crosses back down through WMA), but only if the WMA itself has stopped rising.
Optional Take-Profit: you can specify a profit target in decimal form (e.g. 0.01 = 1 %).
2. Timeframe & Universe
In-sample period: only bars stamped between Jan 1 2025 00:00 UTC and Dec 31 2025 23:59 UTC are considered.
Any resolution (e.g. 30 m, 1 h, D, etc.) is supported—just set your preferred timeframe in the TradingView UI.
3. True-Price Execution
All indicator calculations (Donchian Low, WMA, crossover checks, take-profit) are sourced from the chart’s underlying OHLC via request.security(). This guarantees that:
You can view Heikin-Ashi or other styled candles, but your strategy will execute on the real OHLC bars.
Chart styling never suppresses or distorts your backtest results.
4. Position Sizing & Equity
Initial capital: 1 000 AUD
Size per trade: 100 % of available equity
No pyramiding: one open position at a time
5. Inputs (all exposed in the “Inputs” tab):
Input Default Description
Donchian Length 7 Number of bars to calculate the Donchian channel low
WMA Length 62 Period of the Weighted Moving Average filter
Take Profit (decimal) 0.01 Exit when price ≥ entry × (1 + take_profit_perc)
6. How It Works
Donchian Low: ta.lowest(low, DonchianLength) over the specified look-back.
WMA: ta.wma(close, WMALength) applied to true closes.
Entry: ta.crossover(DonchianLow, WMA) AND barTime ∈ 2025.
Exit:
Cross-down exit: ta.crossunder(DonchianLow, WMA) and WMA is not rising (i.e. momentum has stalled).
Take-profit exit: price ≥ entry × (1 + take_profit_perc).
Calendar exit: barTime falls outside 2025.
7. Usage Notes
After adding to your chart, open the Strategy Tester tab to review performance metrics, list of trades, equity curve, etc.
You can toggle your chart to Heikin-Ashi for visual clarity without affecting execution, thanks to the real-OHLC calls.

Heikin Ashi Colored Regular OHLC CandlesHeikin Ashi Colored Regular OHLC Candles
In the world of trading, Heikin Ashi candles are a popular tool for smoothing out price action and identifying trends more clearly. However, Heikin Ashi candles do not reflect the actual open, high, low, and close prices of a market. They are calculated values that change the chart’s structure. This can make it harder to see precise price levels or use standard price-based tools effectively.
To get the best of both worlds, we can apply the color logic of Heikin Ashi candles to regular OHLC candles. This means we keep the true market data, but show the trend visually in the same smooth way Heikin Ashi candles do.
Why use this approach
Heikin Ashi color logic filters out noise and helps provide a clearer view of the current trend direction. Since we are still plotting real OHLC candles, we do not lose important price information such as actual highs, lows, or closing prices. This method offers a hybrid view that combines the accuracy of real price levels with the visual benefits of Heikin Ashi trend coloring. It also helps maintain visual consistency for traders who are used to Heikin Ashi signals but want to see real price action.
Advantages for scalping
Scalping requires fast decisions. Even small price noise can lead to hesitation or bad entries. Coloring regular candles based on Heikin Ashi direction helps reduce that noise and makes short-term trends easier to read. It allows for faster confirmation of momentum without switching away from real prices. Since the candles are not modified, scalpers can still place tight stop-losses and targets based on actual price structure. This approach also avoids clutter, keeping the chart clean and focused.
How it works
We calculate the Heikin Ashi values in the background. If the Heikin Ashi close is higher than the Heikin Ashi open, the trend is considered bullish and the candle is colored green. If the close is lower than the open, it is bearish and the candle is red. If they are equal, the candle is gray or neutral. We then use these colors to paint the real OHLC candles, which are unchanged in shape or position.
Period Separator & Candle OHLCThis script combines two powerful tools for traders: period separators and custom timeframe-based OHLC (Open, High, Low, Close) data visualization. Here's what it does:
Period Separators:
The script draws vertical lines to indicate the start of new time periods based on a user-defined timeframe (e.g., hourly, daily, weekly).
Users can customize the separator color, line style (solid, dashed, dotted), and width to suit their preferences.
Fetches OHLC data from a higher or custom timeframe (e.g., 4 hours) and overlays it on the current chart.
Users can choose to display the open, high, low, and close prices as dots or circles for easy visualization.
Optionally, the open and close dots can be visually connected with a filled bar for a candlestick-like effect.
The script color-codes the close price relative to the open (green if higher, red if lower) to highlight price direction at a glance.
Fully Customizable:
Users have full control over which OHLC values to display and whether the dots should be filled.
Transparency settings for plotted dots and fills are also adjustable for optimal visibility on different chart styles.
How It Is Useful for Trading:
Timeframe Analysis:
The period separators make it easy to distinguish trading activity across custom time intervals. This is crucial for intraday, swing, and long-term traders who analyze price movements within specific periods.
Multi-Timeframe Insights:
By overlaying OHLC data from a higher timeframe on a lower timeframe chart, traders can identify key support and resistance levels, pivots, and trends that are not immediately visible on the current timeframe.
Trend Recognition:
The color-coded close dots (green for bullish, red for bearish) provide an instant visual cue of market sentiment, helping traders confirm or refute their bias.
Whether you're a scalper, day trader, or position trader, the flexibility in timeframe selection, styling, and data presentation ensures this tool can adapt to your trading strategy.
Support, Resistance & OHLCUPDATE:
This Pine Script code is an indicator for TradingView that displays support, resistance, and OHLC (Open, High, Low, Close) data across various timeframes. The code is divided into two main sections: Support/Resistance and OHLC Data.
Support and Resistance:
Logic for Support and Resistance: The indicator draws support and resistance lines after 4 consecutive candles without forming new lows (for support) or new highs (for resistance). This means that a support or resistance level is created after 4 candles that don't set new extremes.
Support: When the last 3 candles have lower lows, and the current candle forms a higher low, the support level is set.
Resistance: When the last 3 candles have higher highs, and the current candle forms a lower high, the resistance level is set.
Drawing the Lines and Labels:
Once the support or resistance level is determined, a horizontal line is drawn that extends left and right from the candle.
Additionally, labels for support and resistance are shown if the corresponding settings are enabled. These labels appear at a distance from the line and display the current support or resistance value.
Deleting the Lines:
If the price falls below the support level or rises above the resistance level, the respective line is deleted. This means that the market has breached the support or resistance level, making the line invalid.
When the support or resistance line is breached, alerts can be triggered to notify the trader.
Alerts:
The script provides options to set alerts when a support or resistance line is created or broken. These alerts notify the trader when the price reaches an important level.
OHLC Data:
The code allows the display of the high, low, close, and open values of the last candles across different timeframes (hourly, daily, weekly, monthly).
Settings:
Options are available to show these values for the respective timeframes.
The user can also adjust the size of the labels.
Visualization: The indicator plots lines for the high, low, and close values for each timeframe and places labels showing the respective values.
In summary, the indicator provides a detailed view of support and resistance levels, which are based on a 4-candle logic, and displays important OHLC values across different timeframes. The indicator also allows setting alerts for specific price levels, so traders can quickly react to market movements.

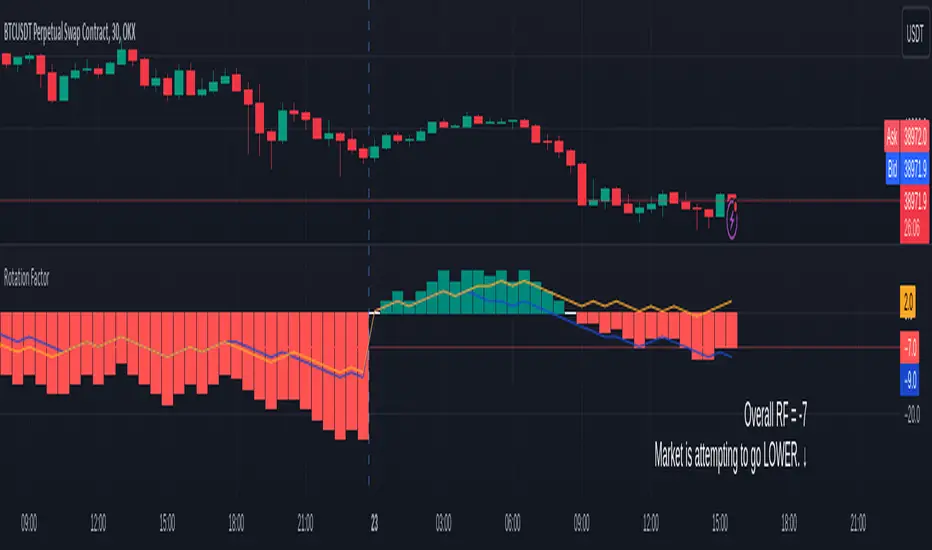
Rotation Factor for TPO and OHLC (Plot)The Rotation Factor objectively measures attempted market direction(or market sentiment) for a given period. It records the cumulative directional attempts of auction rotations within a given period, thus, helping traders determine which way the market is trying to go and which market participant is exerting greater control or influence.
Theory
The premise is that a greater number of bars auctioning higher contrasted to bars auctioning lower indicates that buyers are exerting greater control over price within the given period(usually daily). In this case, the market is attempting to go higher (Market is Bullish). The same is true for a greater number of bars auctioning lower than higher, which, in this case, indicates that the sellers are exerting greater control over price within the given period and that the market is attempting to go lower (Market is Bearish).
Calculation
Each bar is individually measured in relation to the immediate previous bar, and calculations are reset at the beginning of each period.
For every bar, two variables are utilised: One for the highs and another for the lows. During bar start, these variables are initiated at 0.
As the period progresses, these variables are set accordingly: If the high of the current bar is higher than that of the previous bar, then the bar's highs variable is assigned a "+1". If the opposite is true, it is given a "-1". Finally, if both bar highs are equal, it is, instead, assigned a "0". The same is true for the lows: if the low of the current bar is higher than that of the previous low, then the bar's lows variable is assigned a "+1". Similarly, the opposite is given a "-1", while equal lows causes it to be assigned a "0". All highs and lows are then summed together resulting to a total, which becomes the Rotational Factor.
Presentation
Furthermore, this Rotation Factor Indicator is presented as a plot, which, unlike its classic variation, shows you how the rotation factor is developing. It also includes lines indicating the Top Rotation Factor and the Bottom Rotation Factor individually, the better to observe the developing auction.
Link to the Classic Variation:
Features
1. Customisable Tick Size/Granularity : The calculation tick size/ granularity is customisable which can be accessed through the indicator settings.
2. Customisable Labels and Lines : The colour and sizes used by the labels and lines are customisable the better for accessibility.
3. Period Separator : A separator is rendered to represent period borders (start and end). If separators are already present on your chart, you can remove them from the indicator settings.
4. Individual Top Rotation Factor and Bottom Rotation Factor plots : These two parts which becomes of the Rotation Factor are also presented individually, on their own plots, the better to observe the developing auction.
Works for both split Market Profile(TPO) charts and regular OHLC bars/candle charts
The Rotation Factor is usually used with a Split Market Profile (TPO). However, if no such tool is available, you will still be able to benefit from the Rotation Factor as the price ranges of Split Market Profiles and OHLC bars/candles are one and the same. In such cases, it is recommended that you set your chart to use a 30 minute timeframe and the indicator's period to "daily" to simulate a Split Market Profile.
Note :
The Rotation Factor is, to quote, "by no means not an all-conclusive indication of future market direction.". It only helps determine which way the market is trying to go by objectively measuring the market's directional attempts.
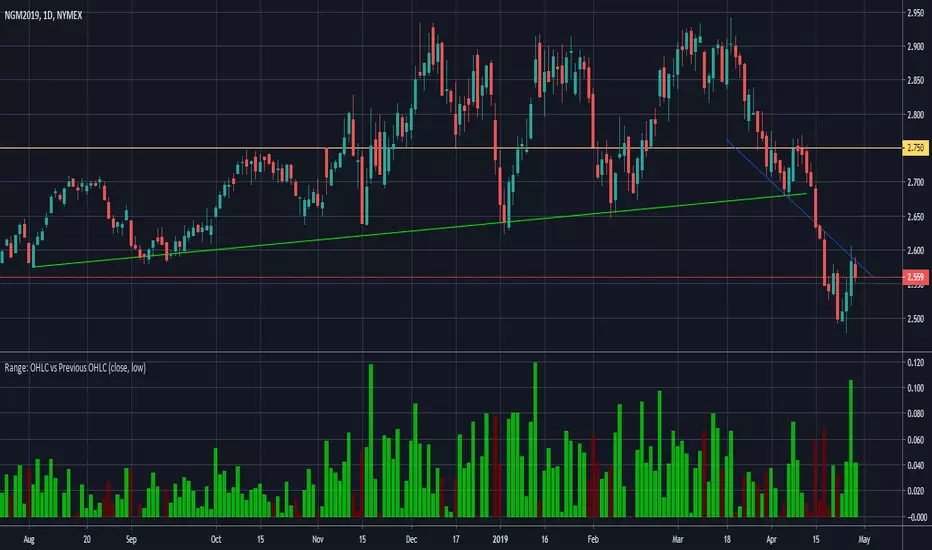
Range: OHLC vs Previous OHLC - Version 2Version 1 here -
This is essentially the same as version 1 with one update. You have the freedom to independently choose OHLC for current candle and prior candle.
To elaborate further, Version 1 had 1 choice. For example, Close; you could only compare the close of prior candle to the current candle.
Version 2; you can compare close of the current candle to the low of the prior candle.
Previous 5 Days OHLC + Dates + PricesTitle: Previous 5 Days OHLC Levels (Extended Lines + Labels)
Description:
This indicator automatically plots the Open, High, Low, and Close (OHLC) levels for the previous 5 trading days. Unlike standard daily separators, this tool extends the lines from their historical origin all the way to the current price bar, allowing traders to instantly see how current price action interacts with recent support and resistance levels.
Key Features:
5-Day Lookback: Automatically fetches and plots OHLC data for the last 5 trading sessions.
Extended Lines: Lines extend to the current bar (Right) to visualize immediate Support/Resistance zones.
Smart Labels: Each line is marked with the Day Name, Date, Type (O/H/L/C), and the Exact Price.
Customizable Positioning: Choose to display labels on the Left (start of the day) or the Right (next to current price) to keep your chart clean.
Toggle Visibility: Individually turn on/off Opens, Closes, Highs, or Lows to focus on the data that matters to your strategy.
How to Use:
Trend Analysis: Use previous Highs and Lows to identify potential breakout or breakdown levels.
Range Trading: Identify where price previously opened or closed to find intraday pivots.
Clean Charting: Use the settings to hide labels or specific lines (e.g., hide Opens/Closes to see only the Daily Range).
Settings:
Label Position: Switch between "Left" (historical origin) and "Right" (current price).
Visibility: Checkboxes to show/hide Open, High, Low, Close, and Text Labels.
Style: Fully customizable colors for each level type.
Technical Note: This script is optimized for performance (Pine Script v6). It uses array management and executes drawing logic only on the last bar to minimize resource usage while maintaining real-time accuracy.

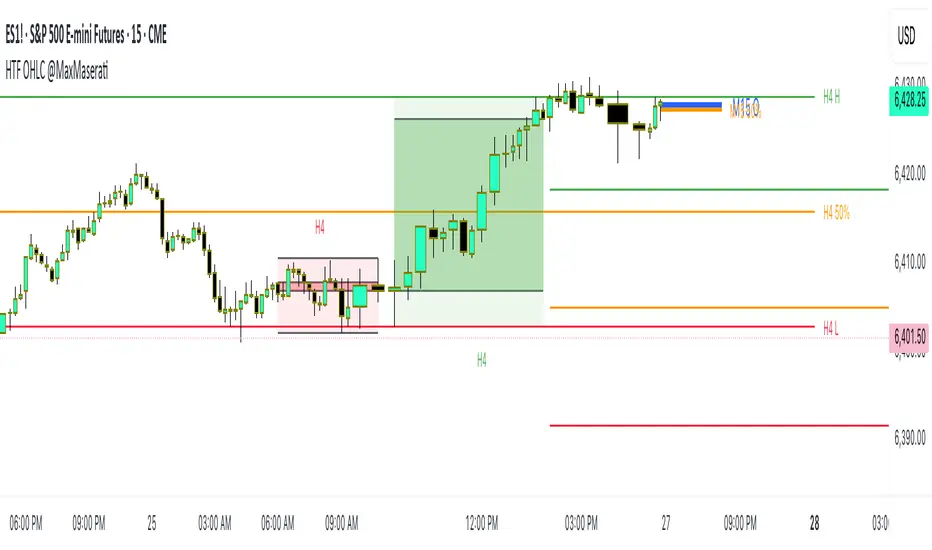
HTF OHLC Candle + 50% @MaxMaseratiHTF OHLC Candle + 50% @MaxMaserati
This advanced multi-timeframe indicator displays higher timeframe OHLC data as visual candle boxes and extended key levels on lower timeframe charts, providing essential context for institutional trading decisions.
Core Functionality:
Multi-Timeframe Box Display:
Main Timeframe Box (Default H4): Shows complete higher timeframe candles as colored boxes with separate body and wick visualization, including bullish (green) and bearish (red) candle representation with customizable transparency levels.
Independent Box 2 (Default M15): Secondary timeframe display with lime/fuchsia color scheme, allowing traders to monitor intermediate timeframes simultaneously with different visual styling.
Independent Box 3 (Default H1): Third independent timeframe with blue/orange color scheme, providing additional context for multi-timeframe analysis and confluence identification.
OHLC Level Analysis:
Each timeframe box includes individual Open, High, Low, and Close level lines with customizable colors and visibility settings. These levels act as key support and resistance zones that institutional traders often respect.
50% Retracement Levels:
Automatic calculation and display of 50% levels between each timeframe's high and low, representing critical equilibrium zones where price often finds support or resistance during retracements.
Extended Line System:
Current Live Timeframe Extended Lines: Real-time extension of the forming candle's Open, High, Low, and 50% levels with customizable line weights and label positioning.
TF2 Extended Lines (Default H4): Previous completed candle's key levels extended forward, showing immediate higher timeframe reference points for current price action.
TF3 Extended Lines (Default Daily): Longer-term reference levels from daily or weekly timeframes, providing macro trend context and major institutional levels.
Key Features:
Smart Timeframe Detection: Only displays boxes for timeframes higher than the current chart timeframe, preventing redundant information and maintaining chart clarity.
Global Box Limit Control: Intelligent cleanup system that maintains optimal performance by limiting total displayed elements while preserving the most recent and relevant timeframe periods.
Comprehensive Customization: Full control over colors, transparency, line weights, label sizes, and visibility for each timeframe component, allowing personalized setups for different trading styles.
Label System: Automatic timeframe identification labels (H4, M15, D1, etc.) positioned on each box for instant timeframe recognition and clear multi-timeframe organization.
Current Candle Options: Optional display of forming/current candles for each timeframe, enabling real-time monitoring of developing price action and potential setup completion.
This indicator is essential for traders utilizing multi-timeframe analysis, institutional trading concepts, and higher timeframe confluence strategies, providing clear visual representation of key levels and candle structures that drive major market movements.