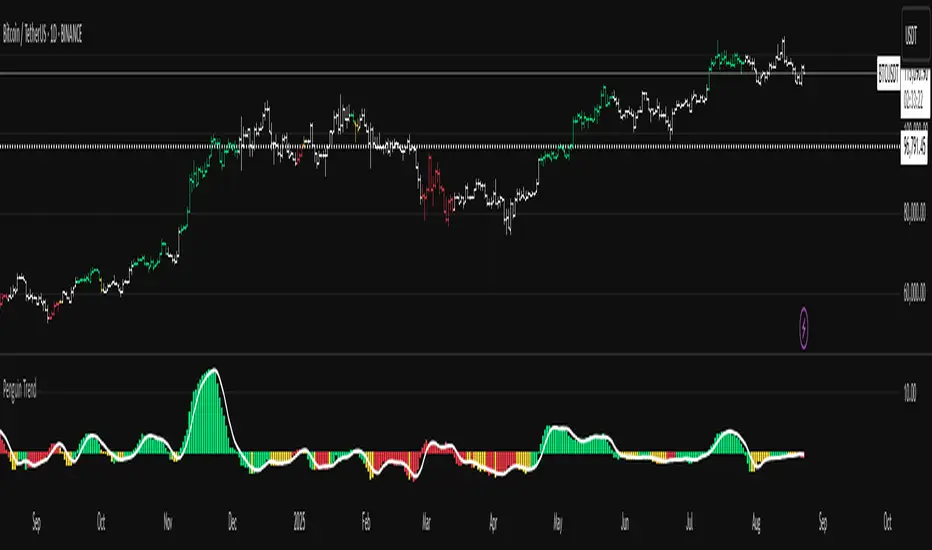
Penguin TrendMeasures the volatility regime by comparing the upper Bollinger Band to the upper Keltner Channel and colors bars with a lightweight trend state. Supports SMA/EMA/WMA/RMA/HMA/VWMA/VWAP and a selectable calculation timeframe. Default settings preserve the original look and behavior.
Penguin Trend visualizes expansion vs. compression in price action by comparing two classic volatility envelopes. It computes:
Diff% = (UpperBB − UpperKC) / UpperKC × 100
* Diff > 0: Bollinger Bands are wider than Keltner Channels -> expansion / momentum regime.
* Diff < 0: BB narrower than KC -> compression / squeeze regime.
A white “Average Difference” line smooths Diff% (default: SMA(5)) to help spot regime shifts.
Trend coloring (kept from original):
Bars are colored only when Diff > 0 to emphasize expansion phases. A lightweight trend engine defines four states using a fast/slow MA bias and a short “thrust” MA applied to ohlc4:
* Green: Bullish bias and thrust > fast MA (healthy upside thrust).
* Red: Bearish bias and thrust < fast MA (healthy downside thrust).
* Yellow: Bullish bias but thrust ≤ fast MA (pullback/weakness).
* Blue: Bearish bias but thrust ≥ fast MA (bear rally/short squeeze).
Note: By default, Blue renders as Yellow to preserve the original visual style. Enable “Use true BLUE color” if you prefer Aqua for Blue.
How it works (under the hood):
* Bollinger Bands (BB): Basis = selected MA of src (default SMA(20)). Width = StdDev × Mult (default 2.0).
* Keltner Channels (KC): Basis = selected MA of src (default SMA(20)). Width = ATR(kcATR) × Mult (defaults 20 and 2.0).
* Diff%: Safe division guards against division-by-zero.
* MA engine: You can choose SMA / EMA / WMA / RMA / HMA / VWMA / VWAP for BB/KC bases, Diff smoothing, and the trend components (VWAP is session-anchored).
* Calculation timeframe: Set “Calculation timeframe” to compute all internals on a chosen TF via request.security() while viewing any chart TF.
Inputs (key ones):
* Calculation timeframe: Empty = use chart TF; if set (e.g., 60), all internals compute on that TF.
* BB: Length, StdDev Mult, MA Type.
* KC: Basis Length, ATR Length, Multiplier, MA Type.
* Smoothing: Average Length & MA Type for the “Average Difference” line.
* Trend Engine: Fast/Slow lengths & MA type; Signal (kept for completeness); Thrust length & MA type (defaults replicate original behavior).
* Display: Paint bars only when Diff > 0; optional Zero line; optional true Blue color.
How to use:
1. Regime changes: Watch Diff% or Average Diff crossing 0. Above zero favors momentum/continuation setups; below zero suggests compression and potential breakout conditions.
2. State confirmation: Use bar colors to qualify expansion: Green/Red indicate expansion aligned with trend thrust; Yellow/Blue flag weaker/contrarian thrust during expansion.
3. Multi-timeframe analysis: Run calculations on a higher TF (e.g., H1/H4) while trading a lower TF chart to smooth noise.
Alerts:
* Diff crosses above/below 0.
* Average Diff crosses above/below 0.
* State changes: GREEN / RED / YELLOW / BLUE.
Notes & limitations:
* VWAP is session-anchored and best on intraday data. If not applicable on the selected calculation TF, the script automatically falls back to EMA.
* Default parameters (SMA(20) for BB/KC, multipliers 2.0, SMA(5) smoothing, trend logic and bar painting) preserve the original appearance.
Release notes:
v6.0 — Rewritten in Pine v6 with structured inputs and guards. Multi-MA support (SMA/EMA/WMA/RMA/HMA/VWMA/VWAP). Calculation timeframe via request.security() for multi-TF workflows. Safe division; optional zero line; optional true Blue color. Original visuals and behavior preserved by default.
License / disclaimer:
© waranyu.trkm — MIT License. Educational use only; not financial advice.
Поиск скриптов по запросу "OHLC"
Heikin Ashi Wick Strategy
🔥 Heikin Ashi Wick Momentum Strategy
“Trade momentum decay before the trend breaks.
>> FOCUS ON WICKS, NOT ONLY CANDLE COLOR<<
What Makes This Different (Traffic Driver)
✔ Uses Heikin Ashi wicks (almost nobody does this correctly)
✔ Captures trend continuation, not breakouts
✔ Exits before momentum collapse, not after
✔ Non-repainting
✔ Clean charts, instant readability
This Strategy Is REALLY Trading
This is a Heikin Ashi momentum-decay system:
• Enters when trend is strong but not euphoric
• Exits when:
o Trend stops probing higher
o Sellers gain relative strength
It avoids:
• Chasing strong breakout candles
• Holding through momentum rollovers
Candle Type Used: Heikin Ashi (manually calculated)
NOTE: The script does not use regular candles.
It reconstructs Heikin Ashi (HA) candles from raw OHLC:
• HA Close = average of open, high, low, close
• HA Open = midpoint of prior HA candle (smoothed)
• HA High / Low = extremes of HA open/close vs real high/low
➡️ This filters noise and emphasizes trend structure and momentum.
Strengths
✅ Works well in strong, smooth trends
✅ Very clean logic (no indicators)
✅ Non-repainting
✅ Early exits protect capital
Best Use
This works best on:
• Daily timeframe
• Strong trend ETFs / megacaps
o QQQ
o SPY
o NVDA, MSFT, AAPL
• When combined with:
o EMA 21 trend filter (your preference)
o Market regime filter (e.g., above 50/200 SMA)
o Rising 10 EMA and 20 EMA
________________________________________
8️⃣ Weaknesses (Important)
⚠️ No stop loss (only structure-based exits)
⚠️ Can exit too early in explosive trends
⚠️ Will chop in sideways markets
⚠️ No volatility filter (ATR, EMA, regime)
How to Avoid the Weaknesses — Summary
Turn the setup from a concept into a robust strategy by adding these controls:
1. Trade Only Trends
o Require price above EMA-21 (optionally EMA-21 > EMA-50)
o Eliminates chop and sideways markets
2. Improve Exits (Avoid Leaving Winners Too Early)
o Partial exit when upper wick disappears
o Full exit only when lower wick dominates
o Optional: require 2 consecutive exit candles
3. Add Risk Protection
o Use a volatility stop: ~1.5× ATR(14) below entry or below HA swing low
o Protects against gaps and sudden reversals
4. Filter Weak Signals
o Require meaningful wick size (≈30–40% of candle range)
o Avoids low-quality indecision candles
5. Avoid Bad Volatility
o Skip entries when ATR is expanding aggressively
o Focus on calmer, controllable trends
6. Limit Time in Trade
o Add a max bars hold (e.g., 10–15 bars on daily)
o Prevents capital getting stuck in fading trends
⚠️ Educational use only. Not financial advice. Trading involves risk and losses can exceed expectations. Past performance does not guarantee future results. Use at your own risk.

IDLP – Intraday Daily Levels Pro [FXSMARTLAB]🔥 IDLP – Intraday Daily Levels Pro
IDLP – Intraday Daily Levels Pro is a precision toolkit for intraday traders who rely on objective daily structure instead of repainting indicators and noisy signals.
Every level plotted by IDLP is derived from one simple rule:
Today’s trading decisions must be based on completed market data only.
That means:
✅ No use of the current day’s unfinished data for levels
✅ No lookahead
✅ No hidden repaint behavior
IDLP reconstructs the previous trading day from the intraday chart and then projects that structure forward onto the current session, giving you a stable, institutional-style intraday map.
🧱 1. Previous Daily Levels (Core Structure)
IDLP extracts and displays the full previous daily structure, which you can toggle on/off individually via the inputs:
Previous Daily High (PDH)
Previous Daily Low (PDL)
Previous Daily Open
Previous Daily Close,
Previous Daily Mid (50% of the range)
Previous Daily Q1 (25% of the range)
Previous Daily Q3 (75% of the range)
All of these come from the day that just closed and are then locked for the entire current session.
What these levels tell you:
PDH / PDL – true extremes of yesterday’s price action (liquidity zones, breakout/reversal points).
Previous Daily Open / Close – how the market positioned itself between session start and end
Mid (50%) – equilibrium level of the previous day’s auction.
Q1 / Q3 (25% / 75%) internal structure of the previous day’s range, dividing it into four equal zones and helping you see if price is trading in the lower, middle, or upper quarter of yesterday’s range.
All these levels are non-repaint: once the day is completed, they are fixed and never change when you scroll, replay, or backtest.
🎯 2. Previous Day Pivot System (P, S1, S2, R1, R2)
IDLP includes a classic floor-trader pivot grid, but critically:
It is calculated only from the previous day’s high, low, and close.
So for the current session, the following are fixed:
Pivot P – central reference level of the previous day.
Support 1 (S1) and Support 2 (S2)
Resistance 1 (R1) and Resistance 2 (R2)
These levels are widely used by institutional desks and algos to structure:
mean-reversion plays, breakout zones, intraday targets, and risk placement.
Everything in this section is non-repaint because it only uses the previous day’s fully closed OHLC.
📏 3. 1-Day ADR Bands Around Previous Daily Open
Instead of a multi-day ADR, IDLP uses a pure 1-Day ADR logic:
ADR = Range of the previous day
ADR = PDH − PDL
From that, IDLP builds two clean bands centered around the previous daily Open:
ADR Upper Band = Previous Day Open + (ADR × Multiplier)
ADR Lower Band = Previous Day Open − (ADR × Multiplier)
The multiplier is user-controlled in the inputs:
ADR Multiplier (default: 0.8)
This lets you choose how “tight” or “wide” you want the ADR envelope to be around the previous day’s open.
Typical use cases:
Identify realistic intraday extension targets, Spot exhaustion moves beyond ADR bands, Frame reversals after reaching volatility extremes, Align trades with or against volatility expansion
Again, since ADR is calculated only from the completed previous day, these bands are totally non-repaint during the current session.
🔒 4. True Non-Repaint Architecture
The internal logic of IDLP is built to guarantee non-repaint behavior:
It reconstructs each day using time("D") and tracks:
dayOpen, dayHigh, dayLow, dayClose for the current day
prevDayOpen, prevDayHigh, prevDayLow, prevDayClose for the previous day
At the moment a new day starts:
The “current day” gets “frozen” into prevDay*
These prevDay* values then drive: Previous Daily Levels, Pivots, ADR.
During the current day:
All these “previous day” values stay fixed, no matter what happens.
They do not move in real time, they do not shift in replay.
This means:
What you see in the past is exactly what you would have seen live.
No fake backtests.
No illusion of perfection from repainting behavior.
🎯 5. Designed For Intraday Traders
IDLP – Intraday Daily Levels Pro is made for:
- Day traders and scalpers
- Index and FX traders
- Prop firm challenge trading
- Traders using ICT/SMC-style levels, liquidity, and range logic
- Anyone who wants a clean, institutional-style daily framework without noise
You get:
Previous Day OHLC
Mid / Q1 / Q3 of the previous range
Previous-Day Pivots (P, S1, S2, R1, R2)
1-Day ADR Bands around Previous Day Open
All calculated only from closed data, updated once per day, and then locked.

DWM HLOC, Mid & WicksSimple, yet effective.
1. Automatically calculate and projects key price levels from a previous period (Yesterday, OR Last Week / Month) onto the current trading session. It acts as an immediate Support & Resistance map based on historical price action.
2. Multi-Timeframe Logic
Modes --
Daily Mode: Projects yesterday's data onto today.
Weekly Mode: Projects last week's data onto the current week.
3. Key Levels Visualized The script calculates seven distinct price levels:
OHLC: Previous Open, High, Low, and Close.
Equilibrium (Mid): The exact 50% mark between the previous High and Low.
Wick Midpoints (New):
Upper Wick 50%: The midpoint between the High and the top of the body.
Lower Wick 50%: The midpoint between the Low and the bottom of the body.
4. Smart "Gap" Visualization The script uses unique starting points to help traders visualize market gaps:
Standard Levels (High, Low, Open, Mids): These lines originate from the Previous Period's Open, showing the full context of the level relative to time.
Close Level: This line originates from the Current Period's Open. This visually highlights the "Gap" (the jump in price between where the market closed previously and where it opened today).
5. Full Customization
Aesthetics: Every line can be individually toggled on/off.
Styling: Users can independently change the color, line style (Solid, Dotted, Dashed), and thickness for every specific level.

Superior-Range Bound Renko - Alerts - 11-29-25 - Signal LynxSuperior-Range Bound Renko – Alerts Edition with Advanced Risk Management Template
Signal Lynx | Free Scripts supporting Automation for the Night-Shift Nation 🌙
1. Overview
This is the Alerts & Indicator Edition of Superior-Range Bound Renko (RBR).
The Strategy version is built for backtesting inside TradingView.
This Alerts version is built for automation: it emits clean, discrete alert events that you can route into webhooks, bots, or relay engines (including your own Signal Lynx-style infrastructure).
Under the hood, this script contains the same core engine as the strategy:
Adaptive Range Bounding based on volatility
Renko Brick Emulation on standard candles
A stack of Laguerre Filters for impulse detection
K-Means-style Adaptive SuperTrend for trend confirmation
The full Signal Lynx Risk Management Engine (state machine, layered exits, AATS, RSIS, etc.)
The difference is in what we output:
Instead of placing historical trades, this version:
Plots the entry and RM signals in a separate pane (overlay = false)
Exposes alertconditions for:
Long Entry
Short Entry
Close Long
Close Short
TP1, TP2, TP3 hits (Staged Take Profit)
This makes it ideal as the signal source for automated execution via TradingView Alerts + Webhooks.
2. Quick Action Guide (TL;DR)
Best Timeframe:
4H and above. This is a swing-trading / position-trading style engine, not a micro-scalper.
Best Assets:
Volatile but structured markets, e.g.:
BTC, ETH, XAUUSD (Gold), GBPJPY, and similar high-volatility majors or indices.
Script Type:
indicator() – Alerts & Visualization Only
No built-in order placement
All “orders” are emitted as alerts for your external bot or manual handling
Strategy Type:
Volatility-Adaptive Trend Following + Impulse Detection
using Renko-like structure and multi-layer Laguerre filters.
Repainting:
Designed to be non-repainting on closed candles.
The underlying Risk Management engine is built around previous-bar data (close , high , low ) for execution-critical logic.
Intrabar values can move while the bar is forming (normal for any advanced signal), but once a bar closes, the alert logic is stable.
Recommended Alert Settings:
Condition: one of the built-in signals (see section 3.B)
Options: “Once Per Bar Close” is strongly recommended for automation
Message: JSON, CSV, or simple tokens – whatever your webhook / relay expects
3. Detailed Report: How the Alerts Edition Works
A. Relationship to the Strategy Version
The Alerts Edition shares the same internal logic as the strategy version:
Same Adaptive Lookback and volatility normalization
Same Range and Close Range construction
Same Renko Brick Emulator and directional memory (renkoDir)
Same Fib structures, Laguerre stack, K-Means SuperTrend, and Baseline signals (B1, B2)
Same Risk Management Engine and layered exits
In the strategy script, these signals are wired into strategy.entry, strategy.exit, and strategy.close.
In the alerts script:
We still compute the final entry/exit signals (Fin, CloseEmAll, TakeProfit1Plot, etc.)
Instead of placing trades, we:
Plot them for visual inspection
Expose them via alertcondition(...) so that TradingView can fire alerts.
This ensures that:
If you use the same settings on the same symbol/timeframe, the Alerts Edition and Strategy Edition agree on where entries and exits occur.
(Subject only to normal intrabar vs. bar-close differences.)
B. Signals & Alert Conditions
The alerts script focuses on discrete, automation-friendly events.
Internally, the main signals are:
Fin – Final entry decision from the RM engine
CloseEmAll – RM-driven “hard close” signal (for full-position exits)
TakeProfit1Plot / 2Plot / 3Plot – One-time event markers when each TP stage is hit
On the chart (in the separate indicator pane), you get:
plot(Fin) – where:
+2 = Long Entry event
-2 = Short Entry event
plot(CloseEmAll) – where:
+1 = “Close Long” event
-1 = “Close Short” event
plot(TP1/TP2/TP3) (if Staged TP is enabled) – integer tags for TP hits:
+1 / +2 / +3 = TP1 / TP2 / TP3 for Longs
-1 / -2 / -3 = TP1 / TP2 / TP3 for Shorts
The corresponding alertconditions are:
Long Entry
alertcondition(Fin == 2, title="Long Entry", message="Long Entry Triggered")
Fire this to open/scale a long position in your bot.
Short Entry
alertcondition(Fin == -2, title="Short Entry", message="Short Entry Triggered")
Fire this to open/scale a short position.
Close Long
alertcondition(CloseEmAll == 1, title="Close Long", message="Close Long Triggered")
Fire this to fully exit a long position.
Close Short
alertcondition(CloseEmAll == -1, title="Close Short", message="Close Short Triggered")
Fire this to fully exit a short position.
TP 1 Hit
alertcondition(TakeProfit1Plot != 0, title="TP 1 Hit", message="TP 1 Level Reached")
First staged take profit hit (either long or short). Your bot can interpret the direction based on position state or message tags.
TP 2 Hit
alertcondition(TakeProfit2Plot != 0, title="TP 2 Hit", message="TP 2 Level Reached")
TP 3 Hit
alertcondition(TakeProfit3Plot != 0, title="TP 3 Hit", message="TP 3 Level Reached")
Together, these give you a complete trade lifecycle:
Open Long / Short
Optionally scale out via TP1/TP2/TP3
Close remaining via Close Long / Close Short
All while the Risk Management Engine enforces the same logic as the strategy version.
C. Using This Script for Automation
This Alerts Edition is designed for:
Webhook-based bots
Execution relays (e.g., your own Lynx-Relay-style engine)
Dedicated external trade managers
Typical setup flow:
Add the script to your chart
Same symbol, timeframe, and settings you use in the Strategy Edition backtests.
Configure Inputs:
Longs / Shorts enabled
Risk Management toggles (SL, TS, Staged TP, AATS, RSIS)
Weekend filter (if you do not want weekend trades)
RBR-specific knobs (Adaptive Lookback, Brick type, ATR vs Standard Brick, etc.)
Create Alerts for Each Event Type You Need:
Long Entry
Short Entry
Close Long
Close Short
TP1 / TP2 / TP3 (optional, if your bot handles partial closes)
For each:
Condition: the corresponding alertcondition
Option: “Once Per Bar Close” is strongly recommended
Message:
You can use structured JSON or a simple token set like:
{"side":"long","event":"entry","symbol":"{{ticker}}","time":"{{timenow}}"}
or a simpler text for manual trading like:
LONG ENTRY | {{ticker}} | {{interval}}
Wire Up Your Bot / Relay:
Point TradingView’s webhook URL to your execution engine
Parse the messages and map them into:
Exchange
Symbol
Side (long/short)
Action (open/close/partial)
Size and risk model (this script does not position-size for you; it only signals when, not how much.)
Because the alerts come from a non-repainting, RM-backed engine that you’ve already validated via the Strategy Edition, you get a much cleaner automation pipeline.
D. Repainting Protection (Alerts Edition)
The same protections as the Strategy Edition apply here:
Execution-critical logic (trailing stop, TP triggers, SL, RM state changes) uses previous bar OHLC:
open , high , low , close
No security() with lookahead or future-bar dependencies.
This means:
Alerts are designed to fire on states that would have been visible at bar close, not on hypothetical “future history.”
Important practical note:
Intrabar: While a bar is forming, internal conditions can oscillate.
Bar Close: With “Once Per Bar Close” alerts, the fired signal corresponds to the final state of the engine for that candle, matching your Strategy Edition expectations.
4. For Developers & Modders
You can treat this Alerts script as an ”RM + Alert Framework” and inject any signal logic you want.
Where to plug in:
Find the section:
// BASELINE & SIGNAL GENERATION
You’ll see how B1 and B2 are built from the RBR stack and then combined:
baseSig = B2
altSig = B1
finalSig = sigSwap ? baseSig : altSig
To use your own logic:
Replace or wrap the code that sets baseSig / altSig with your own conditions:
e.g., RSI, MACD, Heikin Ashi filters, candle patterns, volume filters, etc.
Make sure your final decision is still:
2 → Long / Buy signal
-2 → Short / Sell signal
0 → No trade
finalSig is then passed into the RM engine and eventually becomes Fin, which:
Drives the Long/Short Entry alerts
Interacts with the RM state machine to integrate properly with AATS, SL, TS, TP, etc.
Because this script already exposes alertconditions for key lifecycle events, you don’t need to re-wire alerts each time — just ensure your logic feeds into finalSig correctly.
This lets you use the Signal Lynx Risk Management Engine + Alerts wrapper as a drop-in chassis for your own strategies.
5. About Signal Lynx
Automation for the Night-Shift Nation 🌙
Signal Lynx builds tools and templates that help traders move from:
“I have an indicator” → “I have a structured, automatable strategy with real risk management.”
This Superior-Range Bound Renko – Alerts Edition is the automation-focused companion to the Strategy Edition. It’s designed for:
Traders who backtest with the Strategy version
Then deploy live signals with this Alerts version via webhooks or bots
While relying on the same non-repainting, RM-driven logic
We release this code under the Mozilla Public License 2.0 (MPL-2.0) to support the Pine community with:
Transparent, inspectable logic
A reusable Risk Management template
A reference implementation of advanced adaptive logic + alerts
If you are exploring full-stack automation (TradingView → Webhooks → Exchange / VPS), keep Signal Lynx in your search.
License: Mozilla Public License 2.0 (Open Source).
If you build improvements or helpful variants, please consider sharing them back with the community.

BarLibrary "Bar"
A comprehensive library for creating and managing custom multi-timeframe (MTF) candlestick bars without using request.security calls, providing enhanced visualization and analytical capabilities with improved performance
Candle()
Creates a new candle object initialized with current bar's OHLC data
Returns: A new _Candle instance with current market data
method body(this)
Calculates the absolute size of the candle body (distance between open and close)
Namespace types: _Candle
Parameters:
this (_Candle)
Returns: The absolute difference between closing and opening prices
method topWick(this)
Calculates the length of the upper wick (shadow above the candle body)
Namespace types: _Candle
Parameters:
this (_Candle)
Returns: The distance from the higher of open/close to the high price
method bottomWick(this)
Calculates the length of the lower wick (shadow below the candle body)
Namespace types: _Candle
Parameters:
this (_Candle)
Returns: The distance from the low price to the lower of open/close
method display(this, bullishColor, bearishColor, transp, borderWidth, lineWidth)
Renders the candle visually on the chart with customizable colors and styling options
Namespace types: _Candle
Parameters:
this (_Candle)
bullishColor (color)
bearishColor (color)
transp (int)
borderWidth (int)
lineWidth (int)
candles(tf, autoDisplay)
Creates and manages an array of custom timeframe candles with optional automatic display
Parameters:
tf (string) : Target timeframe string (e.g., "60", "240", "D") for candle aggregation
autoDisplay (bool)
Returns: Array containing all completed candles for the specified timeframe
_Candle
Custom candlestick data structure that stores OHLCV data with visual rendering components
Fields:
start (series int) : Opening timestamp of the candle period
end (series int) : Closing timestamp of the candle period
o (series float) : Opening price of the candle
h (series float) : Highest price reached during the candle period
l (series float) : Lowest price reached during the candle period
c (series float) : Closing price of the candle
v (series float) : Volume traded during the candle period
bodyBox (series box)
wickLine (series line)
Example Usage
// Change version with latest version
import EmreKb/Bar/1 as bar
// "240" for 4h timeframe
// true for auto display candles on chart (default: false)
candlesArr = bar.candles("240", true)
High Timeframe Candle Overlay (Configurable)HTF Candle Overlay — Read Higher Timeframe on Lower Timeframe Charts
What it does
This indicator draws each selected Higher-Timeframe (HTF) candle directly on your lower-timeframe (LTF) chart. It shows a translucent range box (HTF high–low) and an inner body box (HTF open–close), so you can track how the bigger candle is forming while you analyze lower-timeframe structure, liquidity sweeps, and intrabar reactions.
Why it’s helpful
• See where the current HTF candle opened, where price sits inside its body, and how far wicks extend—without leaving your LTF chart.
• Combine HTF context (e.g., 1H/4H) with LTF execution (e.g., 1m–15m) to spot confluence, S/R flips, and failed breaks faster.
• The overlay is locked to the price scale and anchored by bar index, so it pans/zooms exactly with your chart (no drifting while dragging).
⸻
How it works (under the hood)
• Fetches HTF OHLC via request.security.
• When a new HTF bar starts, the previous HTF boxes are frozen at the true close.
• The current HTF bar updates intrabar (so you see live formation) and is clamped to the correct span.
• Horizontal anchoring uses bar index, and a hidden price plot binds the script to the main price scale for stable zoom/pan behavior.
⸻
Inputs
• High Timeframe (HTF): Default 1H (set any TF you like).
• Show High–Low Box: On/off.
• Show Body Box (Open–Close): On/off.
• Opacity for range/body boxes.
• Bull/Bear Colors and Outline + Width.
• Max HTF Candles to Keep: Auto-deletes older boxes to maintain performance.
⸻
Usage tips
• Popular combos: view 1H or 4H candles while trading 1–15m charts.
• Turn off the range box if you only want a clean HTF body overlay.
• Pair with your session/structure tools; this indicator is visual context only (no signals or alerts).
⸻
Notes & limitations
• Non-repainting for closed HTF bars: once an HTF candle closes, its boxes are fixed. The current/in-progress HTF bar updates until it closes (expected live behavior).
• Data alignment depends on your symbol’s feed and session settings. Heikin Ashi/renko/etc. may not match classic OHLC.
• Heavy history + many boxes can affect performance; reduce “Max HTF Candles to Keep” if needed.
⸻
Disclaimer
This script is for education and charting visualization only. It does not provide financial advice, trade signals, or performance guarantees. Always do your own research and manage risk.
[blackcat] L3 Market Sentiment IndicatorLevel 3
Background
I've been thinking about trying out some technical indicators of market sentiment recently. Of course, this may not be limited to OHLC data, but requires more statistical data for analysis. However, I still wanted to try making a market sentiment indicator with OHLC. In this way, the difference between the two indicators can be compared later.
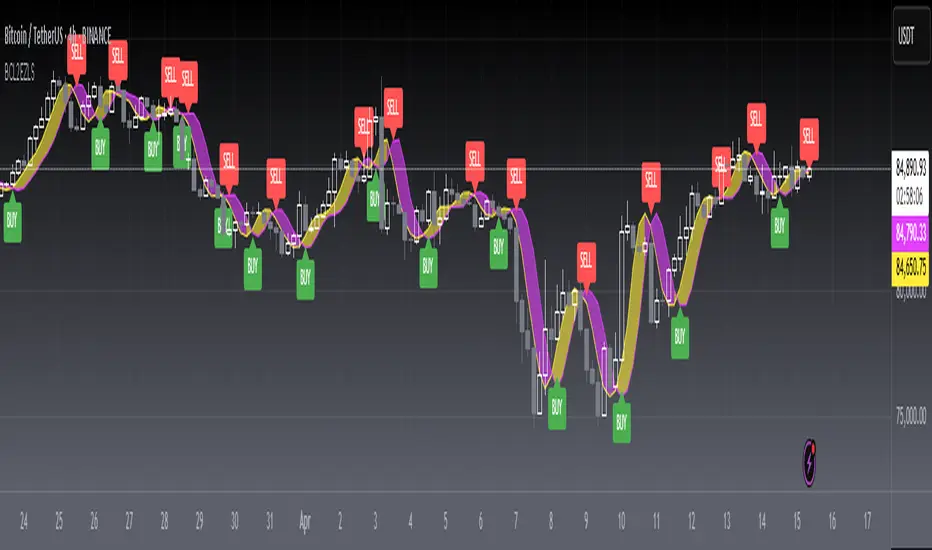
Function
This market sentiment indicator is functionally divided into two categories: the first is the sentiment line, which is a total of 3 lines. The first line is the yellow aggressive trader sentiment line, usually expressed as a 5-period moving average; the second line is the purple conservative trader interest line, which I used a slightly more complicated algorithm. The third line is the market sentiment line that takes the average of the first two. It is yellow when the market price is rising and purple when the price is falling.
The second type is the pressure line and the support line, a total of four, when they are support lines, the color is green; once they become resistance lines, the color will change from green to red, and show the current price of pressure or support.
Remarks
Feedbacks are appreciated.

`security()` revisited [PineCoders]NOTE
The non-repainting technique in this publication that relies on bar states is now deprecated, as we have identified inconsistencies that undermine its credibility as a universal solution. The outputs that use the technique are still available for reference in this publication. However, we do not endorse its usage. See this publication for more information about the current best practices for requesting HTF data and why they work.
█ OVERVIEW
This script presents a new function to help coders use security() in both repainting and non-repainting modes. We revisit this often misunderstood and misused function, and explain its behavior in different contexts, in the hope of dispelling some of the coder lure surrounding it. The function is incredibly powerful, yet misused, it can become a dangerous WMD and an instrument of deception, for both coders and traders.
We will discuss:
• How to use our new `f_security()` function.
• The behavior of Pine code and security() on the three very different types of bars that make up any chart.
• Why what you see on a chart is a simulation, and should be taken with a grain of salt.
• Why we are presenting a new version of a function handling security() calls.
• Other topics of interest to coders using higher timeframe (HTF) data.
█ WARNING
We have tried to deliver a function that is simple to use and will, in non-repainting mode, produce reliable results for both experienced and novice coders. If you are a novice coder, stick to our recommendations to avoid getting into trouble, and DO NOT change our `f_security()` function when using it. Use `false` as the function's last argument and refrain from using your script at smaller timeframes than the chart's. To call our function to fetch a non-repainting value of close from the 1D timeframe, use:
f_security(_sym, _res, _src, _rep) => security(_sym, _res, _src )
previousDayClose = f_security(syminfo.tickerid, "D", close, false)
If that's all you're interested in, you are done.
If you choose to ignore our recommendation and use the function in repainting mode by changing the `false` in there for `true`, we sincerely hope you read the rest of our ramblings before you do so, to understand the consequences of your choice.
Let's now have a look at what security() is showing you. There is a lot to cover, so buckle up! But before we dig in, one last thing.
What is a chart?
A chart is a graphic representation of events that occur in markets. As any representation, it is not reality, but rather a model of reality. As Scott Page eloquently states in The Model Thinker : "All models are wrong; many are useful". Having in mind that both chart bars and plots on our charts are imperfect and incomplete renderings of what actually occurred in realtime markets puts us coders in a place from where we can better understand the nature of, and the causes underlying the inevitable compromises necessary to build the data series our code uses, and print chart bars.
Traders or coders complaining that charts do not reflect reality act like someone who would complain that the word "dog" is not a real dog. Let's recognize that we are dealing with models here, and try to understand them the best we can. Sure, models can be improved; TradingView is constantly improving the quality of the information displayed on charts, but charts nevertheless remain mere translations. Plots of data fetched through security() being modelized renderings of what occurs at higher timeframes, coders will build more useful and reliable tools for both themselves and traders if they endeavor to perfect their understanding of the abstractions they are working with. We hope this publication helps you in this pursuit.
█ FEATURES
This script's "Inputs" tab has four settings:
• Repaint : Determines whether the functions will use their repainting or non-repainting mode.
Note that the setting will not affect the behavior of the yellow plot, as it always repaints.
• Source : The source fetched by the security() calls.
• Timeframe : The timeframe used for the security() calls. If it is lower than the chart's timeframe, a warning appears.
• Show timeframe reminder : Displays a reminder of the timeframe after the last bar.
█ THE CHART
The chart shows two different pieces of information and we want to discuss other topics in this section, so we will be covering:
A — The type of chart bars we are looking at, indicated by the colored band at the top.
B — The plots resulting of calling security() with the close price in different ways.
C — Points of interest on the chart.
A — Chart bars
The colored band at the top shows the three types of bars that any chart on a live market will print. It is critical for coders to understand the important distinctions between each type of bar:
1 — Gray : Historical bars, which are bars that were already closed when the script was run on them.
2 — Red : Elapsed realtime bars, i.e., realtime bars that have run their course and closed.
The state of script calculations showing on those bars is that of the last time they were made, when the realtime bar closed.
3 — Green : The realtime bar. Only the rightmost bar on the chart can be the realtime bar at any given time, and only when the chart's market is active.
Refer to the Pine User Manual's Execution model page for a more detailed explanation of these types of bars.
B — Plots
The chart shows the result of letting our 5sec chart run for a few minutes with the following settings: "Repaint" = "On" (the default is "Off"), "Source" = `close` and "Timeframe" = 1min. The five lines plotted are the following. They have progressively thinner widths:
1 — Yellow : A normal, repainting security() call.
2 — Silver : Our recommended security() function.
3 — Fuchsia : Our recommended way of achieving the same result as our security() function, for cases when the source used is a function returning a tuple.
4 — White : The method we previously recommended in our MTF Selection Framework , which uses two distinct security() calls.
5 — Black : A lame attempt at fooling traders that MUST be avoided.
All lines except the first one in yellow will vary depending on the "Repaint" setting in the script's inputs. The first plot does not change because, contrary to all other plots, it contains no conditional code to adapt to repainting/no-repainting modes; it is a simple security() call showing its default behavior.
C — Points of interest on the chart
Historical bars do not show actual repainting behavior
To appreciate what a repainting security() call will plot in realtime, one must look at the realtime bar and at elapsed realtime bars, the bars where the top line is green or red on the chart at the top of this page. There you can see how the plots go up and down, following the close value of each successive chart bar making up a single bar of the higher timeframe. You would see the same behavior in "Replay" mode. In the realtime bar, the movement of repainting plots will vary with the source you are fetching: open will not move after a new timeframe opens, low and high will change when a new low or high are found, close will follow the last feed update. If you are fetching a value calculated by a function, it may also change on each update.
Now notice how different the plots are on historical bars. There, the plot shows the close of the previously completed timeframe for the whole duration of the current timeframe, until on its last bar the price updates to the current timeframe's close when it is confirmed (if the timeframe's last bar is missing, the plot will only update on the next timeframe's first bar). That last bar is the only one showing where the plot would end if that timeframe's bars had elapsed in realtime. If one doesn't understand this, one cannot properly visualize how his script will calculate in realtime when using repainting. Additionally, as published scripts typically show charts where the script has only run on historical bars, they are, in fact, misleading traders who will naturally assume the script will behave the same way on realtime bars.
Non-repainting plots are more accurate on historical bars
Now consider this chart, where we are using the same settings as on the chart used to publish this script, except that we have turned "Repainting" off this time:
The yellow line here is our reference, repainting line, so although repainting is turned off, it is still repainting, as expected. Because repainting is now off, however, plots on historical bars show the previous timeframe's close until the first bar of a new timeframe, at which point the plot updates. This correctly reflects the behavior of the script in the realtime bar, where because we are offsetting the series by one, we are always showing the previously calculated—and thus confirmed—higher timeframe value. This means that in realtime, we will only get the previous timeframe's values one bar after the timeframe's last bar has elapsed, at the open of the first bar of a new timeframe. Historical and elapsed realtime bars will not actually show this nuance because they reflect the state of calculations made on their close , but we can see the plot update on that bar nonetheless.
► This more accurate representation on historical bars of what will happen in the realtime bar is one of the two key reasons why using non-repainting data is preferable.
The other is that in realtime, your script will be using more reliable data and behave more consistently.
Misleading plots
Valiant attempts by coders to show non-repainting, higher timeframe data updating earlier than on our chart are futile. If updates occur one bar earlier because coders use the repainting version of the function, then so be it, but they must then also accept that their historical bars are not displaying information that is as accurate. Not informing script users of this is to mislead them. Coders should also be aware that if they choose to use repainting data in realtime, they are sacrificing reliability to speed and may be running a strategy that behaves very differently from the one they backtested, thus invalidating their tests.
When, however, coders make what are supposed to be non-repainting plots plot artificially early on historical bars, as in examples "c4" and "c5" of our script, they would want us to believe they have achieved the miracle of time travel. Our understanding of the current state of science dictates that for now, this is impossible. Using such techniques in scripts is plainly misleading, and public scripts using them will be moderated. We are coding trading tools here—not video games. Elementary ethics prescribe that we should not mislead traders, even if it means not being able to show sexy plots. As the great Feynman said: You should not fool the layman when you're talking as a scientist.
You can readily appreciate the fantasy plot of "c4", the thinnest line in black, by comparing its supposedly non-repainting behavior between historical bars and realtime bars. After updating—by miracle—as early as the wide yellow line that is repainting, it suddenly moves in a more realistic place when the script is running in realtime, in synch with our non-repainting lines. The "c5" version does not plot on the chart, but it displays in the Data Window. It is even worse than "c4" in that it also updates magically early on historical bars, but goes on to evaluate like the repainting yellow line in realtime, except one bar late.
Data Window
The Data Window shows the values of the chart's plots, then the values of both the inside and outside offsets used in our calculations, so you can see them change bar by bar. Notice their differences between historical and elapsed realtime bars, and the realtime bar itself. If you do not know about the Data Window, have a look at this essential tool for Pine coders in the Pine User Manual's page on Debugging . The conditional expressions used to calculate the offsets may seem tortuous but their objective is quite simple. When repainting is on, we use this form, so with no offset on all bars:
security(ticker, i_timeframe, i_source )
// which is equivalent to:
security(ticker, i_timeframe, i_source)
When repainting is off, we use two different and inverted offsets on historical bars and the realtime bar:
// Historical bars:
security(ticker, i_timeframe, i_source )
// Realtime bar (and thus, elapsed realtime bars):
security(ticker, i_timeframe, i_source )
The offsets in the first line show how we prevent repainting on historical bars without the need for the `lookahead` parameter. We use the value of the function call on the chart's previous bar. Since values between the repainting and non-repainting versions only differ on the timeframe's last bar, we can use the previous value so that the update only occurs on the timeframe's first bar, as it will in realtime when not repainting.
In the realtime bar, we use the second call, where the offsets are inverted. This is because if we used the first call in realtime, we would be fetching the value of the repainting function on the previous bar, so the close of the last bar. What we want, instead, is the data from the previous, higher timeframe bar , which has elapsed and is confirmed, and thus will not change throughout realtime bars, except on the first constituent chart bar belonging to a new higher timeframe.
After the offsets, the Data Window shows values for the `barstate.*` variables we use in our calculations.
█ NOTES
Why are we revisiting security() ?
For four reasons:
1 — We were seeing coders misuse our `f_secureSecurity()` function presented in How to avoid repainting when using security() .
Some novice coders were modifying the offset used with the history-referencing operator in the function, making it zero instead of one,
which to our horror, caused look-ahead bias when used with `lookahead = barmerge.lookahead_on`.
We wanted to present a safer function which avoids introducing the dreaded "lookahead" in the scripts of unsuspecting coders.
2 — The popularity of security() in screener-type scripts where coders need to use the full 40 calls allowed per script made us want to propose
a solid method of allowing coders to offer a repainting/no-repainting choice to their script users with only one security() call.
3 — We wanted to explain why some alternatives we see circulating are inadequate and produce misleading behavior.
4 — Our previous publication on security() focused on how to avoid repainting, yet many other considerations worthy of attention are not related to repainting.
Handling tuples
When sending function calls that return tuples with security() , our `f_security()` function will not work because Pine does not allow us to use the history-referencing operator with tuple return values. The solution is to integrate the inside offset to your function's arguments, use it to offset the results the function is returning, and then add the outside offset in a reassignment of the tuple variables, after security() returns its values to the script, as we do in our "c2" example.
Does it repaint?
We're pretty sure Wilder was not asked very often if RSI repainted. Why? Because it wasn't in fashion—and largely unnecessary—to ask that sort of question in the 80's. Many traders back then used daily charts only, and indicator values were calculated at the day's close, so everybody knew what they were getting. Additionally, indicator values were calculated by generally reputable outfits or traders themselves, so data was pretty reliable. Today, almost anybody can write a simple indicator, and the programming languages used to write them are complex enough for some coders lacking the caution, know-how or ethics of the best professional coders, to get in over their heads and produce code that does not work the way they think it does.
As we hope to have clearly demonstrated, traders do have legitimate cause to ask if MTF scripts repaint or not when authors do not specify it in their script's description.
► We recommend that authors always use our `f_security()` with `false` as the last argument to avoid repainting when fetching data dependent on OHLCV information. This is the only way to obtain reliable HTF data. If you want to offer users a choice, make non-repainting mode the default, so that if users choose repainting, it will be their responsibility. Non-repainting security() calls are also the only way for scripts to show historical behavior that matches the script's realtime behavior, so you are not misleading traders. Additionally, non-repainting HTF data is the only way that non-repainting alerts can be configured on MTF scripts, as users of MTF scripts cannot prevent their alerts from repainting by simply configuring them to trigger on the bar's close.
Data feeds
A chart at one timeframe is made up of multiple feeds that mesh seamlessly to form one chart. Historical bars can use one feed, and the realtime bar another, which brokers/exchanges can sometimes update retroactively so that elapsed realtime bars will reappear with very slight modifications when the browser's tab is refreshed. Intraday and daily chart prices also very often originate from different feeds supplied by brokers/exchanges. That is why security() calls at higher timeframes may be using a completely different feed than the chart, and explains why the daily high value, for example, can vary between timeframes. Volume information can also vary considerably between intraday and daily feeds in markets like stocks, because more volume information becomes available at the end of day. It is thus expected behavior—and not a bug—to see data variations between timeframes.
Another point to keep in mind concerning feeds it that when you are using a repainting security() plot in realtime, you will sometimes see discrepancies between its plot and the realtime bars. An artefact revealing these inconsistencies can be seen when security() plots sometimes skip a realtime chart bar during periods of high market activity. This occurs because of races between the chart and the security() feeds, which are being monitored by independent, concurrent processes. A blue arrow on the chart indicates such an occurrence. This is another cause of repainting, where realtime bar-building logic can produce different outcomes on one closing price. It is also another argument supporting our recommendation to use non-repainting data.
Alternatives
There is an alternative to using security() in some conditions. If all you need are OHLC prices of a higher timeframe, you can use a technique like the one Duyck demonstrates in his security free MTF example - JD script. It has the great advantage of displaying actual repainting values on historical bars, which mimic the code's behavior in the realtime bar—or at least on elapsed realtime bars, contrary to a repainting security() plot. It has the disadvantage of using the current chart's TF data feed prices, whereas higher timeframe data feeds may contain different and more reliable prices when they are compiled at the end of the day. In its current state, it also does not allow for a repainting/no-repainting choice.
When `lookahead` is useful
When retrieving non-price data, or in special cases, for experiments, it can be useful to use `lookahead`. One example is our Backtesting on Non-Standard Charts: Caution! script where we are fetching prices of standard chart bars from non-standard charts.
Warning users
Normal use of security() dictates that it only be used at timeframes equal to or higher than the chart's. To prevent users from inadvertently using your script in contexts where it will not produce expected behavior, it is good practice to warn them when their chart is on a higher timeframe than the one in the script's "Timeframe" field. Our `f_tfReminderAndErrorCheck()` function in this script does that. It can also print a reminder of the higher timeframe. It uses one security() call.
Intrabar timeframes
security() is not supported by TradingView when used with timeframes lower than the chart's. While it is still possible to use security() at intrabar timeframes, it then behaves differently. If no care is taken to send a function specifically written to handle the successive intrabars, security() will return the value of the last intrabar in the chart's timeframe, so the last 1H bar in the current 1D bar, if called at "60" from a "D" chart timeframe. If you are an advanced coder, see our FAQ entry on the techniques involved in processing intrabar timeframes. Using intrabar timeframes comes with important limitations, which you must understand and explain to traders if you choose to make scripts using the technique available to others. Special care should also be taken to thoroughly test this type of script. Novice coders should refrain from getting involved in this.
█ TERMINOLOGY
Timeframe
Timeframe , interval and resolution are all being used to name the concept of timeframe. We have, in the past, used "timeframe" and "resolution" more or less interchangeably. Recently, members from the Pine and PineCoders team have decided to settle on "timeframe", so from hereon we will be sticking to that term.
Multi-timeframe (MTF)
Some coders use "multi-timeframe" or "MTF" to name what are in fact "multi-period" calculations, as when they use MAs of progressively longer periods. We consider that a misleading use of "multi-timeframe", which should be reserved for code using calculations actually made from another timeframe's context and using security() , safe for scripts like Duyck's one mentioned earlier, or TradingView's Relative Volume at Time , which use a user-selected timeframe as an anchor to reset calculations. Calculations made at the chart's timeframe by varying the period of MAs or other rolling window calculations should be called "multi-period", and "MTF-anchored" could be used for scripts that reset calculations on timeframe boundaries.
Colophon
Our script was written using the PineCoders Coding Conventions for Pine .
The description was formatted using the techniques explained in the How We Write and Format Script Descriptions PineCoders publication.
Snippets were lifted from our MTF Selection Framework , then massaged to create the `f_tfReminderAndErrorCheck()` function.
█ THANKS
Thanks to apozdnyakov for his help with the innards of security() .
Thanks to bmistiaen for proofreading our description.
Look first. Then leap.

HatiKO EnvelopesPublished source code is subject to the terms of the GNU Affero General Public License v3.0
This script describes and provides backtesting functionality to internal strategy of algorithmic crypto trading software "HatiKO bot".
Suitable for backtesting any Cryptocurrency Pair on any Exchange/Platform, any Timeframe.
Core Mechanics of this strategy are based on theory of price always returning to Moving Average + Envelopes indicator (Moving_average_envelope from Wiki)
Developement of this script and trading software is inspired by:
"Essential Technical Analysis: Tools and Techniques to Spot Market Trends" by Leigh Stevens (published on 12th of April 2002)
"Moving Average Envelopes" by ChartSchool, StockCharts platform (published on 13th of April 2015 or earlier)
"Коля Колеснік" from Crypto Times channel ("Метод сетка", published on 19th of August 2018)
"3 ways to use Moving Average Envelopes" by Rich Fitton, published on Trader's Nest (published on 28st of November 2018 or earlier)
noro's "Robot WhiteBox ShiftMA" strategy v1 script, published on TradingView platform (published on 29th of August 2018)
"Moving Average Envelopes: A Popular Trading Tool" Investopedia article (published 25th of June 2019)
and KROOL1980's blogpost on Argolabs ("Гридерство или Сетка как источник прибыли на форекс", published on 27th of February 2015)
Core Features:
1) Up to 4 Envelopes in each direction (Long/Short)
2) Use any of 6 different basis MAs, optionally use different MAs for Opening and Closure
3) Use different Timeframes for MA calculation, without any repainting and lookahead bias.
4) Fixed order size, not Martingale strategy
5) Close open position earlier by using Deviation parameter
6) PineScript v4 code
Options description:
Lot - % from your initial balance to use for order size calculation
Timeframe Short - Timeframe to use for Short Opening MA calculation, can be chosen from dropdown list, default is Current Graph Timeframe
MA Type Short - Type of MA to use for Short Opening MA calculation, can be chosen from dropdown list, default is SMA
Data Short - Source of Price for Short Opening MA calculation, can be chosen from dropdown list, default is OHLC4
MA Length Short - Period used for Short Opening MA calculation, should be >=1, default is 3
MA offset Short - Offset for MA value used for Short Envelopes calculation, should be >= 0, default is 0
Timeframe Long - Timeframe to use for Long Opening MA calculation, can be chosen from dropdown list, default is Current Graph Timeframe
MA Type Long - Type of MA to use for Long Opening MA calculation, can be chosen from dropdown list, default is SMA
Data Long - Source of Price for Long Opening MA calculation, can be chosen from dropdown list, default is OHLC4
MA Length Long - Period used for Long Opening MA calculation, should be >=1, default is 3
MA offset Long - Offset for MA value used for Long Envelopes calculation, should be >= 0, default is 0
Mode close MA Short - Enable different MA for Short position Closure, default is "false". If false, Closure MA = Opening MA
Timeframe Short Close - Timeframe to use for Short Position Closure MA calculation, can be chosen from dropdown list, default is Current Graph Timeframe
MA Type Close Short - Type of MA to use for Short Position Closure MA calculation, can be chosen from dropdown list, default is SMA
Data Short Close - Source of Price for Short Closure MA calculation, can be chosen from dropdown list, default is OHLC4
MA Length Short Close - Period used for Short Opening MA calculation, should be >=1, default is 3
Short Deviation - % to move from MA value, used to close position above or beyond MA, can be negative, default is 0
MA offset Short Close - Offset for MA value used for Short Position Closure calculation, should be >= 0, default is 0
Mode close MA Long - Enable different MA for Long position Closure, default is "false". If false, Closure MA = Opening MA
Timeframe Long Close - Timeframe to use for Long Position Closure MA calculation, can be chosen from dropdown list, default is Current Graph Timeframe
MA Type Close Long - Type of MA to use for Long Position Closure MA calculation, can be chosen from dropdown list, default is SMA
Data Long Close - Source of Price for Long Closure MA calculation, can be chosen from dropdown list, default is OHLC4
MA Length Long Close - Period used for Long Opening MA calculation, should be >=1, default is 3
Long Deviation - % to move from MA value, used to close position above or beyond MA, can be negative, default is 0
MA offset Long Close - Offset for MA value used for Long Position Closure calculation, should be >= 0, default is 0
Short Shift 1..4 - % from MA value to put Envelopes at, for Shorts numbers should be positive, the higher is number, the higher should be Shift position, example: "Shift 1 = 1, shift 2 = 2, etc."
Long Shift 1..4 - % from MA value to put Envelopes at, for Longs numbers should be negative, the lower is number, the lower should be Shift position, example: "Shift 1 = -1, shift 2 = -2, etc."
From Year 20XX - Backtesting Starting Year number, only 20xx supported as script is cryptocurrency-oriented.
To Year 20XX - Backtesting Final Year number, only 20xx supported as script is cryptocurrency-oriented.
From Month - Years starting Month, optional tweaking, changing not recommended
To Month - Years ending Month, optional tweaking, changing not recommended
From day - Months starting day, optional tweaking, changing not recommended
To day - Months ending day, optional tweaking, changing not recommended
Graph notes:
Green lines - Long Envelopes.
Red lines - Short Envelopes.
Orange line - MA for closing of Short positions.
Lime line - MA for closing of Long positions.
**************************************************************************************************************************************************************************************************************
Опубликованный исходный код регулируется Условиями Стандартной Общественной Лицензии GNU Affero v3.0
Этот скрипт описывает и предоставляет функции бектеста для внутренней стратегии алгоритмического программного обеспечения "HatiKO bot".
Подходит для тестирования любой криптовалютной пары на любой бирже/платформе, на любом таймфрейме.
Кор-механика этой стратегии основана на теории всегда возвращающейся к значению МА цены с использованием индикатора Envelopes (Moving_average_envelope from Wiki)
Разработка этого скрипта и программного обеспечения для торговли вдохновлена следующими источниками:
Книга "Essential Technical Analysis: Tools and Techniques to Spot Market Trends" Ли Стивенса (опубликовано 12 апреля 2002 года)
«Moving Average Envelopes» от ChartSchool, платформа StockCharts (опубликовано 13 апреля 2015 года или раньше)
«Коля Колеснік» с канала Crypto Times («Метод сетка», опубликовано 19 августа 2018 года)
«3 ways to use Moving Average Envelopes» Рича Фиттона, опубликованные в «Trader's Nest» (опубликовано 28 ноября 2018 года или раньше)
Скрипт стратегии noro "Robot WhiteBox ShiftMA" v1, опубликованный на платформе TradingView(опубликовано 29 августа 2018 года)
«Moving Average Envelopes: A Popular Trading Tool», статья Investopedia (опубликовано 25 июня 2019 года)
Блог KROOL1980 из Argolabs («Гридерство или Сетка как источник прибыли на форекс», опубликовано 27 февраля 2015 года)
Основные особенности:
1) До 4-х Ордеров в каждом из направлении (Лонг / Шорт)
2) Выбор из 6-ти разных базовых МА, опционально используйте разные МА для открытия и закрытия.
3) Используйте разные таймфреймы для расчета MA, без перерисовки и "эффекта стеклянного шара".
4) Фиксированный размер ордера, а не стратегия Мартингейла
5) Возможность закрытия открытой позиции заблаговременно, используя параметр Deviation
6) Код реализован на PineScript v4
Описание параметров:
Lot - % от вашего первоначального баланса, используется при расчете размера Ордера
Timeframe Short - таймфрейм, используемый для расчета МА Открытия Шорт позиций, может быть выбран из списка, по умолчанию - таймфрейм текущего графика
MA Type Short - тип MA, используемый для расчета МА Открытия Шорт позиций, может быть выбран из списка, по умолчанию SMA
Data Short - источник цены для расчета МА Открытия Шорт позиций, может быть выбран из списка, по умолчанию OHLC4
MA Length Short - период, используемый для расчета МА Открытия Шорт позиций, должен быть >= 1, по умолчанию 3
MA Offset Short - смещение значения MA, используемого для расчета Шорт Ордеров, должно быть >= 0, по умолчанию 0
Timeframe Long - таймфрейм, используемый для расчета МА Открытия Лонг позиций, может быть выбран из списка, по умолчанию - таймфрейм текущего графика
MA Type Long - тип MA, используемый для расчета МА Открытия Лонг позиций, может быть выбран из списка, по умолчанию SMA
Data Long - источник цены для расчета МА Открытия Лонг позиций, может быть выбран из списка, по умолчанию OHLC4
MA Length Long - период, используемый для расчета МА Открытия Лонг позиций, должен быть >= 1, по умолчанию 3
MA Offset Long - смещение значения MA, используемого для расчета Лонг Ордеров, должно быть >= 0, по умолчанию 0
Mode close MA Short - Включает отдельное MA для закрытия Шорт позиции, по умолчанию «false». Если false, MA Закрытия = MA Открытия
Timeframe Short Close - таймфрейм, используемый для расчета МА Закрытия Шорт позиций, может быть выбран из списка, по умолчанию - таймфрейм текущего графика
MA Type Close Short - тип MA, используемый при расчете МА Закрытия Шорт позиции. Mожно выбрать из списка, по умолчанию SMA
Data Short Close - источник цены для расчета МА Закрытия Шорт позиций, может быть выбран из списка, по умолчанию OHLC4
MA Length Short Close - период, используемый для расчета МА Закрытия Шорт позиции, должен быть >= 1, по умолчанию 3
Short Deviation - % отклонения от значения MA, используется для закрытия позиции выше или ниже рассчитанного значения MA, может быть отрицательным, по умолчанию 0
MA Offset Short Close - смещение значения MA, используемого для расчета закрытия Шорт позиции, должно быть >= 0, по умолчанию 0
Mode close MA Long - Включает разные MA для закрытия Лонг позиции, по умолчанию «false». Если false, MA Закрытия = MA Открытия
Timeframe Long Close - таймфрейм, используемый для расчета МА Закрытия Лонг позиций, может быть выбран из списка, по умолчанию - таймфрейм текущего графика
MA Type Close Long - тип MA, используемый при расчете МА Закрытия Лонг позиции. Mожно выбрать из списка, по умолчанию SMA
Data Long Close - источник цены для расчета МА Закрытия Лонг позиций, может быть выбран из списка, по умолчанию OHLC4
MA Length Long Close - период, используемый для расчета МА Закрытия Лонг позиции, должен быть >= 1, по умолчанию 3
Long Deviation -% для перехода от значения MA, используется для закрытия позиции выше или ниже рассчитанного значения MA, может быть отрицательным, по умолчанию 0
MA Offset Long Close - смещение значения MA, используемого для расчета закрытия Лонг позиции, должно быть >= 0, по умолчанию 0
Short Shift 1..4 - % от значения MA для размещения Ордеров, для Шорт Ордеров должен быть положительным, чем выше номер, тем выше должна располагаться позиция Shift, например: «Shift 1 = 1, Shift 2 = 2 и т.д. "
Long Shift 1..4 - % от значения MA для размещения Ордеров, для Лонг Ордеров должно быть отрицательным, чем ниже число, тем ниже должна располагаться позиция Shift, например: «Shift 1 = -1, Shift 2 = -2, и т.д."
From Year 20XX - Год начала тестирования, из-за ориентированности на криптовалюты поддерживаются только значения формата 20хх.
To Year 20XX - Год окончания тестирования, из-за ориентированности на криптовалюты поддерживаются только значения формата 20хх.
From Month - Начальный месяц, опционально, менять не рекомендуется
To Month - Конечный месяц, опционально, менять не рекомендуется
From day - Начальный день месяца, опционально, менять не рекомендуется
To day - Конечный день месяца, опционально, менять не рекомендуется
Пояснения к графику:
Зеленые линии - Лонг Ордера.
Красные линии - Шорт Ордера.
Оранжевая линия - MA Закрытия Шорт позиций.
Лаймовая линия - MA Закрытия Лонг позиций.

Volume composition / quantifytools— Overview
While net volume is useful information, it can be a blunt data point. Volume composition breaks down the content of volume, allowing a more detailed look inside each volume node. Volume composition consists of the following information:
Total volume (buy and sell). By default gray node.
Dominating volume (buy or sell). By default dark green/dark red node.
Dominating active volume (buy or sell). By default light green/light red node.
Dominating volume as percentage of total volume.
Dominating active volume as percentage of total active volume.
Buy and sell volume is defined by volume associated with lower timeframe up/down moves. This classification is further broken down to passive/active, standing for decreasing/increasing volume, e.g. a move up with volume higher than previous bar volume = active buy volume, a move up with volume lower than previous bar volume = passive buy volume.
Volume data is fetched from a lower timeframe that is automatically adjusted to fit the timeframe you're using. By default, the following settings are applied:
Charts <= 30 min: 1 minute timeframe
Charts > 30 min & <= 3 hours : 5 minute timeframe
Charts > 3 hours & <= 8 hours : 15 minute timeframe
Charts > 8 hours & <= 1D: 1 hour timeframe
Charts > 1D & <= 3D : 2 hour timeframe
Charts > 3D: 4 hour timeframe
Timeframe settings can be changed via input menu. The lower the timeframe, the more precision you get but with the cost of less historical data and slower loading time. Users can also choose which source to use for determining buy/sell volume, e.g. using close as source, a close that is higher than previous close would be considered as buy volume. This could be replaced with OHLC4 for example, resulting in a volume direction based on OHLC average.
Volume composition of current chart can also be replaced with any other chart volume composition:
— Visuals
Breakdown of visual elements:
1. Symbol and timeframe used for volume composition calculations. By default the chart that is viewed and automatically selected lower timeframe.
2. Dominating volume threshold exceeded. Can be defined via input menu, 70% of total volume by default.
3. Dominating volume as percentage of total volume. Plotted below volume nodes, without % symbol.
4. Dominating active volume, + or - symbol, standing for buy and sell. Plotted below dominating volume percentage. When dominating volume and dominating active volume sides are in a disagreement (e.g. dominating volume is on buy side while dominating active volume is on sell side) this symbol will appear inside brackets, (+) or (-).
5. Dominating active volume as percentage of total active volume. Plotted below +/- symbol.
6. Dominating active volume threshold exceeded. Can be defined via input menu, 70% by default.
Dominating volume & active volume percentages can be rounded to single numbers to avoid clutter caused by overlapping values. The percentage values will be rounded to closest single number value, e.g. dominating volume percentage at 54% = 5, dominating volume percentage at 55% = 6.
Volume anomalies can be highlighted on the chart with a color for studying the events and their past implications in greater detail. Available anomalies for highlights are the following:
Buy volume threshold exceeded
Sell volume threshold exceeded
Active buy volume threshold exceeded
Active sell volume threshold exceeded
Volume & active volume divergence
— Practical guide
Volume is arguably one of the most important data points as it directly relates to liquidity. High volume can be an indication of strength (price likely to continue moving) or absorption (price likely to halt/turn). Same applies to active volume, but with an element of aggression. High active volume serves as an indication of exuberance or otherwise forceful transacting, like stop losses triggering. With these principles in mind, the composition of volume allows distinguishing potentially important events.
Example #1 : Identifying areas of trapped market participants
Often when volume spikes distinctively, we can make the case that price has found sufficient liquidity to halt/turn. Since we know which side was absorbed, in what quantity and type (passive/active), we can identify areas of trapped market participants. In such scenarios, the higher the dominant active volume and volume spike itself, the better.
Example #2 : Identifying a healthy trend
A healthy trend is one that has an active and consistent bid driving it. When this is the case, it can be seen in consistently supportive active volume.
Example #3 : Identifying inflection points
When dominant side of volume and dominant side of active volume diverge, something is up. A divergence often marks an area of indecision, hinting an imminent move one way or the other.

Time & volume point of control / quantifytoolsWhat are TPOC & VPOC?
TPOC (time point of control) and VPOC (volume point of control) are points in price where highest amount of time/volume was traded. This is considered key information in a market profile, as it shows where market participant interest was highest. Unlike full fledged market profile that shows total time/volume distribution, this script shows the points of control for each candle, plotted with a line (time) and a dot (volume). The script hides your candles/bars by default and forms a line in the middle representing candle range. In case of candles, borders will still be visible. This feature can be turned off in the settings.
Volume and time data are fetched from a lower timeframe that is automatically adjusted to fit the timeframe you're using. By default, the following settings are applied:
Charts <= 30 min: 1 minute timeframe
Charts > 30 min & <= 3 hours : 5 minute timeframe
Charts > 3 hours & <= 8 hours : 15 minute timeframe
Charts > 8 hours & <= 1D: 1 hour timeframe
Charts > 1D & <= 3D : 2 hour timeframe
Charts > 3D: 4 hour timeframe
Timeframe settings can be changed via input menu. The lower the timeframe, the more precision you get but with the cost of less historical data and slower loading time. Users can also choose which source to use for determining price for points of control, e.g. using close as source, the point of control is set to match the value of lower timeframe candle close. This could be replaced with OHLC4 for example, resulting in a point of control based on OHLC average.
To identify more profound points of market participant interest, TPOC & VPOC as percentage of total time/volume thresholds can be set via input menu. When a point of control is equal to or greater than the set percentage threshold, visual elements will be highlighted in a different color, e.g. 50% VPOC threshold will activate a highlight whenever volume traded at VPOC is equal to or greater than 50% of total volume. All colors are customizable.
VPOC is defined by fetching lower timeframe candle with the most amount of volume traded and using its close (by default) as a mark for point of control. For TPOC, each candle is divided into 10 lots which are used for calculating amount of closes taking place within the bracket values. The lot with highest amount of closes will be considered a point of control. This mark is displayed in the middle point of a lot:
How to utilize TPOC & VPOC
Example #1: Trapped market participants
One or both points of control at one end of candle range (wick tail) and candle close at the other end serves as an indication of market participants trapped in an awkward position. When price runs away further from these trapped participants, they are eventually forced to cover and drive price even further to the opposite direction:
Example #2: Trend initiation
A large move that leaves TPOC behind while VPOC is supportive serves as an indication of a trend initiation. Essentially, this is one way to identify an event where price traded sideways most of the time and suddenly moved away with volume:
Example #3: POC supported trend
A trend is healthy when it's supported by a point of control. Ideally you want to see either time or volume supporting a trend:
[blackcat] L2 Ehlers Zero-lag SmootherLevel: 2
Background
John F. Ehlers introuced Zero-Lag Data Smoothers in Jul, 2002.
Function
John Ehlers introduced "Zero-Lag Data Smoothers", the infinite impulse response (IIR) filter and finite impulse response (FIR) filter.
In his article this issue on zero-lag smoothing, John Ehlers notes that his favorite filter is the symmetrically weighted six-bar finite impulse response (FIR) filter. This is also known as a triangular moving average, and can be conveniently implemented as a double-smoothed simple moving average. Per Ehlers, since this filter has six elements, its lag is 2.5 bars. Via further processing, this lag can be reduced to zero, but this produces too much overshoot. As a compromise, Ehlers suggests reducing the lag to one bar. To enable a user to adjust the lag easily, I provide the pine v4 code for an Adjustable Lag Filter indicator below. The first input, Price, should typically be set to OHLC, hl2, hl3, ohlc4 etc. The second input, LagReduction, should be set to a value in the zero-to-2.5 range. Setting it to zero will result in no adjustment, and the output will match that of the raw triangular average. Setting it to 2.5 will reduce the lag to zero. Setting it to 1.5 will reduce the lag to one bar.
Key Signal
Filter--> Zero-Lag Data Smoother fast line
Trigger--> Zero-Lag Data Smoother slow line
Pros and Cons
100% John F. Ehlers definition translation, even variable names are the same. This help readers who would like to use pine to read his book.
Remarks
The 67th script for Blackcat1402 John F. Ehlers Week publication.
Readme
In real life, I am a prolific inventor. I have successfully applied for more than 60 international and regional patents in the past 12 years. But in the past two years or so, I have tried to transfer my creativity to the development of trading strategies. Tradingview is the ideal platform for me. I am selecting and contributing some of the hundreds of scripts to publish in Tradingview community. Welcome everyone to interact with me to discuss these interesting pine scripts.
The scripts posted are categorized into 5 levels according to my efforts or manhours put into these works.
Level 1 : interesting script snippets or distinctive improvement from classic indicators or strategy. Level 1 scripts can usually appear in more complex indicators as a function module or element.
Level 2 : composite indicator/strategy. By selecting or combining several independent or dependent functions or sub indicators in proper way, the composite script exhibits a resonance phenomenon which can filter out noise or fake trading signal to enhance trading confidence level.
Level 3 : comprehensive indicator/strategy. They are simple trading systems based on my strategies. They are commonly containing several or all of entry signal, close signal, stop loss, take profit, re-entry, risk management, and position sizing techniques. Even some interesting fundamental and mass psychological aspects are incorporated.
Level 4 : script snippets or functions that do not disclose source code. Interesting element that can reveal market laws and work as raw material for indicators and strategies. If you find Level 1~2 scripts are helpful, Level 4 is a private version that took me far more efforts to develop.
Level 5 : indicator/strategy that do not disclose source code. private version of Level 3 script with my accumulated script processing skills or a large number of custom functions. I had a private function library built in past two years. Level 5 scripts use many of them to achieve private trading strategy.
smaemarvwapClaireLibrary "smaemarvwapClaire"
repeat_character(count)
Parameters:
count (int)
f_1_k_line_width()
is_price_in_merge_range(p1, p2, label_merge_range)
Parameters:
p1 (float)
p2 (float)
label_merge_range (float)
get_pre_label_string(kc, t, is_every)
Parameters:
kc (VWAP_key_levels_draw_settings)
t (int)
is_every (bool)
f_is_new_period_from_str(str)
Parameters:
str (string)
total_for_time_when(source, days, ma_set)
Parameters:
source (float)
days (int)
ma_set (ma_setting)
f_calculate_sma_ema_rolling_vwap(src, length, ma_settings)
Parameters:
src (float)
length (simple int)
ma_settings (ma_setting)
f_calculate_sma_ema_rvwap(ma_settings)
Parameters:
ma_settings (ma_setting)
f_get_ma_pre_label(ma_settings, sma, ema, rolling_vwap)
Parameters:
ma_settings (ma_setting)
sma (float)
ema (float)
rolling_vwap (float)
f_smart_ma_calculation(ma_settings2)
Parameters:
ma_settings2 (ma_setting)
f_calculate_endpoint(start_time, kc, is_every, endp, extend1, extend2, line_label_extend_length)
Parameters:
start_time (int)
kc (VWAP_key_levels_draw_settings)
is_every (bool)
endp (int)
extend1 (bool)
extend2 (bool)
line_label_extend_length (int)
f_single_line_label_fatory(left_point, right_point, line_col, line_width, lines_style_select, labeltext_col, label_text_size, label_array, line_array, label_col, label_text, l1, label1)
根据两个点创建线段和/或标签,并将其添加到对应的数组中
Parameters:
left_point (chart.point) : 左侧起点坐标
right_point (chart.point) : 右侧终点坐标
line_col (color) : 线段颜色
line_width (int) : 线段宽度
lines_style_select (string) : 线段样式(实线、虚线等)
labeltext_col (color) : 标签文字颜色
label_text_size (string) : 标签文字大小
label_array (array) : 存储标签对象的数组
line_array (array) : 存储线段对象的数组
label_col (color) : 标签背景颜色(默认:半透明色)
label_text (string) : 标签文字内容(默认:空字符串)
l1 (bool) : 是否创建线段(默认:false)
label1 (bool) : 是否创建标签(默认:false)
Returns: void
f_line_and_label_merge_func(t, data, l_text, kc, is_every, endp, merge_str_map, label_array, line_array, extend1, extend2, line_label_extend_length, label_merge_control, line_width, lines_style_select, label_text_size)
Parameters:
t (int)
data (float)
l_text (string)
kc (VWAP_key_levels_draw_settings)
is_every (bool)
endp (int)
merge_str_map (map)
label_array (array)
line_array (array)
extend1 (bool)
extend2 (bool)
line_label_extend_length (int)
label_merge_control (bool)
line_width (int)
lines_style_select (string)
label_text_size (string)
plot_ohlc(kc, ohlc_data, extend1, extend2, merge_str_map, label_array, line_array, is_every, line_label_extend_length, label_merge_control, line_width, lines_style_select, label_text_size)
Parameters:
kc (VWAP_key_levels_draw_settings)
ohlc_data (bardata)
extend1 (bool)
extend2 (bool)
merge_str_map (map)
label_array (array)
line_array (array)
is_every (bool)
line_label_extend_length (int)
label_merge_control (bool)
line_width (int)
lines_style_select (string)
label_text_size (string)
plot_vwap_keylevels(kc, vwap_data, extend1, extend2, merge_str_map, label_array, line_array, is_every, line_label_extend_length, label_merge_control, line_width, lines_style_select, label_text_size)
Parameters:
kc (VWAP_key_levels_draw_settings)
vwap_data (vwap_snapshot)
extend1 (bool)
extend2 (bool)
merge_str_map (map)
label_array (array)
line_array (array)
is_every (bool)
line_label_extend_length (int)
label_merge_control (bool)
line_width (int)
lines_style_select (string)
label_text_size (string)
plot_vwap_bardata(kc, ohlc_data, vwap_data, extend1, extend2, merge_str_map, label_array, line_array, is_every, line_label_extend_length, label_merge_control, line_width, lines_style_select, label_text_size)
Parameters:
kc (VWAP_key_levels_draw_settings)
ohlc_data (bardata)
vwap_data (vwap_snapshot)
extend1 (bool)
extend2 (bool)
merge_str_map (map)
label_array (array)
line_array (array)
is_every (bool)
line_label_extend_length (int)
label_merge_control (bool)
line_width (int)
lines_style_select (string)
label_text_size (string)
f_start_end_total_min(session)
Parameters:
session (string)
f_get_vwap_array(anchor1, data_manager, is_historical)
Parameters:
anchor1 (string)
data_manager (data_manager)
is_historical (bool)
f_get_bardata_array(anchorh, data_manager, is_historical)
Parameters:
anchorh (string)
data_manager (data_manager)
is_historical (bool)
vwap_snapshot
Fields:
t (series int)
vwap (series float)
upper1 (series float)
lower1 (series float)
upper2 (series float)
lower2 (series float)
upper3 (series float)
lower3 (series float)
VWAP_key_levels_draw_settings
Fields:
enable (series bool)
index (series int)
anchor (series string)
session (series string)
vwap_col (series color)
bands_col (series color)
bg_color (series color)
text_color (series color)
val (series bool)
poc (series bool)
vah (series bool)
enable2x (series bool)
enable3x (series bool)
o_control (series bool)
h_control (series bool)
l_control (series bool)
c_control (series bool)
extend_control (series bool)
only_show_the_lastone_control (series bool)
bg_control (series bool)
line_col_labeltext_col (series color)
bardata
Fields:
o (series float)
h (series float)
l (series float)
c (series float)
v (series float)
start_time (series int)
end_time (series int)
ma_setting
Fields:
day_control (series bool)
kline_numbers (series int)
ma_color (series color)
ema_color (series color)
rvwap_color (series color)
ma_control (series bool)
ema_control (series bool)
rvwap_control (series bool)
session (series string)
merge_label_template
Fields:
left_point (chart.point)
right_point (chart.point)
label_text (series string)
p (series float)
label_color (series color)
merge_init_false (series bool)
anchor_snapshots
Fields:
vwap_current (array)
vwap_historical (array)
bardata_current (array)
bardata_historical (array)
data_manager
Fields:
snapshots_map (map)
draw_settings_map (map)

MarketStructureLibrary "MarketStructure"
This library contains functions for identifying Lows and Highs in a rule-based way, and deriving useful information from them.
f_simpleLowHigh()
This function finds Local Lows and Highs, but NOT in order. A Local High is any candle that has its Low taken out on close by a subsequent candle (and vice-versa for Local Lows).
The Local High does NOT have to be the candle with the highest High out of recent candles. It does NOT have to be a Williams High. It is not necessarily a swing high or a reversal or anything else.
It doesn't have to be "the" high, so don't be confused.
By the rules, Local Lows and Highs must alternate. In this function they do not, so I'm calling them Simple Lows and Highs.
Simple Highs and Lows, by the above definition, can be useful for entries and stops. Because I intend to use them for stops, I want them all, not just the ones that alternate in strict order.
@param - there are no parameters. The function uses the chart OHLC.
@returns boolean values for whether this bar confirms a Simple Low/High, and ints for the bar_index of that Low/High.
f_localLowHigh()
This function finds Local Lows and Highs, in order. A Local High is any candle that has its Low taken out on close by a subsequent candle (and vice-versa for Local Lows).
The Local High does NOT have to be the candle with the highest High out of recent candles. It does NOT have to be a Williams High. It is not necessarily a swing high or a reversal or anything else.
By the rules, Local Lows and Highs must alternate, and in this function they do.
@param - there are no parameters. The function uses the chart OHLC.
@returns boolean values for whether this bar confirms a Local Low/High, and ints for the bar_index of that Low/High.
f_enhancedSimpleLowHigh()
This function finds Local Lows and Highs, but NOT in order. A Local High is any candle that has its Low taken out on close by a subsequent candle (and vice-versa for Local Lows).
The Local High does NOT have to be the candle with the highest High out of recent candles. It does NOT have to be a Williams High. It is not necessarily a swing high or a reversal or anything else.
By the rules, Local Lows and Highs must alternate. In this function they do not, so I'm calling them Simple Lows and Highs.
Simple Highs and Lows, by the above definition, can be useful for entries and stops. Because I intend to use them for trailing stops, I want them all, not just the ones that alternate in strict order.
The difference between this function and f_simpleLowHigh() is that it also tracks the lowest/highest recent level. This level can be useful for trailing stops.
In effect, these are like more "normal" highs and lows that you would pick by eye, but confirmed faster in many cases than by waiting for the low/high of that particular candle to be taken out on close,
because they are instead confirmed by ANY subsequent candle having its low/high exceeded. Hence, I call these Enhanced Simple Lows/Highs.
The levels are taken from the extreme highs/lows, but the bar indexes are given for the candles that were actually used to confirm the Low/High.
This is by design, because it might be misleading to label the extreme, since we didn't use that candle to confirm the Low/High..
@param - there are no parameters. The function uses the chart OHLC.
@returns - boolean values for whether this bar confirms an Enhanced Simple Low/High
ints for the bar_index of that Low/High
floats for the values of the recent high/low levels
floats for the trailing high/low levels (for debug/post-processing)
bools for market structure bias
f_trueLowHigh()
This function finds True Lows and Highs.
A True High is the candle with the highest recent high, which then has its low taken out on close by a subsequent candle (and vice-versa for True Lows).
The difference between this and an Enhanced High is that confirmation requires not just any Simple High, but confirmation of the very candle that has the highest high.
Because of this, confirmation is often later, and multiple Simple Highs and Lows can develop within ranges formed by a single big candle without any of them being confirmed. This is by design.
A True High looks like the intuitive "real high" when you look at the chart. True Lows and Highs must alternate.
@param - there are no parameters. The function uses the chart OHLC.
@returns - boolean values for whether this bar confirms an Enhanced Simple Low/High
ints for the bar_index of that Low/High
floats for the values of the recent high/low levels
floats for the trailing high/low levels (for debug/post-processing)
bools for market structure bias

Two MAs (nextSignals)Hi folks, just some quick work inspired by ThinkScript code from @stephenharlinmd (the Doc).
This indicator seems to be intended for lower timeframes (3 min was used for example), and indicates long and short opportunities based on crossovers of the two lines.
The slow reference line is an EMA20. The fast line is referred to as an "Instantaneous Moving Average", which attempts to use OHLC4 values to create a realtime reference line for price instead of a lagging average. Its calculation is as follows:
1. The OHLC4 value is calculated by taking the average of the open, high, low, and close prices for each bar.
2. The ta.highest function is used to find the highest value of OHLC4 over the last 5 bars, and this value is stored in the ON variable.
3. The ta.lowest function is used to find the lowest value of ON over the last 5 bars, and this value is stored in the O1 variable.
4. The for loop is used to find the index of O1 in the P data series, which represents the OHLC4 values over the last 6 bars. If the value at the current index is equal to O1, and O1Loc has not already been set, then O1Loc is set to the current index.
5. The O2 variable is initialized to ON, and another for loop is used to find the index of the second lowest value of OHLC4 over the last 6 bars, which is not at the same index as O1. If the value at the current index is equal to O2, and O2Loc has not already been set, and the current index is not equal to O1Loc, then O2Loc is set to the current index.
6. The O3 variable is initialized to ON, and another for loop is used to find the minimum value of OHLC4 over the last 6 bars, excluding the values at the indices of O1 and O2. If the current index is not equal to O1Loc or O2Loc, then the minimum of the current value of O3 and the value at the current index of P is stored in O3.
7. Finally, the "IMA" variable is set to the value of O3, which represents the "IMA" over the last 6 bars.

Priceit plots
ema - you can choose length
it plots a custom price say x
it plots price x*factors >
1.0005* price
1.001* price
0.9995* price
0.999* price
1.002* price
1.004* price
1.006* price
1.008* price
1.010* price
1.012* price
you can edit these , the scrip is open source
it plots ohlc4 and ohlc4* factors
1.0005* ohlc4
1.001* ohlc4
0.9995* ohlc4
0.999* ohlc4
you can edit these , the scrip is open source
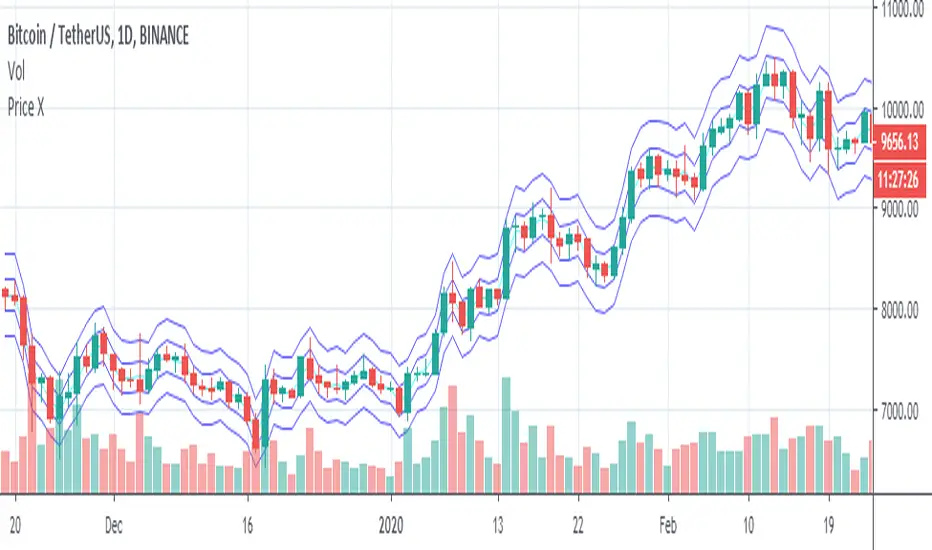
ootaLibrary "oota"
Collection of all custom and enhanced TA indicators - Object oriented methods implementation
method tr(c, useTrueRange)
returns true range of the candle
Namespace types: Candle
Parameters:
c (Candle) : Candle object containing ohlc data
useTrueRange (bool) : Use true range for atr calculation instead of just high/low difference
method ma(maType, length, source)
returns custom moving averages
Namespace types: simple CustomSeries
Parameters:
maType (simple CustomSeries) : Custom series type
length (simple int) : Moving Average Length
source (float) : Moving Average Source
Returns: moving average for the given type and length
method atr(maType, length, useTrueRange, c)
returns ATR with custom moving average
Namespace types: simple CustomSeries
Parameters:
maType (simple CustomSeries) : Custom series type
length (simple int) : Moving Average Length
useTrueRange (bool) : Use true range for atr calculation instead of just high/low difference
c (Candle) : Candle object containing ohlc
Returns: ATR for the given moving average type and length
method atrpercent(maType, length, useTrueRange, c)
returns ATR as percentage of close price
Namespace types: simple CustomSeries
Parameters:
maType (simple CustomSeries) : Custom series type
length (simple int) : Moving Average Length
useTrueRange (bool) : Use true range for atr calculation instead of just high/low difference
c (Candle) : Candle object containing ohlc
Returns: ATR as percentage of close price for the given moving average type and length
method bb(maType, length, multiplier, sticky, c)
returns Bollinger band for custom moving average
Namespace types: simple CustomSeries
Parameters:
maType (simple CustomSeries) : Custom series type
length (simple int) : Moving Average Length
multiplier (float) : Standard Deviation multiplier
sticky (simple bool) : - sticky boundaries which will only change when value is outside boundary.
c (Candle) : Candle object containing ohlc
Returns: Bollinger band with custom moving average for given source, length and multiplier
method bbw(maType, length, multiplier, sticky, c)
returns Bollinger bandwidth for custom moving average
Namespace types: simple CustomSeries
Parameters:
maType (simple CustomSeries) : Custom series type
length (simple int) : Moving Average Length
multiplier (float) : Standard Deviation multiplier
sticky (simple bool) : sticky boundaries which will only change when value is outside boundary.
c (Candle) : Candle object containing ohlc
Returns: Bollinger Bandwidth for custom moving average for given source, length and multiplier
method bpercentb(maType, length, multiplier, sticky, c)
returns Bollinger Percent B for custom moving average
Namespace types: simple CustomSeries
Parameters:
maType (simple CustomSeries) : Custom series type
length (simple int) : Moving Average Length
multiplier (float) : Standard Deviation multiplier
sticky (simple bool) : - sticky boundaries which will only change when value is outside boundary.
c (Candle) : Candle object containing ohlc
Returns: Bollinger Percent B for custom moving average for given source, length and multiplier
method kc(maType, length, multiplier, useTrueRange, sticky, c)
returns Keltner Channel for custom moving average
Namespace types: simple CustomSeries
Parameters:
maType (simple CustomSeries) : Custom series type
length (simple int) : Moving Average Length
multiplier (float) : Standard Deviation multiplier
useTrueRange (simple bool) : - if set to false, uses high-low.
sticky (simple bool) : - sticky boundaries which will only change when value is outside boundary.
c (Candle) : Candle object containing ohlc
Returns: Keltner Channel for custom moving average for given souce, length and multiplier
method kcw(maType, length, multiplier, useTrueRange, sticky, c)
returns Keltner Channel Width with custom moving average
Namespace types: simple CustomSeries
Parameters:
maType (simple CustomSeries) : Custom series type
length (simple int) : Moving Average Length
multiplier (float) : Standard Deviation multiplier
useTrueRange (simple bool) : - if set to false, uses high-low.
sticky (simple bool) : - sticky boundaries which will only change when value is outside boundary.
c (Candle) : Candle object containing ohlc
Returns: Keltner Channel Width for custom moving average
method kpercentk(maType, length, multiplier, useTrueRange, sticky, c)
returns Keltner Channel Percent K Width with custom moving average
Namespace types: simple CustomSeries
Parameters:
maType (simple CustomSeries) : Custom series type
length (simple int) : Moving Average Length
multiplier (float) : Standard Deviation multiplier
useTrueRange (simple bool) : - if set to false, uses high-low.
sticky (simple bool) : - sticky boundaries which will only change when value is outside boundary.
c (Candle) : Candle object containing ohlc
Returns: Keltner Percent K for given moving average, source, length and multiplier
method dc(c, length, sticky)
returns Custom Donchian Channel
Namespace types: Candle
Parameters:
c (Candle) : Candle object containing ohlc
length (simple int) : - donchian channel length
sticky (simple bool) : - sticky boundaries which will only change when value is outside boundary.
Returns: Donchian channel
method dcw(c, length, sticky)
returns Donchian Channel Width
Namespace types: Candle
Parameters:
c (Candle) : Candle object containing ohlc
length (simple int) : - donchian channel length
sticky (simple bool) : - sticky boundaries which will only change when value is outside boundary.
Returns: Donchian channel width
method dpercentd(c, length, sticky)
returns Donchian Channel Percent of price
Namespace types: Candle
Parameters:
c (Candle) : Candle object containing ohlc
length (simple int) : - donchian channel length
sticky (simple bool) : - sticky boundaries which will only change when value is outside boundary.
Returns: Donchian channel Percent D
method supertrend(maType, length, multiplier, useTrueRange, waitForClose, delayed, c)
supertrend Simple supertrend based on atr but also takes into consideration of custom MA Type, sources
Namespace types: simple CustomSeries
Parameters:
maType (simple CustomSeries) : Custom Series
length (simple int) : ATR Length
multiplier (simple float) : ATR Multiplier
useTrueRange (simple bool) : - if set to false, uses high-low.
waitForClose (simple bool) : : Considers source for direction change crossover if checked. Else, uses highSource and lowSource.
delayed (simple bool) : : if set to true lags supertrend atr stop based on target levels.
c (Candle) : Candle object containing ohlc
Returns: dir : Supertrend direction
supertrend : BuyStop if direction is 1 else SellStop
method oscillatorRange(seriesType, source, highlowLength, rangeLength, sticky)
oscillatorRange - returns Custom overbought/oversold areas for an oscillator input
Namespace types: simple CustomSeries
Parameters:
seriesType (simple CustomSeries) : - Custom series type
source (float) : - Osillator source such as RSI, COG etc.
highlowLength (simple int) : - length on which highlow of the oscillator is calculated
rangeLength (simple int) : - length used for calculating oversold/overbought range - usually same as oscillator length
sticky (simple bool) : - overbought, oversold levels won't change unless crossed
Returns: Dynamic overbought and oversold range for oscillator input
method oscillator(oscillatorType, length, shortLength, longLength, c)
oscillator - returns Choice of oscillator with custom overbought/oversold range
Namespace types: simple OscillatorType
Parameters:
oscillatorType (simple OscillatorType) : OscillatorType object
length (simple int) : - Oscillator length - not used for TSI
shortLength (simple int) : - shortLength only used for TSI
longLength (simple int) : - longLength only used for TSI
c (Candle) : Candle object containing ohlc
Returns: Oscillator value
method oscillatorWithRange(oscillatorType, length, shortLength, longLength, seriesType, highlowLength, sticky, c)
oscillatorWithRange - returns Choice of oscillator with custom overbought/oversold range
Namespace types: simple OscillatorType
Parameters:
oscillatorType (simple OscillatorType) : OscillatorType object
length (simple int) : - Oscillator length - not used for TSI
shortLength (simple int) : - shortLength only used for TSI
longLength (simple int) : - longLength only used for TSI
seriesType (simple CustomSeries) : - CustomSeries enum type
highlowLength (simple int) : - length on which highlow of the oscillator is calculated
sticky (simple bool) : - overbought, oversold levels won't change unless crossed
c (Candle) : Candle object containing ohlc
Returns: Oscillator value along with dynamic overbought and oversold range for oscillator input
Candle
Custom candle object
Fields:
o (series float) : open
h (series float) : high
l (series float) : low
c (series float) : close
barindex (series int) : bar_index
bartime (series int) : time
bartimeclose (series int) : time_close
v (series float) : volume
Three Anchored Moving Averages (VWAP / SMA / EMA)
This indicator allows users to anchor three types of moving averages (Simple Moving Average (SMA), Exponential Moving Average (EMA), and Volume Weighted Average Price (VWAP)) to specific points in time (anchor points)
Key Features:
Select from three Moving Average Types:
Simple Moving Average (SMA): Averages the closing prices over a specified period.
Exponential Moving Average (EMA): Gives more weight to recent prices, making it more responsive to new information.
Volume Weighted Average Price (VWAP): Averages the price weighted by volume, useful for understanding the average price at which the asset has traded over a period.
Up to Three Anchor Points:
Users can set up to three different anchor points to calculate the moving averages from specific dates and times. This allows for analysis of price action starting from significant points or specific events. For example, you can anchor to the low and high of a move to identify key levels or to points where the price takes off from a previous anchored MA.
Customisable Sentiment Options:
Each anchor point can be associated with a sentiment input (Auto, Bull, Bear, None), which influences if the MAs are displayed as lines or zones/bands:
Auto: Automatically determines the sentiment based on whether anchor points are on pivot highs and lows. If anchored to a pivot high, the system will assume a bearish sentiment and display a red band or zone between the MA OHLC4 and High. Anchoring to a pivot low will display a green band (OHLC4 - Low).
Bull: Forces a bullish sentiment (Green Band - OHLC4 to Low)
Bear: Forces a bearish sentiment (Red Band - OHLC4 to High)
None: Ignores sentiment and displays a single line (OHLC4)
Chart Matching:
The indicator includes an option to display the moving averages only if the chart symbol matches a specified ticker. This feature ensures that the indicator is relevant to the specific asset being analysed.
How to Use the Indicator:
1. Set Anchor Points: When added to your chart, select three anchor points by point and click. If you only wish to anchor to a single point, click on that point three times and disable the other two in settings once the indicator is applied.
2. Select Moving Average Type: Choose between SMA, EMA, or VWAP using the dropdown menu. EMAs are the most responsive.
3. Enable/Disable Anchor Points: Use the checkboxes to enable or disable each anchor point.
4. Select Sentiment Type: Choose between Auto, Bull, Bear, or None.
5. Chart Matching: Optionally, specify a chart symbol to restrict the indicator's display to that particular asset.
6. Interpret the Plots: The indicator plots the high, mid, and low values of the selected moving average type from each anchor point. The fills between these plots help identify potential support and resistance zones. These should be used as points of interest for pullback reversals or potential continuation if the price breaks through.
Practical Applications:
Trend Analysis: Identify the overall trend direction from specific historical points.
Support and Resistance: Determine key dynamic support and resistance levels based on anchored moving averages.
Event-Based Analysis: Anchor the moving averages to significant events (e.g., earnings releases, economic data) to study their impact on price trends.
Multi Timeframe Analysis: Higher Timeframe Anchors can be used to identify longer term trend analysis. Switching to a lower timeframe for execution triggers at these points wont distort the MA levels as they are anchored to a specific point in time
Intraday or Swing Trading: trend analysis using anchor points can be used for any style of trading (Intraday / Swing / Invest). Use anchored levels as points of interest and wait for hints in price action to try and catch the next move.

mZigzagLibrary "mZigzag"
Matrix implementation of zigzag to allow further possibilities.
Main advantage of this library over previous zigzag methods is that you can attach any number of indicator/oscillator information to zigzag
calculate(length, ohlc, indicatorHigh, indicatorLow, numberOfPivots) calculates zigzag and related information
Parameters:
length : is zigzag length
ohlc : array of OHLC values to be used for zigzag calculation
indicatorHigh : Array of indicator values calculated based on high price of OHLC
indicatorLow : Array of indicators values calculated based on low price of OHLC
numberOfPivots : Number of pivots to be returned
Returns: pivotMatrix Matrix containing zigzag pivots, pivot bars, direction, ratio, and indicators added via indicatorHigh/indicatorLow
newZG is true if a new pivot is added to array
doubleZG is true if last calculation returned two new pivots (Happens on extreme price change)
draw(length, ohlc, indicatorLabels, indicatorHigh, indicatorLow, numberOfPivots, lineColor, lineWidth, lineStyle, showHighLow, showRatios, showIndicators) draws zigzag and related information
Parameters:
length : is zigzag length
ohlc : array of OHLC values to be used for zigzag calculation
indicatorLabels : Array of name of indicators passed
indicatorHigh : Array of indicator values calculated based on high price of OHLC
indicatorLow : Array of indicators values calculated based on low price of OHLC
numberOfPivots : Number of pivots to be returned
lineColor : zigzag line color. set to blue by default
lineWidth : zigzag line width. set to 1 by default
lineStyle : zigzag line style. set to line.style_solid by default
showHighLow : show HH, HL, LH, LL labels
showRatios : show pivot retracement ratios from previous zigzag
showIndicators : show indicator values
Returns: pivotMatrix Matrix containing zigzag pivots, pivot bars, direction, ratio, and indicators added via indicatorHigh/indicatorLow
zigzaglines array of zigzag lines
zigzaglabels array of zigzag labels
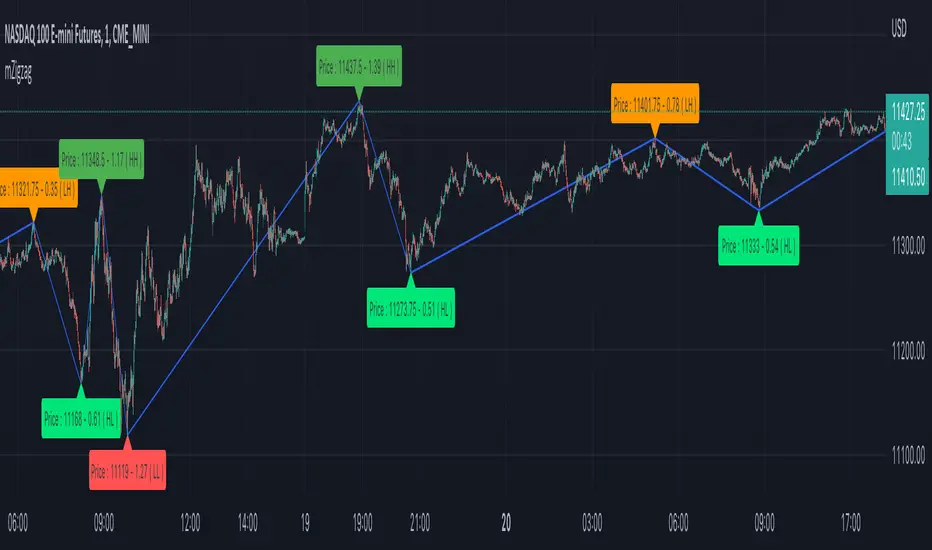
Uncertainty IndicatorThis indicator try to show the amount on uncertainty that exist by plotting a 3-days
moving average of the difference between the 'close' and 'ohlc4',
which is compared to a 20-days Bollinger Band with a standard deviation of one.
This menas that when the 3-day curve is above the upper limit, the Uncetainty is
higher than it has been during 84% of the last 20 day period (and vice versa for
the lower limit).
By using Open,High,Low,Close you get four opinions of what the price should be for
the current period. If there is a difference between 'close' and 'ohlc4' there seem
to exist an uncertainty if the closing price is correct.
Can we say anything about direction? I don't think so; either the 'close king' has
to listen to its 'people' and move toward 'ohlc4', or the other way around.
A way to see if the uncertainty increases over time could be to see if:
abs(close - ohlc4 ) < abs(close - ohlc4) ,which say that we are more uncertain
this period than the in previous one.
And I guess, with increased uncertainty comes 'fear' of loosing money.

ZigzagLiteLibrary "ZigzagLite"
Lighter version of the Zigzag Library. Without indicators and sub-component divisions
method getPrices(pivots)
Gets the array of prices from array of Pivots
Namespace types: Pivot
Parameters:
pivots (Pivot ) : array array of Pivot objects
Returns: array array of pivot prices
method getBars(pivots)
Gets the array of bars from array of Pivots
Namespace types: Pivot
Parameters:
pivots (Pivot ) : array array of Pivot objects
Returns: array array of pivot bar indices
method getPoints(pivots)
Gets the array of chart.point from array of Pivots
Namespace types: Pivot
Parameters:
pivots (Pivot ) : array array of Pivot objects
Returns: array array of pivot points
method getPoints(this)
Namespace types: Zigzag
Parameters:
this (Zigzag)
method calculate(this, ohlc, ltfHighTime, ltfLowTime)
Calculate zigzag based on input values and indicator values
Namespace types: Zigzag
Parameters:
this (Zigzag) : Zigzag object
ohlc (float ) : Array containing OHLC values. Can also have custom values for which zigzag to be calculated
ltfHighTime (int) : Used for multi timeframe zigzags when called within request.security. Default value is current timeframe open time.
ltfLowTime (int) : Used for multi timeframe zigzags when called within request.security. Default value is current timeframe open time.
Returns: current Zigzag object
method calculate(this)
Calculate zigzag based on properties embedded within Zigzag object
Namespace types: Zigzag
Parameters:
this (Zigzag) : Zigzag object
Returns: current Zigzag object
method nextlevel(this)
Namespace types: Zigzag
Parameters:
this (Zigzag)
method clear(this)
Clears zigzag drawings array
Namespace types: ZigzagDrawing
Parameters:
this (ZigzagDrawing ) : array
Returns: void
method clear(this)
Clears zigzag drawings array
Namespace types: ZigzagDrawingPL
Parameters:
this (ZigzagDrawingPL ) : array
Returns: void
method drawplain(this)
draws fresh zigzag based on properties embedded in ZigzagDrawing object without trying to calculate
Namespace types: ZigzagDrawing
Parameters:
this (ZigzagDrawing) : ZigzagDrawing object
Returns: ZigzagDrawing object
method drawplain(this)
draws fresh zigzag based on properties embedded in ZigzagDrawingPL object without trying to calculate
Namespace types: ZigzagDrawingPL
Parameters:
this (ZigzagDrawingPL) : ZigzagDrawingPL object
Returns: ZigzagDrawingPL object
method drawfresh(this, ohlc)
draws fresh zigzag based on properties embedded in ZigzagDrawing object
Namespace types: ZigzagDrawing
Parameters:
this (ZigzagDrawing) : ZigzagDrawing object
ohlc (float ) : values on which the zigzag needs to be calculated and drawn. If not set will use regular OHLC
Returns: ZigzagDrawing object
method drawcontinuous(this, ohlc)
draws zigzag based on the zigzagmatrix input
Namespace types: ZigzagDrawing
Parameters:
this (ZigzagDrawing) : ZigzagDrawing object
ohlc (float ) : values on which the zigzag needs to be calculated and drawn. If not set will use regular OHLC
Returns:
PivotCandle
PivotCandle represents data of the candle which forms either pivot High or pivot low or both
Fields:
_high (series float) : High price of candle forming the pivot
_low (series float) : Low price of candle forming the pivot
length (series int) : Pivot length
pHighBar (series int) : represents number of bar back the pivot High occurred.
pLowBar (series int) : represents number of bar back the pivot Low occurred.
pHigh (series float) : Pivot High Price
pLow (series float) : Pivot Low Price
Pivot
Pivot refers to zigzag pivot. Each pivot can contain various data
Fields:
point (chart.point) : pivot point coordinates
dir (series int) : direction of the pivot. Valid values are 1, -1, 2, -2
level (series int) : is used for multi level zigzags. For single level, it will always be 0
ratio (series float) : Price Ratio based on previous two pivots
sizeRatio (series float)
ZigzagFlags
Flags required for drawing zigzag. Only used internally in zigzag calculation. Should not set the values explicitly
Fields:
newPivot (series bool) : true if the calculation resulted in new pivot
doublePivot (series bool) : true if the calculation resulted in two pivots on same bar
updateLastPivot (series bool) : true if new pivot calculated replaces the old one.
Zigzag
Zigzag object which contains whole zigzag calculation parameters and pivots
Fields:
length (series int) : Zigzag length. Default value is 5
numberOfPivots (series int) : max number of pivots to hold in the calculation. Default value is 20
offset (series int) : Bar offset to be considered for calculation of zigzag. Default is 0 - which means calculation is done based on the latest bar.
level (series int) : Zigzag calculation level - used in multi level recursive zigzags
zigzagPivots (Pivot ) : array which holds the last n pivots calculated.
flags (ZigzagFlags) : ZigzagFlags object which is required for continuous drawing of zigzag lines.
ZigzagObject
Zigzag Drawing Object
Fields:
zigzagLine (series line) : Line joining two pivots
zigzagLabel (series label) : Label which can be used for drawing the values, ratios, directions etc.
ZigzagProperties
Object which holds properties of zigzag drawing. To be used along with ZigzagDrawing
Fields:
lineColor (series color) : Zigzag line color. Default is color.blue
lineWidth (series int) : Zigzag line width. Default is 1
lineStyle (series string) : Zigzag line style. Default is line.style_solid.
showLabel (series bool) : If set, the drawing will show labels on each pivot. Default is false
textColor (series color) : Text color of the labels. Only applicable if showLabel is set to true.
maxObjects (series int) : Max number of zigzag lines to display. Default is 300
xloc (series string) : Time/Bar reference to be used for zigzag drawing. Default is Time - xloc.bar_time.
curved (series bool) : Boolean field to print curved zigzag - used only with polyline implementation
ZigzagDrawing
Object which holds complete zigzag drawing objects and properties.
Fields:
zigzag (Zigzag) : Zigzag object which holds the calculations.
properties (ZigzagProperties) : ZigzagProperties object which is used for setting the display styles of zigzag
drawings (ZigzagObject ) : array which contains lines and labels of zigzag drawing.
ZigzagDrawingPL
Object which holds complete zigzag drawing objects and properties - polyline version
Fields:
zigzag (Zigzag) : Zigzag object which holds the calculations.
properties (ZigzagProperties) : ZigzagProperties object which is used for setting the display styles of zigzag
zigzagLabels (label )
zigzagLine (series polyline) : polyline object of zigzag lines

ZigzagLibrary "Zigzag"
Zigzag related user defined types. Depends on DrawingTypes library for basic types
method tostring(this, sortKeys, sortOrder, includeKeys)
Converts ZigzagTypes/Pivot object to string representation
Namespace types: Pivot
Parameters:
this (Pivot) : ZigzagTypes/Pivot
sortKeys (bool) : If set to true, string output is sorted by keys.
sortOrder (int) : Applicable only if sortKeys is set to true. Positive number will sort them in ascending order whreas negative numer will sort them in descending order. Passing 0 will not sort the keys
includeKeys (string ) : Array of string containing selective keys. Optional parmaeter. If not provided, all the keys are considered
Returns: string representation of ZigzagTypes/Pivot
method tostring(this, sortKeys, sortOrder, includeKeys)
Converts Array of Pivot objects to string representation
Namespace types: Pivot
Parameters:
this (Pivot ) : Pivot object array
sortKeys (bool) : If set to true, string output is sorted by keys.
sortOrder (int) : Applicable only if sortKeys is set to true. Positive number will sort them in ascending order whreas negative numer will sort them in descending order. Passing 0 will not sort the keys
includeKeys (string ) : Array of string containing selective keys. Optional parmaeter. If not provided, all the keys are considered
Returns: string representation of Pivot object array
method tostring(this)
Converts ZigzagFlags object to string representation
Namespace types: ZigzagFlags
Parameters:
this (ZigzagFlags) : ZigzagFlags object
Returns: string representation of ZigzagFlags
method tostring(this, sortKeys, sortOrder, includeKeys)
Converts ZigzagTypes/Zigzag object to string representation
Namespace types: Zigzag
Parameters:
this (Zigzag) : ZigzagTypes/Zigzagobject
sortKeys (bool) : If set to true, string output is sorted by keys.
sortOrder (int) : Applicable only if sortKeys is set to true. Positive number will sort them in ascending order whreas negative numer will sort them in descending order. Passing 0 will not sort the keys
includeKeys (string ) : Array of string containing selective keys. Optional parmaeter. If not provided, all the keys are considered
Returns: string representation of ZigzagTypes/Zigzag
method calculate(this, ohlc, indicators, indicatorNames)
Calculate zigzag based on input values and indicator values
Namespace types: Zigzag
Parameters:
this (Zigzag) : Zigzag object
ohlc (float ) : Array containing OHLC values. Can also have custom values for which zigzag to be calculated
indicators (matrix) : Array of indicator values
indicatorNames (string ) : Array of indicator names for which values are present. Size of indicators array should be equal to that of indicatorNames
Returns: current Zigzag object
method calculate(this)
Calculate zigzag based on properties embedded within Zigzag object
Namespace types: Zigzag
Parameters:
this (Zigzag) : Zigzag object
Returns: current Zigzag object
method nextlevel(this)
Calculate Next Level Zigzag based on the current calculated zigzag object
Namespace types: Zigzag
Parameters:
this (Zigzag) : Zigzag object
Returns: Next Level Zigzag object
method clear(this)
Clears zigzag drawings array
Namespace types: ZigzagDrawing
Parameters:
this (ZigzagDrawing ) : array
Returns: void
method drawplain(this)
draws fresh zigzag based on properties embedded in ZigzagDrawing object without trying to calculate
Namespace types: ZigzagDrawing
Parameters:
this (ZigzagDrawing) : ZigzagDrawing object
Returns: ZigzagDrawing object
method drawfresh(this, ohlc, indicators, indicatorNames)
draws fresh zigzag based on properties embedded in ZigzagDrawing object
Namespace types: ZigzagDrawing
Parameters:
this (ZigzagDrawing) : ZigzagDrawing object
ohlc (float ) : values on which the zigzag needs to be calculated and drawn. If not set will use regular OHLC
indicators (matrix) : Array of indicator values
indicatorNames (string ) : Array of indicator names for which values are present. Size of indicators array should be equal to that of indicatorNames
Returns: ZigzagDrawing object
method drawcontinuous(this, ohlc, indicators, indicatorNames)
draws zigzag based on the zigzagmatrix input
Namespace types: ZigzagDrawing
Parameters:
this (ZigzagDrawing) : ZigzagDrawing object
ohlc (float ) : values on which the zigzag needs to be calculated and drawn. If not set will use regular OHLC
indicators (matrix) : Array of indicator values
indicatorNames (string ) : Array of indicator names for which values are present. Size of indicators array should be equal to that of indicatorNames
Returns:
method getPrices(pivots)
Namespace types: Pivot
Parameters:
pivots (Pivot )
method getBars(pivots)
Namespace types: Pivot
Parameters:
pivots (Pivot )
Indicator
Indicator is collection of indicator values applied on high, low and close
Fields:
indicatorHigh (series float) : Indicator Value applied on High
indicatorLow (series float) : Indicator Value applied on Low
PivotCandle
PivotCandle represents data of the candle which forms either pivot High or pivot low or both
Fields:
_high (series float) : High price of candle forming the pivot
_low (series float) : Low price of candle forming the pivot
length (series int) : Pivot length
pHighBar (series int) : represents number of bar back the pivot High occurred.
pLowBar (series int) : represents number of bar back the pivot Low occurred.
pHigh (series float) : Pivot High Price
pLow (series float) : Pivot Low Price
indicators (Indicator ) : Array of Indicators - allows to add multiple
Pivot
Pivot refers to zigzag pivot. Each pivot can contain various data
Fields:
point (chart.point) : pivot point coordinates
dir (series int) : direction of the pivot. Valid values are 1, -1, 2, -2
level (series int) : is used for multi level zigzags. For single level, it will always be 0
componentIndex (series int) : is the lower level zigzag array index for given pivot. Used only in multi level Zigzag Pivots
subComponents (series int) : is the number of sub waves per each zigzag wave. Only applicable for multi level zigzags
microComponents (series int) : is the number of base zigzag components in a zigzag wave
ratio (series float) : Price Ratio based on previous two pivots
sizeRatio (series float)
subPivots (Pivot )
indicatorNames (string ) : Names of the indicators applied on zigzag
indicatorValues (float ) : Values of the indicators applied on zigzag
indicatorRatios (float ) : Ratios of the indicators applied on zigzag based on previous 2 pivots
ZigzagFlags
Flags required for drawing zigzag. Only used internally in zigzag calculation. Should not set the values explicitly
Fields:
newPivot (series bool) : true if the calculation resulted in new pivot
doublePivot (series bool) : true if the calculation resulted in two pivots on same bar
updateLastPivot (series bool) : true if new pivot calculated replaces the old one.
Zigzag
Zigzag object which contains whole zigzag calculation parameters and pivots
Fields:
length (series int) : Zigzag length. Default value is 5
numberOfPivots (series int) : max number of pivots to hold in the calculation. Default value is 20
offset (series int) : Bar offset to be considered for calculation of zigzag. Default is 0 - which means calculation is done based on the latest bar.
level (series int) : Zigzag calculation level - used in multi level recursive zigzags
zigzagPivots (Pivot ) : array which holds the last n pivots calculated.
flags (ZigzagFlags) : ZigzagFlags object which is required for continuous drawing of zigzag lines.
ZigzagObject
Zigzag Drawing Object
Fields:
zigzagLine (series line) : Line joining two pivots
zigzagLabel (series label) : Label which can be used for drawing the values, ratios, directions etc.
ZigzagProperties
Object which holds properties of zigzag drawing. To be used along with ZigzagDrawing
Fields:
lineColor (series color) : Zigzag line color. Default is color.blue
lineWidth (series int) : Zigzag line width. Default is 1
lineStyle (series string) : Zigzag line style. Default is line.style_solid.
showLabel (series bool) : If set, the drawing will show labels on each pivot. Default is false
textColor (series color) : Text color of the labels. Only applicable if showLabel is set to true.
maxObjects (series int) : Max number of zigzag lines to display. Default is 300
xloc (series string) : Time/Bar reference to be used for zigzag drawing. Default is Time - xloc.bar_time.
ZigzagDrawing
Object which holds complete zigzag drawing objects and properties.
Fields:
zigzag (Zigzag) : Zigzag object which holds the calculations.
properties (ZigzagProperties) : ZigzagProperties object which is used for setting the display styles of zigzag
drawings (ZigzagObject ) : array which contains lines and labels of zigzag drawing.
