RSI Swing Indicator (with HL + LL Alerts — FIXED v5)This indicator identifies swing highs and lows based on RSI extremes (overbought and oversold zones). It automatically labels:
So you can easily spot hidden bullish divergences.
It also draws swing lines connecting these points for visual trend analysis. Alerts are triggered specifically on HL & LL formations, which often signal potential bullish continuation.
HH (Higher High) – price moves higher than the previous swing high
LH (Lower High) – price forms a lower high
HL (Higher Low) – price forms a higher low
LL (Lower Low) – price forms a lower low
Поиск скриптов по запросу "Rsi"

RSI + 55 EMA + Volume (SL Marked, No Engulfing)This is to help entering in trades by considering 50 EMA and RSI indicators, Volume is used for confirmations

Multi-Timeframe RSI (4x) z Podświetlaniem - PawełRSI z podświetleniem z różnych tfów z ustawianiem intensywnosci i kolorów.

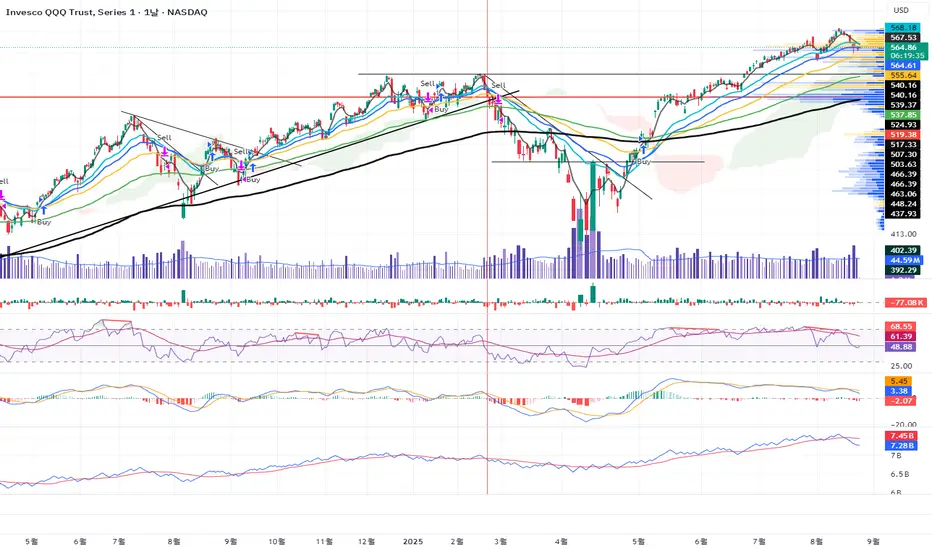
RSI BREAKOUT SIGNALSThis BB + RSI Breakout indicator is designed to help traders identify potential buy and sell opportunities based on price movements relative to the Donchian channel (or Bollinger-type channel) and momentum conditions. It calculates the highest high and lowest low over a user-defined length to form a dynamic channel, and then it checks whether the current price breaks above the upper band (for a buy signal) or below the lower band (for a sell signal). To avoid repeated signals in a row, the indicator uses a state system: after a buy signal occurs, it will not generate another buy until a sell occurs, and vice versa. When a buy signal is triggered, it automatically calculates a take-profit price a certain percentage above the buy candle and displays this price below the candle as a “TP” label. Sell signals are displayed above the candle, and any previous TP label is cleared. The indicator updates in real time, so the signals move with the chart, giving a clear and lag-free visualization of entry points and potential profit targets.

RSI Swing Indicator (with HL Alert)This indicator identifies swing highs and lows based on RSI extremes (overbought and oversold zones). It automatically labels:
HH (Higher High) – price moves higher than the previous swing high
LH (Lower High) – price forms a lower high
HL (Higher Low) – price forms a higher low
LL (Lower Low) – price forms a lower low
It also draws swing lines connecting these points for visual trend analysis. Alerts are triggered specifically on HL formations, which often signal potential bullish continuation.


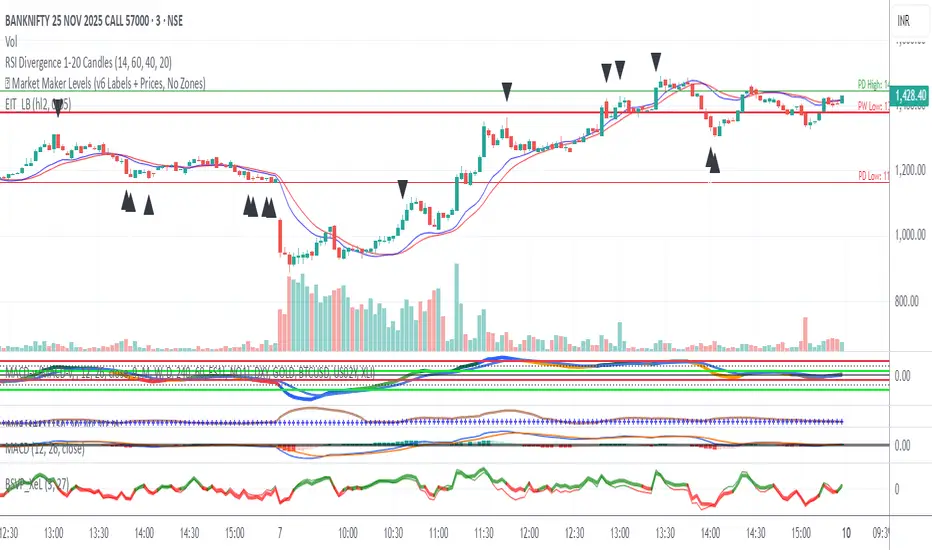
RSI Divergence 1-20 Candlesthis is a rsi divergence indicator used to mark divergence on the candle for knowing the trend
RSI Heatmap (≤35 Highlight)Highlights when RSI is less than or equal to 35 which can signal a potential reversal soon.


Element Squared RSI Divergence IndicatorRSI Divergence indicator developed by the team at Element Squared Private Wealth.

CK Trading RSIRSI with colour-coded areas for accumulation, BUY, take profit and SELL zones. Ideally, it can be used on the 8-hour chart over a longer period of time.


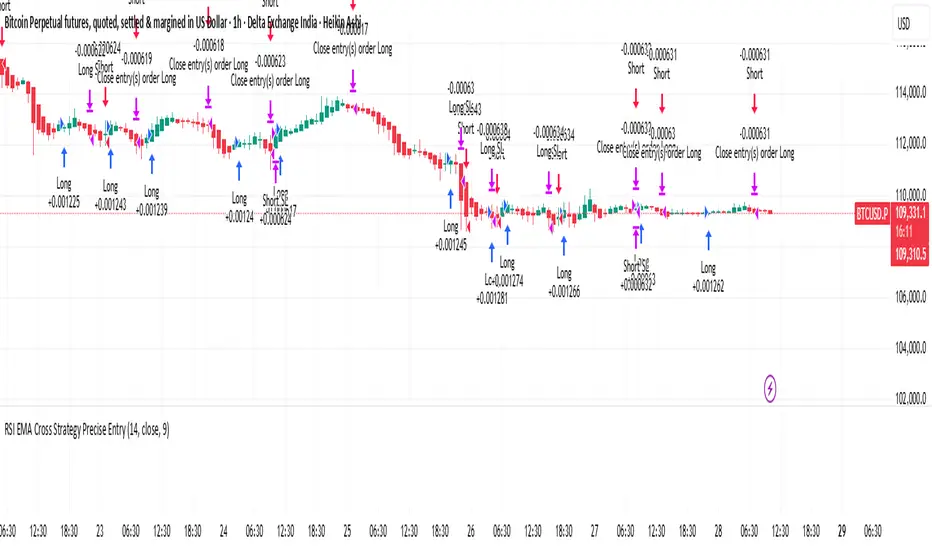
RSI Cross Strategy Precise EntryThis is based on RSI movement. it generates buy and sell signals precisely
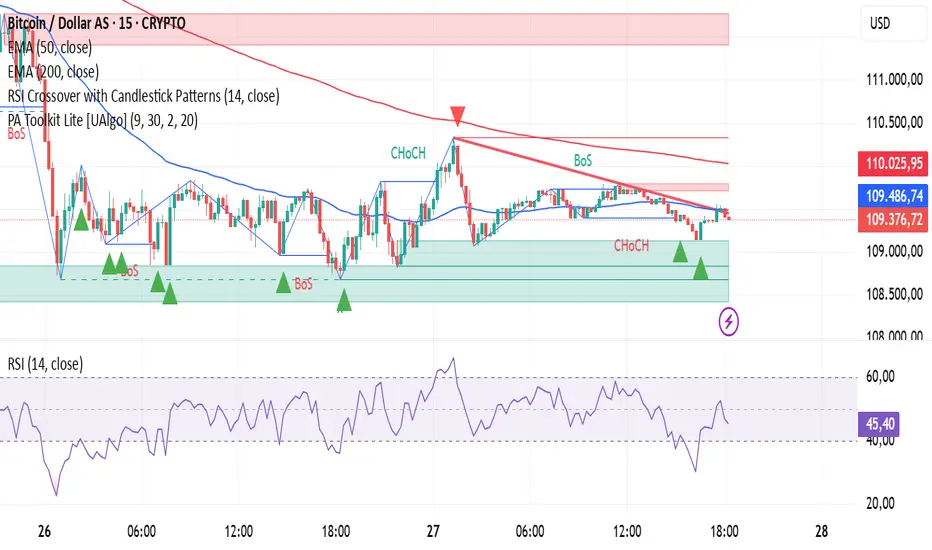
RSI Crossover with Candlestick Patternsusing the RSI indicator levels 40 and 60, where the signal cuts above level 40 with a candlestick hammer or bull engulfing and cuts below level 60 with a candlestick inverter hammer or bearish engulfing.
RSI Custom Crossermarks custom RSI cross upwards. Just to help identify wherever there is crossover. It can be used for analysis of psi. Not a strategy

RSI DivergenceThe code originally belongs to Matthew J. Slabosz, the founder of Zen Trading (The Art of Trading). ✍️📈
👉 My contribution and improvement was adding a divergence line directly on the RSI chart.
Why? Because most people can’t confirm correctness just by reading the code. 🧑💻❌
They need to see it with their own eyes 👀✔️ — this prevents misinterpretation and makes divergences crystal clear.
✨ By adding these visual confirmations, the efficiency and usability of the code has been significantly enhanced. 🚀📊

RSI with KAMA and Custom Buy/Sell SignalsUses Kaufman MA on the RSI to generate signals when crossing user thresholds

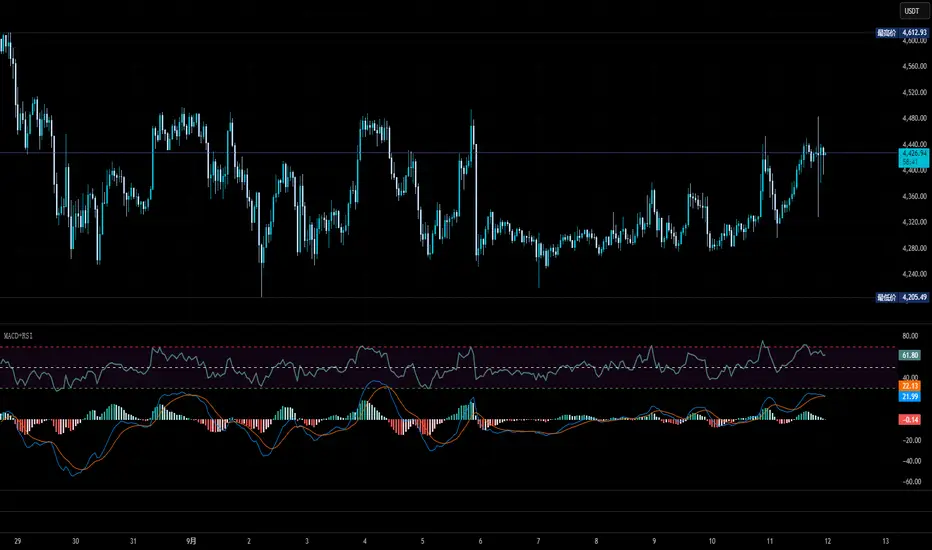
RSI-MACD-trade"Strategic trading strategy using RSI and MASCD
Highest returns when applied to weekly charts"
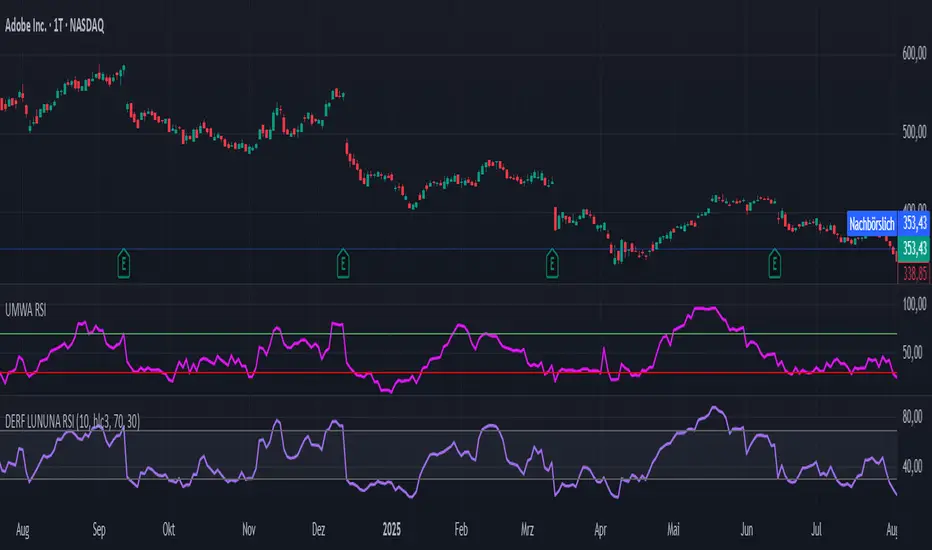
DERF LUNUNA RSIRSI for my needs. I adjusted it for my own trading habits. If you are interested feel free to use it.
RSI Diode PanelA small and clean RSI panel that simultaneously shows the 15m, 30m, 1h, 2h, 4h, and 1d timeframes, which can help you with basic trend orientation.

RSI (14) with Auto Zone Colors — Overbought/Oversold HighlighterThis indicator plots the Relative Strength Index (RSI 14) with dynamic color changes for instant visual clarity:
✅ Green line in overbought zone (≥70)
✅ Red line in oversold zone (≤30)
✅ White line in neutral range (30–70)
Includes reference lines at 70, 50, and 30 for quick decision-making. Perfect for spotting momentum extremes, divergences, and potential reversal points without squinting at numbers. Works on any timeframe.
