Price Action IndexI've created a simple oscillator which I think does a good job of easily showing you when price is worth watching or not. I think all too often you get stuck looking at something like an RSI and end up trading noise.
From my observations and experiences, I've found that there are 2 major catalysts for price movement--
Price is either trending and reaches a top or bottom, or
Price is consolidating and ready to make a move in some direction
These movements can be seen quite well from a Bollinger Band, which is what mostly gave me the inspiration. When I watch a chart with a BB on it I see that either you're looking to trade price moving out of a squeeze or riding price up/down the band until it crosses over and makes a move to the moving average.
My solution was to multiply the direction of price by the strength of its deviation.
Price gets converted into a signal between -1.0 (bottom of the range) and 1.0 (top of the range)
Standard Deviation gets converted into a stochastic signal between 0 (next to no deviation from mean) and 100 (highest deviation in lookback)
These 2 get multiplied by each other
The result tells you if price action is trending bullish and if its approaching max strength (perhaps Overbought), example: Price is hitting highs (1.0) and deviation is also at its highest (100) = 100, opposite for bearish
Result can also tell you if price is at the top of the range but the deviation is so tiny and we're mostly pinned to the mean (1.0 * 5 = only 5)
How to Trade this Indicator--
If the indicator is stuck near the middle and purple:
- Don't make directional trades or you'll be eaten alive by the chop
- Good idea to sell options, Iron Condors/Butterflies, etc
- Wait for a move to breakout --> the purple will fade away and give way to a direction
--- As in all trading scenarios, be mindful of fakeouts/short moves to one direction that very quickly get reversed
If the indicator is heading higher:
- This would indicate there is a bull trend going on, get long
- If we are reaching the overbought area, this is an ideal place to take profits or look at spreads like Bearish Call Spreads (sell calls)
- I think you can make your own determination of when to sell by either selling when we're in the overbought area (if it reaches there) or staying bullish so long as it is above the zone
If the indicator is heading lower:
- Bear trend, shorting is possible
- Can use this as a contrarian signal to buy lows
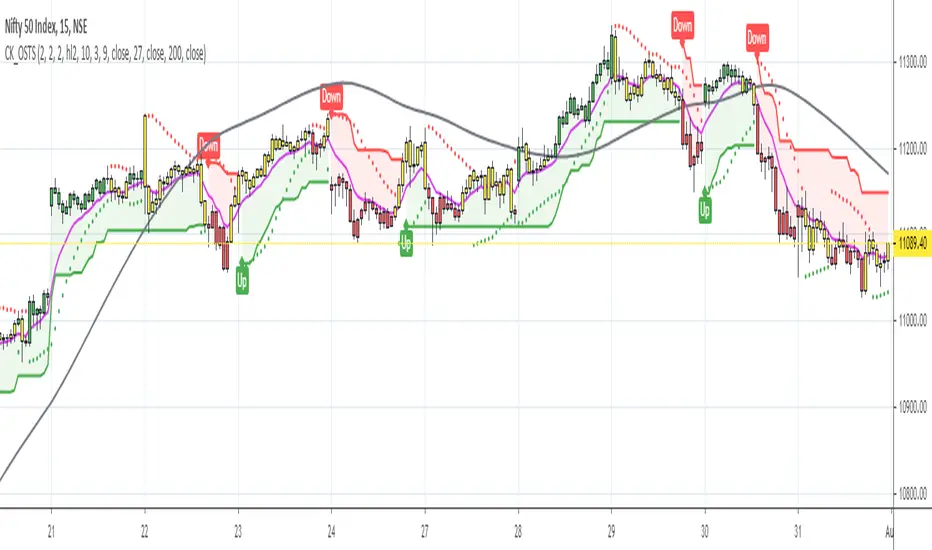
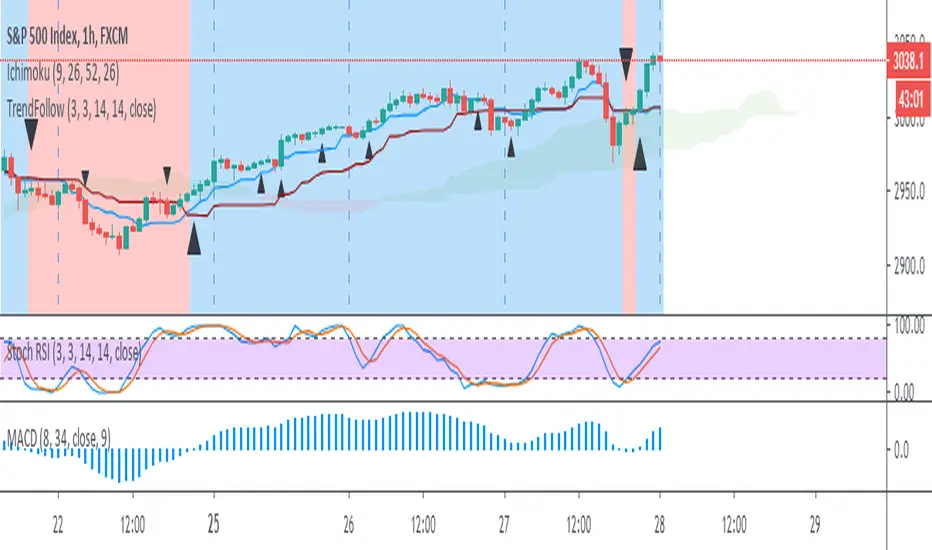
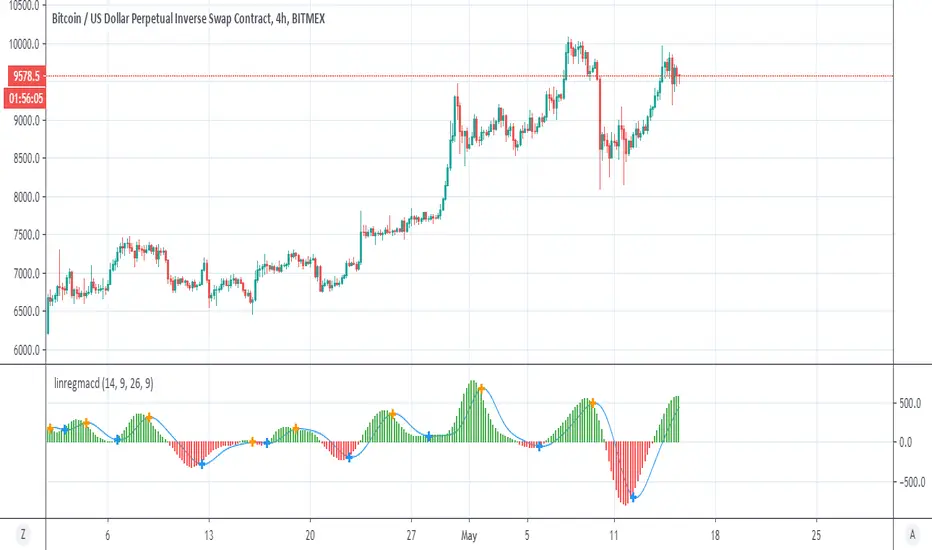
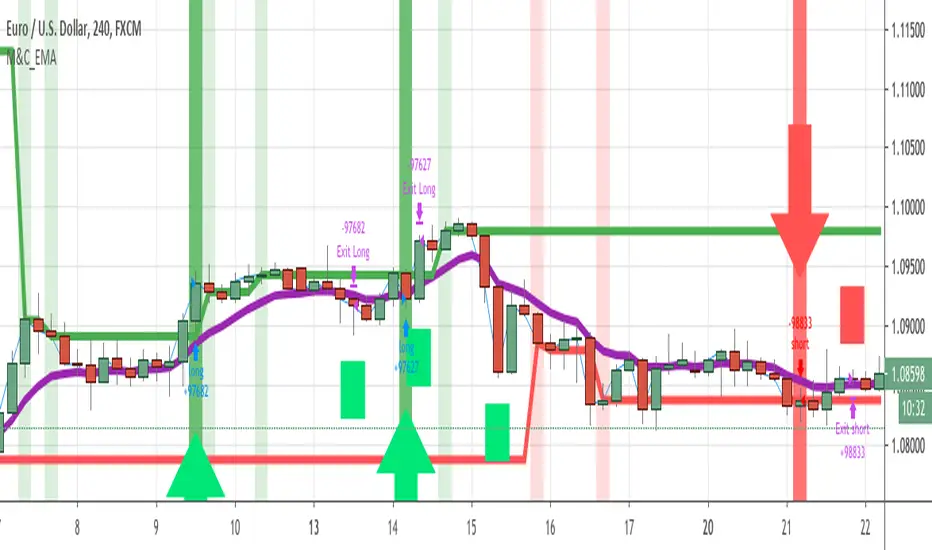
A couple of charts with the indicator and a purple squeeze box I've drawn (can sometimes get noisy in real-time, but hindsight is 20/20)--
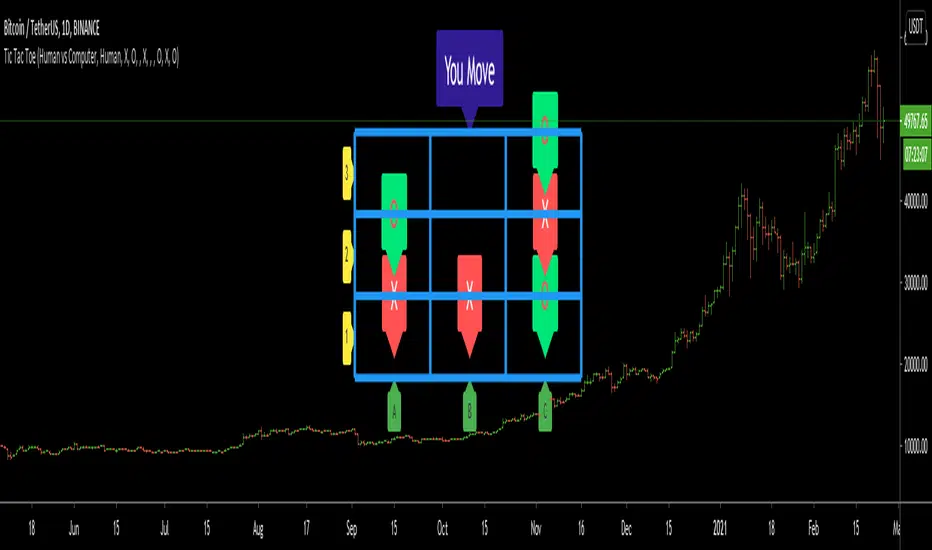
Bitcoin on Daily with default 20 length
Gamestop on 30 minute time frame with 100 length
Please feel free to use this indicator for your trading or your own indicators. This particular script is very stripped down/bare bones from what I have been working on as an ongoing project. If TradingView ever returns scripts you can sell, I would probably open that up for a small premium.
Индикатор Pine Script®