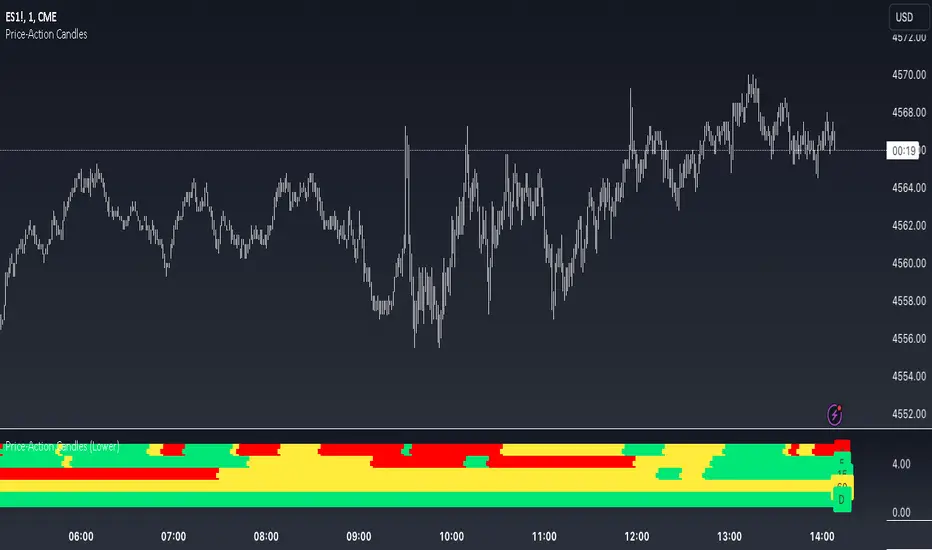
Price-Action Candles (Lower)What is a swing high or swing low?
Swing highs and lows are price extremes. For example say we set our swing length to 5. A candle that is a swing high with a swing length of 5 will have 5 bars to the left that are lower and 5 bars to the right that are lower. A candle that is a swing low with a swing length of 5 will have 5 bars to the left that are higher and 5 bars to the right that are higher.
How is the trend coloring calculated?
The trend coloring is calculated the exact same way as our trend candles study... by storing and comparing historical swing lows and swing highs.
The pinescript code goes as follows:
The pinescript code goes as follows:
var int trend = na
trend := ((hh and high >= psh) or close > csh) ? 1 : ((ll and low <= psl) or close < csl) ? -1 : lh or hl ? 0 : trend
What does that gibberish mean?
-Trend can be GREEN IF
- We have a higher high (current swing high is greater than the previous swing high) and the high is greater than the previous swing high
- OR The current close is greater than the current swing high
-Trend can be RED IF
- We have a lower low (current swing low is less than the previous swing low) and the low is less than the previous swing low
- OR The current close is less than the current swing low
-Trend can be YELLOW IF
- We have a new swing high and the new swing high is less than the previous swing high
- OR We have a new swing low and the new swing low is greater than the previous swing low
If none of the conditions above are true then we continue with whatever color the previous bar was.
What is repainting?
Repainting is "script behavior causing historical vs realtime calculations or plots to behave differently." That definition comes directly from Tradingview. If you want to read the full explanation you can visit it here www.tradingview.com . The price-action candles use swing highs and swing lows which need bars to the left (past) and bars to the right ("future") in order to confirm the swing level. Because of the need to wait for confirmation for swing levels the plot style can be repainting. The Price-Action Candles (Lower) indicator, or this indicator, has no repainting anywhere. We opt to not shift back the candle coloring which causes the repainting, but it is relevant to discuss since this indicator's sibling (Price-Action Candles) can have repainting labels.
Repaint
Here the labels are shifted back the price-action length. Repainting is not present in the Price-Candles (Lower) study, but can be found in this indicator's sibling (Price-Action Candles).
Non-Repaint
Here the labels are not shifted back or "repainted". Repainting is not present in the Price-Candles (Lower) study, but can be found in this indicator's sibling (Price-Action Candles).
Multi-timeframe Analysis
The users can view multi-timeframe historical price action trend via this lower study. Each timeframe is plotted as its own on the lower pane and you can determine what timeframe it is by the label next to the plot.
More examples
Pair the Price-Action Candles (Lower) indicator with our main price indicator that colors candles based on trend and can show price action labels.
Поиск скриптов по запросу "VAR+计量模型+黄金期货"
Price-Action CandlesWhat is a swing high or swing low?
Swing highs and lows are price extremes. For example say we set our swing length to 5. A candle that is a swing high with a swing length of 5 will have 5 bars to the left that are lower and 5 bars to the right that are lower. A candle that is a swing low with a swing length of 5 will have 5 bars to the left that are higher and 5 bars to the right that are higher.
How are the trend candles calculated?
The trend candles are calculated by storing and comparing historical swing lows and swing highs.
The pinescript code goes as follows:
The pinescript code goes as follows:
var int trend = na
trend := ((hh and high >= psh) or close > csh) ? 1 : ((ll and low <= psl) or close < csl) ? -1 : lh or hl ? 0 : trend
What does that gibberish mean?
-Candle can be GREEN IF
- We have a higher high (current swing high is greater than the previous swing high) and the high is greater than the previous swing high
- OR The current close is greater than the current swing high
-Candle can be RED IF
- We have a lower low (current swing low is less than the previous swing low) and the low is less than the previous swing low
- OR The current close is less than the current swing low
-Candle can be YELLOW IF
- We have a new swing high and the new swing high is less than the previous swing high
- OR We have a new swing low and the new swing low is greater than the previous swing low
If none of the conditions above are true then we continue with whatever color the previous bar was.
What is repainting?
Repainting is "script behavior causing historical vs realtime calculations or plots to behave differently." That definition comes directly from Tradingview. If you want to read the full explanation you can visit it here www.tradingview.com . The price-action candles use swing highs and swing lows which need bars to the left (past) and bars to the right ("future") in order to confirm the swing level. Because of the need to wait for confirmation to for swing levels the plot style can be repainting. With the price-action candles indicator the only repainting part of the indicator is the labels. The price-action candles themselves WILL NOT REPAINT. The labels however can be set to repaint or not depending on the user preference. If the user opts to use repainting then the label location is shifted back by the length of the price-action. So if the "Price-Action Length" input is set to 10, and the user wants repainting, the swing high/low label will be shifted back 10 bars. If the user opts for no repainting, the label will not be shifted and instead show on the exact bar the swing level was confirmed.
Examples Below.
Repaint
Here the labels are shifted back the price-action length.
Non-Repaint
Here the labels are not shifted back because the input setting is set to not repaint.
Multi-timeframe Analysis
The users can view the trend from multiple different timeframes at once with a table displayed at the bottom of their charts. The timeframe can be lower or higher than the chart timeframe.
More examples
Be on the lookout for the Price Action Candles (Lower) indicator where you can view the multi-timeframe labels on a lower price grid in order to see the history over time!

Backtest Strategy Optimizer Adapter - Supertrend ExampleSample Code
This is a sample code for my Backtest Strategy Optimizer Adapter library.
You can find the library at:
Backtest Strategy Optimizer Tester
With this indicator, you will be able to run one or multiple backtests with different variables (combinations). For example, you can run dozens of backtests of Supertrend at once with an increment factor of 0.1, or whatever you prefer. This way, you can easily grab the most profitable settings and use them in your strategy. The chart above shows different color plots, each indicating a profit backtest equal to tradingview backtesting system. This code uses my backtest library, available in my profile.
Below the code you should edit yourself
You can use ChatGPT or write a python script to autogenerate code for you.
// #################################################################
// # ENTRIES AND EXITS
// #################################################################
// You can use the link and code in the description to create
// your code for the desired number of entries / exits.
// #################################################################
// AUTO GENERATED CODE
// ▼▼▼▼▼▼▼▼▼▼▼▼▼▼▼▼▼▼▼▼▼▼▼▼▼▼▼▼▼▼▼▼▼▼▼▼▼▼▼▼▼▼▼▼▼▼▼▼▼▼▼▼▼▼▼▼▼▼▼▼▼▼▼▼▼
= ti.supertrend(10, 0.1)
= ti.supertrend(10, 0.2)
= ti.supertrend(10, 0.3)
= ti.supertrend(10, 0.4)
// 005 etc...
pnl_001 = backtest.profit(date_start, date_end, entry_001, exit_001)
pnl_002 = backtest.profit(date_start, date_end, entry_002, exit_002)
pnl_003 = backtest.profit(date_start, date_end, entry_003, exit_003)
pnl_004 = backtest.profit(date_start, date_end, entry_004, exit_004)
plot(pnl_001, title='0.1', color=backtest.color(001))
plot(pnl_002, title='0.2', color=backtest.color(002))
plot(pnl_003, title='0.3', color=backtest.color(003))
plot(pnl_004, title='0.4', color=backtest.color(004))
// Make sure you set the correct array size.
// The amount of tests + 1 (e.g. 4 tests you set it to 5)
var results_list = array.new_string(5)
if (ta.change(pnl_001))
array.set(results_list, 0, str.tostring(pnl_001) + '|0.1')
if (ta.change(pnl_002))
array.set(results_list, 1, str.tostring(pnl_002) + '|0.2')
if (ta.change(pnl_003))
array.set(results_list, 2, str.tostring(pnl_003) + '|0.3')
if (ta.change(pnl_004))
array.set(results_list, 3, str.tostring(pnl_004) + '|0.4')
// ▲▲▲▲▲▲▲▲▲▲▲▲▲▲▲▲▲▲▲▲▲▲▲▲▲▲▲▲▲▲▲▲▲▲▲▲▲▲▲▲▲▲▲▲▲▲▲▲▲▲▲▲▲▲▲▲▲▲▲▲▲▲▲▲▲
// AUTO GENERATED CODE
// #################################################################
OTT CollectionIf you are not yet familiar with OTT, this script could provide an introduction to help you get started.
"Optimized Trend Tracker" (OTT) is an effective trend-following indicator created by Anıl Özekşi . It aims to detect the current trend direction based on an elegant mathematical construct. The key defining characteristic of OTT is its reliance on a trailing-stop mechanism. This enables OTT to identify price movements and follow the price until a reversal occurs. The widespread adoption of OTT in various algo-trading platforms has fostered the development of diverse applications of the indicator over time. Examining its history, eight distinct applications emerge.
1) OTT - Optimized Trend Tracker
2) TOTT - Twin Ott
3) OTT Channel - Half Channel & Fibonacci Channel
4) RISOTTO - Rsi Ott
5) SOTT - Stochastic Ott
6) HOTT & LOTT - Highest-Lowest Ott + Sum Option
7) ROTT - Relative Ott
8) FT - "Fırsatçı" Trend
BONUS: RTR - Relative True Range
Each system functions as an independent indicator and the "OTT Collection" is intended to present all of them in a single script.
ORIGINALITY
Primarily, this script introduces previously unreleased OTT applications on Tradingview (RISOTTO, ROTT, FT). In contrast to previously published examples that treat OTT as a variable, this script portrays OTT as a function, rendering it adaptable for more intricate computations. Consequently, OTT has evolved into a versatile tool capable of facilitating complex analyses. Furthermore, this script offers an innovative feature that permits the blocking of consecutive signals in the same direction, catering to user preferences. (This feature is crucial for all indicators utilizing band structures such as TOTT and HOTT-LOTT).
USAGE
It is simple to use. The settings section of the indicator groups the parameters. In first group, the System parameter allows you to select the OTT system you want to display on the chart. Activating the Pyramiding parameter enables the display of consecutive signals in the same direction (for TOTT and HOTT-LOTT). In the second group you can change the display options with the Barcolor, Signal and Bars parameters. The OTT system you select is configured with the parameters in the group with the corresponding system heading. (For example, suppose you select OTT CHANNEL in the system parameter. The parameters defining the channels are grouped under the heading "OTT CHANNELS" in the settings section.) Also the parameters you chose are displayed in table form on the chart screen. The table also presents the total number of bars on the chart and the number of signals generated by the selected system.
MECHANICS
Let's take a look at how the indicator works. This indicator incorporates eight distinct OTT systems, each characterized by unique parameters, lines, and signals. (Exception: OTT Channel does not include any referenced signals.)
1) WHAT IS "OTT"?
OTT comprises two lines: Support and Target. There's an up-trending market when the Support is superior to the Target, and a down-trending market when the Support is inferior to the Target. It is governed by two parameters. The Support (moving average) is determined by the Length parameter, while the Multiplier parameter is employed for percentage calculations. Lower values are adept at capturing short-term fluctuations, whereas higher values are more adept at identifying long-term trends. These principles apply to all parameters within the indicator.
DETAILED INFO : The OTT function in the script automatically performs the calculation process described in this section. So, if you know how OTT works you can skip the details. To comprehend its functioning, it's essential to grasp the "MOST" indicator, also devised by Anıl Özekşi. The fundamental principle of MOST involves creating bands that function akin to a trailing stop-loss. Initially, a moving average, referred to as the 'Support,' is established. (Anıl Özekşi employs VAR/VIDYA as the moving average type in all his systems.) Subsequently, the Support line is adjusted both upward and downward by a percentage multiplier to establish a band system. In the context of the trailing stop-loss concept, when the Support line approaches either the lower or upper band, the respective band ceases to move in parallel with the Support line and becomes horizontal. Consequently, the Support always intersects the band at some point. The values of the upper or lower bands, determined by this intersection, are referred to as the MOST line. OTT is generated by consolidating the values of MOST shifted upwards and downwards by half the coefficient percentage into a single line using the same method as above, and calculating the value of this line from two bars ago. Support is the data series of OTT and it serves as a source in OTT function. The OTT line is named as "Target" in this scipt. Support and Target will automatically vary according to the OTT application selected in the "System" parameter.
2) WHAT IS "TOTT"?
Twin OTT , also known as the "OTT Band," involves three parameters: Length, Multiplier, and Band Multiplier. It consists of three lines: Support, Upper Line, and Lower Line. OTT is determined by the Length and Multiplier parameters, while TOTT is calculated by adjusting OTT upwards and downwards as per the Band Multiplier parameter. The indicator generates signals based on the intersections of the Support and these two new OTT levels.
3) WHAT IS "OTT CHANNEL"?
Similar to TOTT, the OTT CHANNEL is also based on shifted OTT levels, employing a similar calculation method. The primary distinction lies in the fact that TOTT has a single Band Multiplier, whereas OTT CHANNEL incorporates two line multipliers for the band. It encompasses four parameters: Length, Multiplier, Upper Line Multiplier, and Lower Line Multiplier. OTT is defined by the Length and Multiplier parameters. The Upper Line Multiplier and Lower Line Multiplier parameters establish the channel boundaries by shifting the OTT line. Subsequently, levels are drawn between the upper and lower lines. The additional Channel Type parameter determines which levels are displayed on the chart. The "Half Channel" option draws channels shifted by half the coefficient. The "Fibonacci Channel" option draws channels shifted by 0.382 and 0.618 coefficients. The "Both" option plots all levels.
4) WHAT IS "RISOTTO"?
OTT also has application examples in momentum oscillators. RISOTTO utilizes the RSI indicator and operates with three parameters. The RSI is defined by the Length 1 parameter, while the Support is determined by the Length 2 parameter. The Multiplier parameter is utilized for percentage calculations. RISOTTO comprises two lines: Support and Target. To ensure more stable calculations, a constant (+1000) is added to the oscillator average when applying OTT to momentum oscillators. This approach eradicates nonsensical results stemming from percentage calculations when the oscillator reaches a value of 0. The indicator generates signals based on the intersection of these two lines.
5) WHAT IS "SOTT"?
Stochastic OTT is an another example of application on oscillator. Its working principle is akin to that of RISOTTO. It operates with three parameters. The Stochastic %k is defined by the Length 1 parameter, while the Stochastic %d is determined by the Length 2 parameter. The Multiplier parameter is utilized for percentage calculations. SOTT comprises two lines: Support and Target. The indicator generates signals based on the intersection of these two lines.
6) WHAT IS "HOTT-LOTT"?
OTT can be applied to the highest and lowest series as well. HOTT-LOTT operates with three parameters: Length, Multiplier, and Sum N Bars. The highest and lowest series are defined by the Length parameter. The Multiplier parameter is utilized for percentage calculations. It encompasses two lines: Upper Line and Lower Line, where HOTT employs the highest series and LOTT uses the lowest series. If the 'High' price surpasses HOTT, the indicator generates Long signals. Similarly, if the 'Low' price falls below LOTT, the indicator generates Short signals. When the Sum N Bars option is activated, signals are generated based on the confirmation concept for N bars.
7) WHAT IS "ROTT"?
Relative OTT serves as a valuable tool for long-period filters. ROTT operates with two parameters. The Support is determined by the length parameter and equals twice the moving average. The Multiplier parameter is utilized for percentage calculations. The indicator generates signals based on the intersection of these two lines.
8) WHAT IS "FT"?
"Fırsatçı" (opportunistic) Trend is a system that revolves around two levels, namely major and minor OTT. It operates with three parameters: Length, Major Multiplier, and Minor Multiplier. FT comprises two lines, Support and Target. The indicator generates signals based on the intersection of these two lines.
9) WHAT IS "RTR"?
Relative True Range is not an OTT system; however, it serves as a complementary feature. It does not have any referenced signals. RTR is devised to obtain a normalized result of the current market volatility. It operates with two parameters: ATR, which is determined by the Length 1 parameter, and RTR, defined by the Length 2 parameter.
A TIP
If any indicator is defined in function form instead of the OTT function, the applications can also be adapted for different indicators. E.g. Supertrend, PMAX, AlphaTrend, etc.
UPDATE
Anıl Özekşi is a competent algotrader who shares his work with open sources. I will update the indicator as new applications are released.
DISCLEIMER
This is just an indicator, nothing more. The script is for informational and educational purposes only. The use of the script does not constitute professional and/or financial advice. The responsibility for risks associated with the use of the script is solely owned by the user. Do not forget to manage your risk. And trade as safely as possible. Good luck!

[AIO] Multi Collection Moving Averages 140 MA TypesAll In One Multi Collection Moving Averages.
Since signing up 2 years ago, I have been collecting various Сollections.
I decided to get it into a decent shape and make it one of the biggest collections on TV, and maybe the entire internet.
And now I'm sharing my collection with you.
140 Different Types of Moving Averages are waiting for you.
Specifically :
"
AARMA | Adaptive Autonomous Recursive Moving Average
ADMA | Adjusted Moving Average
ADXMA | Average Directional Moving Average
ADXVMA | Average Directional Volatility Moving Average
AHMA | Ahrens Moving Average
ALF | Ehler Adaptive Laguerre Filter
ALMA | Arnaud Legoux Moving Average
ALSMA | Adaptive Least Squares
ALXMA | Alexander Moving Average
AMA | Adaptive Moving Average
ARI | Unknown
ARSI | Adaptive RSI Moving Average
AUF | Auto Filter
AUTL | Auto-Line
BAMA | Bryant Adaptive Moving Average
BFMA | Blackman Filter Moving Average
CMA | Corrected Moving Average
CORMA | Correlation Moving Average
COVEMA | Coefficient of Variation Weighted Exponential Moving Average
COVNA | Coefficient of Variation Weighted Moving Average
CTI | Coral Trend Indicator
DEC | Ehlers Simple Decycler
DEMA | Double EMA Moving Average
DEVS | Ehlers - Deviation Scaled Moving Average
DONEMA | Donchian Extremum Moving Average
DONMA | Donchian Moving Average
DSEMA | Double Smoothed Exponential Moving Average
DSWF | Damped Sine Wave Weighted Filter
DWMA | Double Weighted Moving Average
E2PBF | Ehlers 2-Pole Butterworth Filter
E2SSF | Ehlers 2-Pole Super Smoother Filter
E3PBF | Ehlers 3-Pole Butterworth Filter
E3SSF | Ehlers 3-Pole Super Smoother Filter
EDMA | Exponentially Deviating Moving Average (MZ EDMA)
EDSMA | Ehlers Dynamic Smoothed Moving Average
EEO | Ehlers Modified Elliptic Filter Optimum
EFRAMA | Ehlers Modified Fractal Adaptive Moving Average
EHMA | Exponential Hull Moving Average
EIT | Ehlers Instantaneous Trendline
ELF | Ehler Laguerre filter
EMA | Exponential Moving Average
EMARSI | EMARSI
EPF | Edge Preserving Filter
EPMA | End Point Moving Average
EREA | Ehlers Reverse Exponential Moving Average
ESSF | Ehlers Super Smoother Filter 2-pole
ETMA | Exponential Triangular Moving Average
EVMA | Elastic Volume Weighted Moving Average
FAMA | Following Adaptive Moving Average
FEMA | Fast Exponential Moving Average
FIBWMA | Fibonacci Weighted Moving Average
FLSMA | Fisher Least Squares Moving Average
FRAMA | Ehlers - Fractal Adaptive Moving Average
FX | Fibonacci X Level
GAUS | Ehlers - Gaussian Filter
GHL | Gann High Low
GMA | Gaussian Moving Average
GMMA | Geometric Mean Moving Average
HCF | Hybrid Convolution Filter
HEMA | Holt Exponential Moving Average
HKAMA | Hilbert based Kaufman Adaptive Moving Average
HMA | Harmonic Moving Average
HSMA | Hirashima Sugita Moving Average
HULL | Hull Moving Average
HULLT | Hull Triple Moving Average
HWMA | Henderson Weighted Moving Average
IE2 | Early T3 by Tim Tilson
IIRF | Infinite Impulse Response Filter
ILRS | Integral of Linear Regression Slope
JMA | Jurik Moving Average
KA | Unknown
KAMA | Kaufman Adaptive Moving Average & Apirine Adaptive MA
KIJUN | KIJUN
KIJUN2 | Kijun v2
LAG | Ehlers - Laguerre Filter
LCLSMA | 1LC-LSMA (1 line code lsma with 3 functions)
LEMA | Leader Exponential Moving Average
LLMA | Low-Lag Moving Average
LMA | Leo Moving Average
LP | Unknown
LRL | Linear Regression Line
LSMA | Least Squares Moving Average / Linear Regression Curve
LTB | Unknown
LWMA | Linear Weighted Moving Average
MAMA | MAMA - MESA Adaptive Moving Average
MAVW | Mavilim Weighted Moving Average
MCGD | McGinley Dynamic Moving Average
MF | Modular Filter
MID | Median Moving Average / Percentile Nearest Rank
MNMA | McNicholl Moving Average
MTMA | Unknown
MVSMA | Minimum Variance SMA
NLMA | Non-lag Moving Average
NWMA | Dürschner 3rd Generation Moving Average (New WMA)
PKF | Parametric Kalman Filter
PWMA | Parabolic Weighted Moving Average
QEMA | Quadruple Exponential Moving Average
QMA | Quick Moving Average
REMA | Regularized Exponential Moving Average
REPMA | Repulsion Moving Average
RGEMA | Range Exponential Moving Average
RMA | Welles Wilders Smoothing Moving Average
RMF | Recursive Median Filter
RMTA | Recursive Moving Trend Average
RSMA | Relative Strength Moving Average - based on RSI
RSRMA | Right Sided Ricker MA
RWMA | Regressively Weighted Moving Average
SAMA | Slope Adaptive Moving Average
SFMA | Smoother Filter Moving Average
SMA | Simple Moving Average
SSB | Senkou Span B
SSF | Ehlers - Super Smoother Filter P2
SSMA | Super Smooth Moving Average
STMA | Unknown
SWMA | Self-Weighted Moving Average
SW_MA | Sine-Weighted Moving Average
TEMA | Triple Exponential Moving Average
THMA | Triple Exponential Hull Moving Average
TL | Unknown
TMA | Triangular Moving Average
TPBF | Three-pole Ehlers Butterworth
TRAMA | Trend Regularity Adaptive Moving Average
TSF | True Strength Force
TT3 | Tilson (3rd Degree) Moving Average
VAMA | Volatility Adjusted Moving Average
VAMAF | Volume Adjusted Moving Average Function
VAR | Vector Autoregression Moving Average
VBMA | Variable Moving Average
VHMA | Vertical Horizontal Moving Average
VIDYA | Variable Index Dynamic Average
VMA | Volume Moving Average
VSO | Unknown
VWMA | Volume Weighted Moving Average
WCD | Unknown
WMA | Weighted Moving Average
XEMA | Optimized Exponential Moving Average
ZEMA | Zero Lag Moving Average
ZLDEMA | Zero-Lag Double Exponential Moving Average
ZLEMA | Ehlers - Zero Lag Exponential Moving Average
ZLTEMA | Zero-Lag Triple Exponential Moving Average
ZSMA | Zero-Lag Simple Moving Average
"
Don't forget that you can use any Moving Average not only for the chart but also for any of your indicators without affecting the code as in my example.
But remember that some MAs are not designed to work with anything other than a chart.
All MA and Code lists are sorted strictly alphabetically by short name (A-Z).
Each MA has its own number (ID) by which you can display the Moving Average you need.
Next to the ID selection there are tooltips with short names and their numbers. Use them.
The panel below will help you to read the Name of the selected MA.
Because of the size of the collection I think this is the optimal and most convenient use. Correct me if this is not the case.
Unknown - Some MAs I collected so long ago that I lost the full real name and couldn't find the authors. If you recognize them, please let me know.
I have deliberately simplified all MAs to input just Source and Length.
Because the collection is so large, it would be quite inconvenient and difficult to customize all MA functions (multipliers, offset, etc.).
If you need or like any MA you will still have to take it from my collection for your code.
I tried to leave the basic MA settings inside function in first strings.
I have tried to list most of the authors, but since the bulk of the collection was created a long time ago and was not intended for public publication I could not find all of them.
Some of the features were created from scratch or may have been slightly modified, so please be careful.
If you would like to improve this collection, please write to me in PM.
Also Credits, Likes, Awards, Loves and Thanks to :
@alexgrover
@allanster
@andre_007
@auroagwei
@blackcat1402
@bsharpe
@cheatcountry
@CrackingCryptocurrency
@Duyck
@ErwinBeckers
@everget
@glaz
@gotbeatz26107
@HPotter
@io72signals
@JacobAmos
@JoshuaMcGowan
@KivancOzbilgic
@LazyBear
@loxx
@LuxAlgo
@MightyZinger
@nemozny
@NGBaltic
@peacefulLizard50262
@RicardoSantos
@StalexBot
@ThiagoSchmitz
@TradingView
— 𝐀𝐧𝐝 𝐎𝐭𝐡𝐞𝐫𝐬 !
So just a Big Thank You to everyone who has ever and anywhere shared their codes.

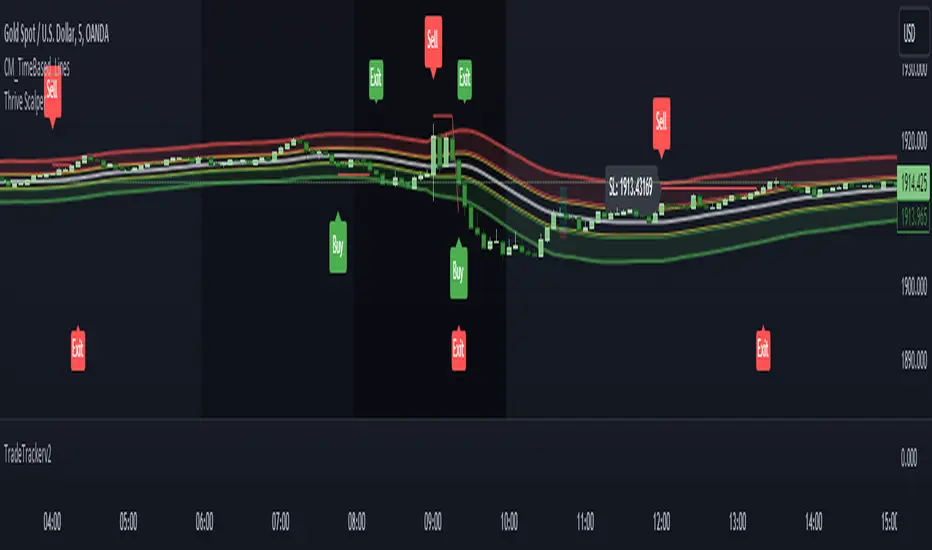
TradeTrackerv2Library "TradeTrackerv2"
This library can be used to track (hypothetical) trades on the chart. Enter the Open, SL, and TP prices (or TP in R to have it calculated) and then call Trade.TrackTrade(barIndex). Keep track of your trades in an array and then simply call TradeTracker.UpdateAllTrades(close) to update all trades based on the current close price.
How to use:
1. Import the library, as always. I'm assuming the alias of "Tracker" below.
2. The Type Trade is exported, so generate a Trade object like newTrade = Tracker.Trade.new() .
3. Set the values for Open, SL, and TP. TP can be set either by price or by R, which will calculate the R based on the Open->SL range:
newTrade.priceOpen = 1.0
newTrade.priceSl = 0.5
newTrade.priceTp = 2.0
-- or in place of the third line above --
newTrade.rTp = 2
4. On each interval you want to update (whether that's per tick/close or on each bar), call trades.UpdateAllTrades(close) . This snippet assumes you have an array named trades (var trades = array.new()) .
In future updates, more customization options will be created. This is the initial prototype.
method MakeTradeLines(t, barIdx)
Namespace types: Trade
Parameters:
t (Trade)
barIdx (int)
method UpdateLabel(t)
Namespace types: Trade
Parameters:
t (Trade)
method MakeLabel(t, barIdx)
Namespace types: Trade
Parameters:
t (Trade)
barIdx (int)
method CloseTrade(t)
Namespace types: Trade
Parameters:
t (Trade)
method OpenTrade(t)
Namespace types: Trade
Parameters:
t (Trade)
method OpenCloseTrade(t, _close)
Namespace types: Trade
Parameters:
t (Trade)
_close (float)
method CalculateProfits(t, _close)
Calculates profits/losses for the Trade, given _close price
Namespace types: Trade
Parameters:
t (Trade)
_close (float)
method UpdateTrade(t, _close)
Namespace types: Trade
Parameters:
t (Trade)
_close (float)
method SetInitialValues(t, barIdx)
Namespace types: Trade
Parameters:
t (Trade)
barIdx (int)
method UpdateAllTrades(trades, _close)
Namespace types: Trade
Parameters:
trades (Trade )
_close (float)
method TrackTrade(t, barIdx)
Namespace types: Trade
Parameters:
t (Trade)
barIdx (int)
Trade
Fields:
id (series__integer)
isOpen (series__bool)
isClosed (series__bool)
isBuy (series__bool)
priceOpen (series__float)
priceTp (series__float)
priceSl (series__float)
rTP (series__float)
profit (series__float)
r (series__float)
resultR (series__float)
lineOpen (series__line)
lineTp (series__line)
lineSl (series__line)
labelStats (series__label)
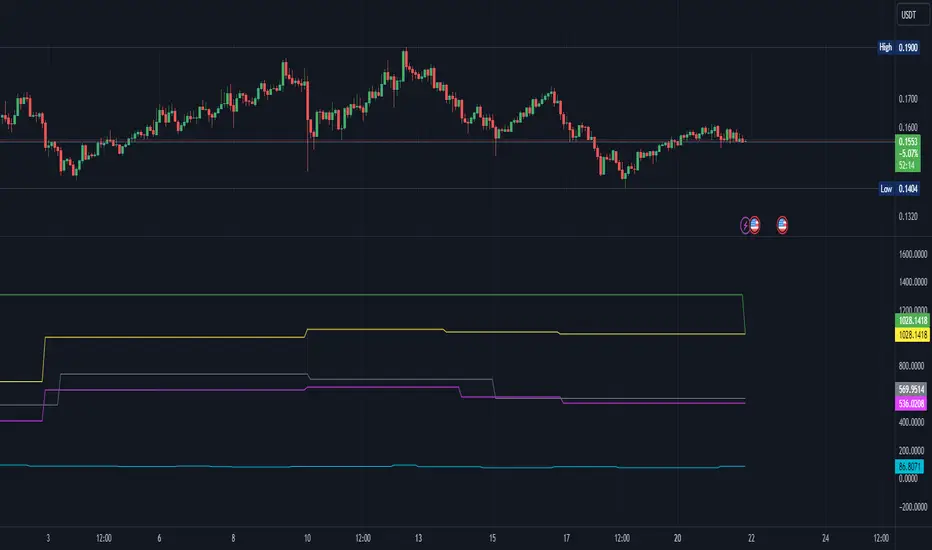
Bolton-Tremblay IndexThe Bolton-Tremblay Index (BOLTR) is a dynamic cumulative advance-decline indicator which incorporates the count of unchanged issues as a fundamental element. This index serves as a valuable tool for identifying shifts in market trends and gauging the overall strength or weakness of the market. To enhance its effectiveness and reveal underlying trends, BOLTR has been refined through a Heiken-Ashi transformation, resulting in a smoother and more insightful representation.
Calculation and Methodology:
r = (adv - dec) / unch
var float bt = na
bt := r > 0 ? nz(bt ) + math.sqrt(math.abs(r)) : nz(bt ) - math.sqrt(math.abs(r))
The BOLTR index is derived from a calculation involving three essential components: advancing issues (ADV), declining issues (DEC), and securities with unchanged closing prices (UNC). By formulating the ratio (ADV - DEC) / UNC, BOLTR captures the relationship between market movements and unchanged securities. This ratio then dictates whether the BOLTR index increases or decreases in the following period. If the ratio is positive, the index advances, and if negative, it retreats. This iterative process yields a cumulative index that reflects the evolving dynamics of market trends.
Heiken-Ashi Transformation:
The addition of a Heiken-Ashi transformation imparts a smoothing effect to the BOLTR index, revealing the underlying trend with greater clarity. This transformation diminishes noise and fluctuations, making it easier to identify meaningful shifts in market sentiment and overall market health.
Utility and Use Cases:
-The Bolton-Tremblay Index offers a range of applications that contribute to informed decision-making-
1. Trend Analysis: BOLTR provides insights into the changing trends of the market, helping traders and investors identify potential shifts in market sentiment.
2. Market Strength Assessment: By considering advancing, declining, and unchanged issues, BOLTR offers a comprehensive assessment of market strength and potential weaknesses.
3. Divergences: Traders can use BOLTR to detect divergences between price movements and the cumulative advance-decline dynamics, potentially signaling shifts in market direction.
The Bolton-Tremblay Index offers a versatile toolset for interpreting market trends, evaluating market health, and making better informed trading decisions.
See Also:
- Other Market Breadth Indicators-
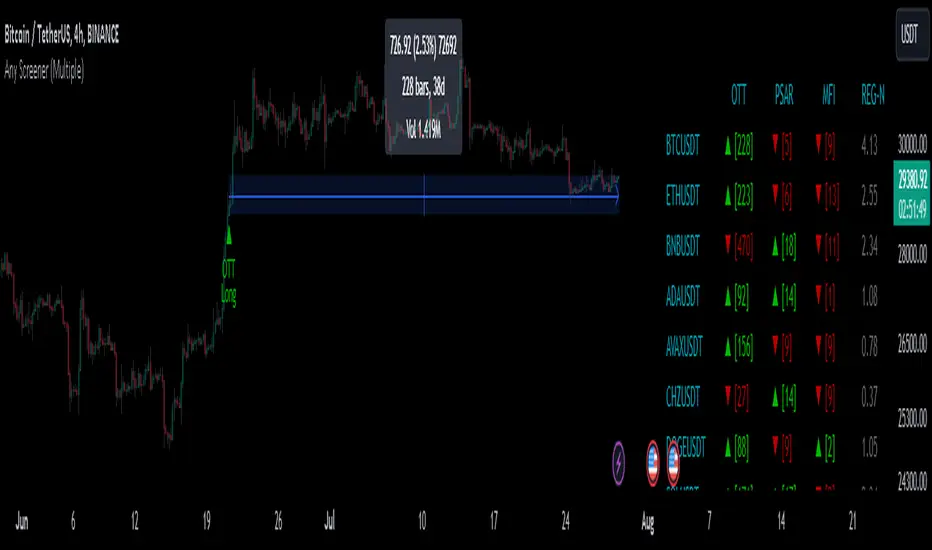
Any Screener (Multiple)I suppose it's time to publish something relatively useful :). Here's the first try, Any Screener.
This script is an advanced version of the Alphatrend - Screener that I've coded as a humble "thank you" to Kıvanç Özbilgiç (KivancOzbilgic), who always inspired me.
INTRODUCTION
I developed this version with a unique method because I couldn't find an example with the following features:
It presents the valid signal status of multiple indicators for 15 different symbols in the form of a report.
It indicates how many bars have passed after the signal has occurred.
It indicates the signal direction with dynamic colors and chars.
It can also be used for data (just indicator value) that is only intended to be displayed as text. (Default color is grey).
Long and short signals can optionally be ploted on the chart.
It includes advanced configuration settings.
USAGE OF PANEL
The screener panel is simple to use. On the far left, assets are listed. The names of the indicators appear at the top. In the column with the name of each indicator, the signals of that indicator appear as green or red. The green ones represent the long signals (uptrend) and the red ones represent the short signals (down trend). The numbers in square brackets indicate how many bars have passed after the last signal has occurred. (For example: According to the indicator at the top, when the green bullish triangle and 21 appeared on allign of BTCUSDT, Bitcoin switched to buy signal 21 bars ago. A tip : If the signal distance is 0, the signal occurred at the current bar. It is recommended to wait for the bar to close before entering the trade). Signal distance is an essential output for both manual and algorithmic trading. Users often require mentioned data the most during real time trading.
THE SCRIPT
There are two sections in the script; indicators and screener.
SECTION 1 : "INDICATORS"
In the indicator section, you'll find efficient details about switch methods, normalization, avoid pyramyding (in momentum oscillators) etc. On the other hand, I intended to present a "how to example" of a multiple screener, so it has to include more than one indicator.
OTT : Optimized Trend Tracker is developed by dear Anıl Özekşi, known as the "Old Fisherman" :). In my opinion, it is a pretty cool trend-following indicator that offers a mathematical elegance. This indicator aim to detect the current market trend direction, the indicator detect an up-trending market when the support line is superior to the OTT, and a down trending market when the support line is inferior to the OTT. It has three parameters; moving average type, length and percentage. In this version when the percentage parameter is set to 0.0, OTT turns into the selected moving average. And the signals are generated by the crossing of the closing price. It means, this screener is able to compile and present status of moving averages as well. Also VAR (VIDYA) and EVWMA has been re-designed, both moving averages no longer start at zero at the beginning of the chart (That was a big problem for backtests).
PSAR : J. Welles Wilder's Parabolic Stop And Reversal is an important trend following indicator. PSAR detects an up-trending market when below the market price and a down-trend when above. It can work in harmony with OTT according to the parameter combinations.
OSCILLATORS : Also optional three momentum oscillators have been added. MFI (Money Flow Index), RSI (Relative Strength Index) and STOCH (Stochastic %k). All three oscillators are widely used in markets and quite successful in explaining price movements by using different sources. Oscillators generate long and short signals based on oversold and overbought parameters.
VOLATILITY & TREND : There are three optional indicators. ADX (Average Directional Index), BBW-N (Normalized Bollinger Bandwidth) and REG-N (Normalized value of standard error of linear regression). These three indicators don't generate any long or short signals. Instead, they are used to measure the strength of trends and volatility. Therefore, only the numerical results (0-100) are displayed in screener panel and it is grey. (Note : The second length parameter of ADX has the same value with the first one. Bollinger Bandwith's multiplier is 2.0. REG-N is a variable that developed by Paul Kirshenbaum for Kirshenbaum Bands.)
SECTION 2 : "SCREENER"
The second section processes the main idea. This Screener model is based on generating an integer direction variable from boolean signals. The direction value serves multiple purposes: calculating the distance of signal, determining the color based on the direction, and creating "clean" data for the security function. The final step is to present the obtained data as text to the user.
HOW CAN I "SCREEN" MY CONDITIONS?
That's piece a cake, delete the Section 1 in the script :). If you change totally 11 variables according to your own strategy, you can create your new screener! The method is explained at lines 169-171.
SINCERELY THANKS
To allanster for patiently answering my primitive questions,
And to KivancOzbilgic for mind blowing suggestions (especially while we're drinking Raki) :)...
DISCLEIMER
This is just an indicator, nothing more. The script is for informational and educational purposes only. The use of the script does not constitute professional and/or financial advice. The responsibility for risks associated with the use of the script is solely owned by the user. Do not forget to manage your risk. And trade as safely as possible. Good luck!
MOST + Moving Average ScreenerScreener version of Anıl Özekşi's Moving Stop Loss (MOST) Indicator:
USERS MAY SCREEN MOST WITH 11 DIFFERENT TYPES OF MOVING AVERAGES + THEY CAN ALSO SCREEN SIGNALS WITH THAT 11 MOVING AVERAGES INSTEAD OF USING MOST LINE.
Adjustable Moving Average Types:
SMA : Simple Moving Average
EMA : Exponential Moving Average
WMA : Weighted Moving Average
DEMA : Double Exponential Moving Average
TMA : Triangular Moving Average
VAR : Variable Index Dynamic Moving Average aka VIDYA
WWMA : Welles Wilder's Moving Average
ZLEMA : Zero Lag Exponential Moving Average
TSF : True Strength Force
HULL : Hull Moving Average
TILL : Tillson T3 Moving Average
About Screener Panel:
Users can explore 20 different and user-defined tickers, which can be changed from the SETTINGS (shares, crypto, commodities...) on this screener version.
The screener panel shows up right after the bars on the right side of the chart.
-In this screener version of MOST, users can define the number of demanded tickers (symbols) from 1 to 20 by checking the relevant boxes on the settings tab.
-All selected tickers can be screened in different timeframes.
-Also, different timeframes of the same Ticker can be screened.
IMPORTANT NOTICE:
Screener shows the results in 3 different logic:
1st LOGIC (Default Settings):
BUY AND SELL SIGNALS of MOST and MOVING AVERAGE LINE
Most Buy Signal: Moving Average Crosses ABOVE the MOST LINE
Most Sel Signal: Moving Average Crosses BELOW the MOST LINE
Tickers seen in green are the ones that are in an uptrend, according to MOST.
The ones that appear in red are those in the SELL signal, in a downtrend.
The numbers before each Ticker indicate how many bars passed after MOST's last BUY or SELL signal.
For example, according to the indicator, when BTCUSDT appears (3) in GREEN, Bitcoin switched to a BUY signal 3 bars ago.
2nd LOGIC (Moving Average & Price Flips Screener Mode):
This mode can only be activated by checking the 'Activate Moving Average Screening Mode' box on the settings menu.
MOST line will be disappeared after checking the box.
Buy Signal: When the Selected Price crosses ABOVE the selected Moving Average.
Sell Signal: When the Selected Price crosses BELOW the selected Moving Average.
Tickers seen in green are the ones that are in an uptrend, according to Moving Average & Price Flips.
The ones that appear in red are those in the SELL signal, in a downtrend.
The numbers before each Ticker indicate how many bars passed after the last BUY or SELL signal of Moving Average & Price Flips.
For example, according to the indicator, when BTCUSDT appears (3) in GREEN, Bitcoin switched to a BUY signal 3 bars ago.
3rd LOGIC (Moving Average Color Change Screener Mode):
Both 'Activate Moving Average Screening Mode' and 'Activate Moving Average Color Change Screening Mode' boxes must be checked in the settings tab.
Moving Average Line will turn out into two colors.
Green color means the moving average value is greater than the previous bar's value.
Red color means the moving average value is smaller than the previous bar's value.
Buy Signal: After the Selected Moving Average turns GREEN from red.
Sell Signal: After the Selected Moving Average turns RED from green.
-Screener shows the information about the color changes of the selected Moving Average with default settings.
If this option is preferred, users are advised to enlarge the length to have better signals.
Tickers seen in green are the ones that are in an uptrend, according to Moving Average Color.
The ones that appear in red are those in the SELL signal, in a downtrend.
The numbers before each Ticker indicate how many bars passed after the last BUY or SELL signal of Moving Average Color Change.
For example, according to the indicator, when BTCUSDT appears (3) in GREEN, Bitcoin switched to a BUY signal 3 bars ago.

ATR profit and loss linesWhat is ATR?
Taking a candlestick, the following 3 transactions are calculated:
1-The difference between the high of the day and the low of the day
2-The difference between today's high and yesterday's close
3-The difference between today's low and yesterday's close
Atr takes the average of these 14-day candlesticks after making their calculations and it predicts how high or low a candle can go and these give us support and resistance helps with points
If you have noticed a rise in your chart and have no idea how high it will go, you can use Atr profit and loss lines.
The red zone is the stop point, the blue zones are the snow zones.
Must be used with macd. macd is validator.
There is an increase in your chart, you opened the atr profit and loss lines upwards and if macd gives you an increase, it is recommended that you enter the trade at that time. It is recommended to increase your loss line 1 step in the direction of profit every 2 profit breaks on atr profit and loss lines.
ATR Nedir?
Bir mum barı ele alınarak şu 3 işlem hesaplanır:
1-Günün yükseği ile günün düşüğü farkı
2-Günün yükseği ile dünün kapanışının farkı
3-Günün düşüğü ile dünkü kapanışın farkı
ATR ise 14 günlük bu mum barlarının hesaplarını yaptıktan sonra ortalamasını alır ve bir mumum ne kadar yükselip düşebileceği konusunda tahmin verir ve bunlar bize destek ve direnç noktaları konusunda yardımcı olur
Eğer grafiğinizde bir yükseliş farketmişseniz ne kadar yükseleceği konusunda fikriniz yoksa Atr kar zarar çizgilerini kullanabilirsiniz.
Kırmızı bölge durdurma noktası,mavi bölgeler kar bölgeleridir.
Macd ile birlikte kullanılmalıdır.macd doğrulayıcıdır.
Grafiğinizde yükseliş var,atr kar zarar çizgilerini yukarı yönlü açtınız ve macd size yükseliş veriyorsa işte o sırada işleme girmeniz tavsiye edilir.atr kar zarar çizgilerinde her 2 kar kırılımında bir zarar çizginizi kar yönünde 1 kademe arttırmanız önerilir

Hikkake Hunter 2.0This script serves as a successor to a previous script I wrote for identifying Hikkakes nearly two years ago.
The old version has been preserved here:
█ OVERVIEW
This script is a rework of an old script that identified the Hikkake candlestick pattern. While this pattern is not usually considered a part of the standard candlestick patterns set, I found a lot of value when finding a solution to identifying it. A Hikkake pattern is a 3-candle pattern where a middle candle is nested in between the range of the prior candle, and a candle that follows has a higher high and a higher low (bearish setup) or a lower high and a lower low (bullish setup). What makes this pattern unique is the "confirmation" status of the pattern; within 3 candles of this pattern's appearance, there must be a candle that closes above the high (bullish setup) or below the low (bearish setup) of the second candle. Additional flexibility has been added which allows the user to specify the number of candles (up to 5) that the pattern may have to confirm after its appearance.
█ CONCEPTS
This script will cover concepts mainly focusing on candlestick analysis, price analysis (with higher timeframes), and statistical analysis. I believe there is also educational value presented with the use of user-defined-types (UDTs) in accomplishing these concepts that I hope others will find useful.
Candlestick Analysis - Identification and confirmation of the patterns in the deprecated script were clunky and inefficient. While the previous script required the use of 6 candles to perform the confirmations of patterns (restricted solely to identifying patterns that confirmed in 3 candles or less), this script only requires 3 candles to identify and process patterns by utilizing a UDT representing a 'pattern object'. An object representing a pattern will be created when it has been identified, and fields within that object will be set for processing by the functions it is passed to. Pattern objects are held by a var array (values within the array persist between bars) and will be removed from this array once they have been confirmed or non-confirmed.
This is a significant deviation from the previous script's methods, as it prevents unnecessary re-evaluations of the confirmation status of patterns (i.e. Hikkakes confirmed on the first candle will no longer need to be checked for confirmations on the second or third; a pitfall of the deprecated version which required multiple booleans tracking prior confirmation statuses). This deviation is also what provides the flexibility in changing the number of candles that can pass before a pattern is deemed non-confirmed.
As multiple patterns can be confirmed simultaneously, this script uses another UDT representing a linked-list reduction of the pattern object used to process it. This liked-list object will then be used for Price Analysis.
Price Analysis - This script employs the use of a UDT which contains all the returns of confirmed patterns. The user specifies how many candles ahead of the confirmed pattern to calculate its return, as well as where this calculation begins. There are two settings: FROM APPEARANCE and FROM CONFIRMATION (default). Price differences are calculated from the open of the candle immediately following the candle which had confirmed the pattern to the close of the candle X candles ahead (default 10). ( SEE FEATURES )
Because of how Pine functions, this calculation necessitates a lookback on prior candles to identify when a pattern had been confirmed. This is accomplished with the following pseudo-code:
if not na(confirmed linked-list )
for all confirmed in list
GET MATRIX PLACEMENT
offset = FROM CONFIRMATION ? 0 : # of candles to confirm
openAtFind = open
percent return = ((close - openAtFind) / openAtFind) * 100
ADD percent return TO UDT IN MATRIX
All return UDTs are held in a matrix which breaks up these patterns into specific groups covered in the next section.
Higher Timeframes - This script makes a request.security call to a higher timeframe in order to identify a price range which breaks up these patterns into groups based on the 'partition' they had appeared in. The default values for this partitioning will break up the chart into three sections: upper, middle, and lower. The upper section represents the highest 20% of the yearly trading range that an asset has experienced. The lower section represents the trading range within a third (33%) of the yearly low. And the middle section represents the yearly high-low range between these two partitions.
The matrix containing all return UDTs will have these returns split up based on the number of candles required to confirm the pattern as well as the partition the pattern had appeared in. The underlying rationale is that patterns may perform better or worse at different parts of an asset's trading range.
Statistical Analysis - Once a pattern has been confirmed, the matrix containing all return UDTs will be queried to check if a 'returnArray' object has been created for that specific pattern. If not, one will be initialized and a confirmed linked-list object will be created that contains information pertinent to the matrix position of this object.
This matrix contains the returns of both the Bullish and Bearish Hikkake patterns, separated by the number of candles needed to confirm them, and by the partitions they had appeared in. For the standard 3 candles to confirm, this means the matrix will contain 18 elements (dependent on the number of candles allowed for confirmations; its size will range from 12 to 30).
When the required number of candles for Price Analysis passes, a percent return is calculated and added to the returnArray contained in the matrix at the location derived from the confirmed linked-list object's values. The return is added, and all values in the returnArray are updated using Pine's built in array.___ functions. This returnArray object contains the array of all returns, its size, its average, the median, the standard deviation of returns, and a separate 3-integer array which holds values that correspond to the types of returns experienced by this pattern (negative, neutral, and positive)*.
After a pattern has been confirmed, this script will place the partition and all of the aforementioned stats values (plus a 95% confidence interval of expected returns) related to that pattern onto the tooltip of the label that identifies it. This allows users to scroll over the label of a confirmed pattern to gauge its prior performance under specific conditions. The percent return of the specific pattern identified will later be placed onto the label tooltip as well. ( SEE LIMITATIONS )
The stats portion of this script also plays a significant role in how patterns are presented when using the Adaptive Coloring mode described in FEATURES .
*These values are incremented based on user-input related to what constitutes a 'negative' or 'positive' return. Default values would place any return by a pattern between -3% and 3% in the 'neutral' category, and values exceeding either end will be placed in the 'negative' or 'positive' categories.
█ FEATURES
This script contains numerous inputs for modifying its behavior and how patterns are presented/processed, separated into 5 groups.
Confirmation Setting - The most important input for this script's functioning. This input is a 'confirm=true' input and must be set by the user before the script is applied to the chart. It sets the number of candles that a pattern has to confirm once it has been identified.
Alert Settings - This group of booleans sets which types of alerts will fire during the scripts execution on the chart. If enabled, the four alerts will trigger when: a pattern has been identified, a pattern has been confirmed, a pattern has been non-confirmed, and show the return for that confirmed pattern in an alert. Because this script uses the 'alert' function and not 'alertcondition', these must be enabled before 'any alert() function call' is set in TradingView's 'alerts' settings.
Partition Settings - This group of inputs are responsible for creating (and viewing) the partitions that breaks the returns of the patterns identified up into their respective groups. The user may set the resolution to grab the range from, the length back of this resolution the partitions get their values from, the thresholds which breaks the partitions up into their groups, and modify the visibility (if they're shown, the colors, opacity) of these partitions.
Stats Settings - These inputs will drastically alter how patterns are presented and the resulting information derived from them after their appearance. Because of this section's importance, some of these inputs will be described in more detail.
P/L Sample Length - Defines the number of candles after the starting point to grab values from in the % return calculation for that pattern.
P/L Starting Point - Defines the starting point where the P/L calculation will take place. 'FROM APPEARANCE' will set the starting point at the candle immediately following the pattern's appearance. 'FROM CONFIRMATION' will place the starting point immediately following the candle which had confirmed the pattern. ( SEE LIMITATIONS )
Min Returns Needed - Sets how many times a specific pattern must appear (both by number of candles needed to confirm and by partition) before the statistics for that pattern are displayed onto the tooltip (and for gradient coloration in Adaptive Coloring mode).
Enable Adaptive Coloring - Changes the coloration of the patterns based on the bullish/bearishness of the specified Gradient Reference value of that pattern compared to the Return Tolerance values OR the minimum and maximum values of that specified Gradient Reference value contained in the matrix of all returns. This creates a color from a gradient using the user-specified colors and alters how many of the patterns may appear if prior performance is taken into account.
Gradient Reference - Defines which stats measure of returns will be used in the gradient color generation. The two settings are 'AVG' and 'MEDIAN'.
Hard Limit - This boolean sets whether the Return Tolerance values will not be replaced by values that exceed them from the matrix of returns in color gradient generation. This changes the scale of the gradient where any Gradient Reference values of patterns that exceed these tolerances will be colored the full bullish or bearish gradient colors, and anything in between them will be given a color from the gradient.
Visibility Settings - This last section includes all settings associated with the overall visibility of patterns found with this script. This includes the position of the labels and their colors (+ pattern colors without Adaptive Coloring being enabled), and showing patterns that were non-confirmed.
Most of these inputs in the script have these kinds of descriptions to what they do provided by their tooltips.
█ HOW TO USE
I attempted to make this script much easier to use in terms of analyzing the patterns and displaying the information to the user. The previous script would have the user go to the 'data window' side bar on TradingView to view the returns of a pattern after they had specified which pattern to analyze through the settings, needlessly convoluted. This aim at simplicity was achieved through the use of UDTs and specific code-design.
To use, simply apply the indicator to a chart, set the number of candles (between 2 and 5) for confirming this specific pattern and adjust the many settings described above at your leisure.
█ LIMITATIONS
Disclaimer - This is a tool created with the hopes of helping identify a specific pattern and provide an informative view about the performance of that pattern. Previous performance is not indicative of future results. None of this constitutes any form of financial advice, *use at your own risk*.
Statistical Analysis - This script assumes that all patterns will yield a NORMAL DISTRIBUTION regarding their returns which may not be reflective of reality. I personally have limited experience within the field of statistics apart from a few high school/college courses and make no guarantees that the calculation of the 95% confidence interval is correct. Please review the source code to verify for yourself that this interval calculation is correct (Function Name: f_DisplayStatsOnLabel).
P/L Starting Point - Because of when the object related to the confirmation status of a pattern is created (specifically the linked-list object) setting the 'P/L Starting Point' to 'FROM APPEARANCE' will yield the results of that P/L calculation at the same time as 'FROM CONFIRMATION'.
█ EXAMPLES
Default Settings:
Partition Background (default):
Partition Background (Resolution D : Length 30):
Adaptive Coloration:
Show Non-Confirmed:

theme_engineLibrary "theme_engine"
Theme Builder and Structure for live generative themes
init(_name)
New theme object.
Parameters:
_name : (string) opptional name
Returns: a VAR theme (holds it's vals when updated if not overwritten)
globals(theme, _h1, _h2, _h3, _h4, _s, _val, _contrast)
Create light/dark theme globals
Parameters:
theme : (theme) Theme to add theses to
_h1 : (float) Hue #1 for Template
_h2 : (float) Hue #2 for Template
_h3 : (float) Hue #3 for Template
_h4 : (float) Hue #4 for Template
_s : (float) Saturation of theme
_val : (float) Luminosity (light/dark)
_contrast : (float) Contrast to apply
Returns: Theme wwith adjusted colors
setConfig(theme, setting)
Apply a Settings object to a theme
Parameters:
theme : Theme object to apply settings to.
setting : settings to apply
Returns: theme
Types :
settings
Settings for a theme
Fields:
h1 : (float) Hue #1 for Template
h2 : (float) Hue #2 for Template
h3 : (float) Hue #3 for Template
h4 : (float) Hue #4 for Template
sat : (float) Saturation of theme
lum : (float) Luminosity (light/dark)
vib : (float) Vibrance (Contrast)
r : (float) Hue of Red
o : (float) Hue of Orange
y : (float) Hue of Yellow
g : (float) Hue of Green
a : (float) Hue of Aqua
b : (float) Hue of Blue
i : (float) Hue of Indigo
v : (float) Hue of Violet
satvals : (settings) Array for use if desired to customize Saturation per color
lumvals : (settings) Array for use if desired to customize Luminancce per color
mods
Modifiers Item for Use if desired
Fields:
val : (float)
size : (float)
depth : (float)
hue : (float)
sat : (float)
alpha : (float)
mix : (float)
emit : (float)
ch : (float)
step : (int)
dist : (int)
holds : (mods)
isin : (mods)
track : (color)
varient
Light/Dark/Custom Theme Varients
Fields:
bg : (color) Bacckground Color
fg : (color) Foreground Color
accent : (color) Accccent Color
secondary : (color) Secondary Color
txt : (color) Text Color
theme
Theme Object
Fields:
name : (string) Theme name
dark : (varient) Theme dark Varient
light : (varient) Theme light Varient
red : (color) Color for red
orange : (color) Color for orange
yellow : (color) Color for yellow
green : (color) Color for green
aqua : (color) Color for aqua
blue : (color) Color for blue
purple : (color) Color for purple
pink : (color) Color for pink
tweaks : (mods) Modifiers UDT to use for adjusters
themedict
Fields:
names : (string ) Names of themes
themes : (theme ) Theme Items
VWAP Boulevard [vnhilton](OVERVIEW)
The idea of this indicator comes from traders identifying supply to mainly look for shorts. Scenarios would be gap ups or pump & dumps where huge volume is transacted, & bag-holders are present. Some traders would draw resistance lines, I myself used to draw supply zones using the volume profile on that day, & others used the day VWAP on those days. VWAP Boulevard (I believe the name comes from the trader named team3dstocks) draws day VWAP lines from the highest volume days for a given period (excluding the current day).
(FEATURES)
- Draws horizontal & vertical lines from up to 250 highest volume days out of up to 3568 days, with the ability to hide either of these lines, their thicknesses, styles
- Extend/cut horizontal lines, or extend them all the way to the right
- Show the day VWAP, volume & age for these days in labels, with the ability to show what information you want to see only
- Separate customizable color forms for the lines & labels - ordinary (1 color); volume (2 color gradient from lowest to highest volume of the highest volume days); age (2 color gradient from youngest to oldest volume of the highest volume days)
- Edit offset & size of labels, & hide them
- Hide vertical lines
From left to right: Age color; ordinary color; volume color
250 highest volume days in the past year. Very messy so it's very likely you won't be using this but the ability to draw lines from 250 highest volume days is there if needed
(DRAWDOWNS)
- This indicator will only on the daily timeframe (error message will show up if unaware of this, & can be toggled off). Unfortunately, this would mean you would have to draw the lines manually yourself if you wish to use them on intraday timeframes.
- You may also encounter the 'Pine cannot determine the referencing length of a series. Try using max_bars_back' error. This occurs when the lookback period is very high & the indicator attempts to recalculate I believe. If this happens then reload the indicator.
The logic I used to obtain the highest volume days were to put all of the volume days in a given period in 1 array, then to sort them from highest to lowest, & also store their sorted indices in an separate array as well, so that drawings for each volume day could be done from the 2 arrays.
//Volume for last N periods
var int pastVol = array.new_int(lookbackPeriodFixed)
for i = 0 to lookbackPeriodFixed - 1
array.set(pastVol, i, int(volume ))
sortedIndices = array.sort_indices(pastVol, order.descending) //All Indices of sorted volume from highest to lowest
sortedIndices2 = array.slice(sortedIndices, 0, highestVolDays) //Indices of sorted volume from highest to lowest
array.sort(pastVol, order.descending) //All Volume sorted from highest to lowest
pastVol2 = array.slice(pastVol, 0, highestVolDays) //Volume sorted from highest to lowest
//Drawings
for i = 0 to highestVolDays - 1
index := array.get(sortedIndices, i)
vol := array.get(pastVol, i)
Since these array sizes were determined from the lookback period, it would mean that the request.security() function used to obtain daily values on intraday timeframes wouldn't work for a lookback period >20 (20 * 2 values I believe, which are the day VWAP & the day volume) as TradingView has put a maximum amount of calls of 40 in 1 script. Therefore, for intraday plots to work I would have to change the logic for getting the day VWAP & day volume for the highest days, as the request.security() function doesn't work on for loops, & this would also mean that the user would only be able to draw lines from up to 20 highest volume days instead of 250. I couldn't go forward with this as I wasn't able to find the logic to pick the highest volume days & their day VWAPs & times (indexes) without using a for loop. If anyone has any solutions (including for the 'Pine cannot determine the referencing length of a series. Try using max_bars_back' error) then please let me know. I've also left commented-out code for dealing with intraday drawings for future use.

WelcomeUDT█ OVERVIEW
This is a simplest example of user-defined types (UDT) or objects , which simplify as alternative to hello world.
█ CREDITS
Tradingview
█ USAGE
These are the types used during initializations, commonly variables.
export type Settings
int bar
float price
string phrase
...
Example of library function to print out label.
export printLabel(Settings setup) =>
if setup.variable
var label lab = na
label.delete(lab)
lab := label.new(setup.bar, setup.price, setup.phrase, color = setup.bg)
else
label.new(setup.bar, setup.price, setup.phrase, color = setup.bg)
Usage of types
Settings setup = Settings.new(bar_index , priceInput, phraseInput, colorInput, variableInput)
Alternative way to write types
Settings setup = Settings.new(
bar = bar_index ,
price = priceInput,
phrase = phraseInput,
variable = variableInput)
Usage of types into custom function / library function.
printLabel(setup)
printLabel(Settings)
Print out label
Parameters:
Settings : types
Returns: Label object
Settings
Initialize type values
Fields:
bar : X position for label
price : Y position for label
phrase : Text for label
bg : Color for label
variable : Boolean for enable new line and delete line

Parametric VaRValue at Risk can also be computed parametrically using a method known as variance/co-variance VaR. This method allows you to simulate a range of possibilities based on historical return distribution properties rather than actual return values. It's actually more accurate even though it assumes a normal distribution especially when not much data is available

Beta ScreenerThis script allows you to screen up to 38 symbols for their beta. It also allows you to compare the list to not only SPY but also CRYPTO10! Features include custom time frame and custom colors.
Here is a refresher on what beta is:
Beta (β) is a measure of the volatility—or systematic risk—of a security or portfolio compared to the market as a whole (usually the S&P 500 ). Stocks with betas higher than 1.0 can be interpreted as more volatile than the S&P 500 .
Beta is used in the capital asset pricing model (CAPM), which describes the relationship between systematic risk and expected return for assets (usually stocks). CAPM is widely used as a method for pricing risky securities and for generating estimates of the expected returns of assets, considering both the risk of those assets and the cost of capital.
How Beta Works
A beta coefficient can measure the volatility of an individual stock compared to the systematic risk of the entire market. In statistical terms, beta represents the slope of the line through a regression of data points. In finance, each of these data points represents an individual stock's returns against those of the market as a whole.
Beta effectively describes the activity of a security's returns as it responds to swings in the market. A security's beta is calculated by dividing the product of the covariance of the security's returns and the market's returns by the variance of the market's returns over a specified period.
cov (a,b)/var(b)
Intrabar Efficiency Ratio█ OVERVIEW
This indicator displays a directional variant of Perry Kaufman's Efficiency Ratio, designed to gauge the "efficiency" of intrabar price movement by comparing the sum of movements of the lower timeframe bars composing a chart bar with the respective bar's movement on an average basis.
█ CONCEPTS
Efficiency Ratio (ER)
Efficiency Ratio was first introduced by Perry Kaufman in his 1995 book, titled "Smarter Trading". It is the ratio of absolute price change to the sum of absolute changes on each bar over a period. This tells us how strong the period's trend is relative to the underlying noise. Simply put, it's a measure of price movement efficiency. This ratio is the modulator utilized in Kaufman's Adaptive Moving Average (KAMA), which is essentially an Exponential Moving Average (EMA) that adapts its responsiveness to movement efficiency.
ER's output is bounded between 0 and 1. A value of 0 indicates that the starting price equals the ending price for the period, which suggests that price movement was maximally inefficient. A value of 1 indicates that price had travelled no more than the distance between the starting price and the ending price for the period, which suggests that price movement was maximally efficient. A value between 0 and 1 indicates that price had travelled a distance greater than the distance between the starting price and the ending price for the period. In other words, some degree of noise was present which resulted in reduced efficiency over the period.
As an example, let's say that the price of an asset had moved from $15 to $14 by the end of a period, but the sum of absolute changes for each bar of data was $4. ER would be calculated like so:
ER = abs(14 - 15)/4 = 0.25
This suggests that the trend was only 25% efficient over the period, as the total distanced travelled by price was four times what was required to achieve the change over the period.
Intrabars
Intrabars are chart bars at a lower timeframe than the chart's. Each 1H chart bar of a 24x7 market will, for example, usually contain 60 intrabars at the LTF of 1min, provided there was market activity during each minute of the hour. Mining information from intrabars can be useful in that it offers traders visibility on the activity inside a chart bar.
Lower timeframes (LTFs)
A lower timeframe is a timeframe that is smaller than the chart's timeframe. This script determines which LTF to use by examining the chart's timeframe. The LTF determines how many intrabars are examined for each chart bar; the lower the timeframe, the more intrabars are analyzed, but fewer chart bars can display indicator information because there is a limit to the total number of intrabars that can be analyzed.
Intrabar precision
The precision of calculations increases with the number of intrabars analyzed for each chart bar. As there is a 100K limit to the number of intrabars that can be analyzed by a script, a trade-off occurs between the number of intrabars analyzed per chart bar and the chart bars for which calculations are possible.
Intrabar Efficiency Ratio (IER)
Intrabar Efficiency Ratio applies the concept of ER on an intrabar level. Rather than comparing the overall change to the sum of bar changes for the current chart's timeframe over a period, IER compares single bar changes for the current chart's timeframe to the sum of absolute intrabar changes, then applies smoothing to the result. This gives an indication of how efficient changes are on the current chart's timeframe for each bar of data relative to LTF bar changes on an average basis. Unlike the standard ER calculation, we've opted to preserve directional information by not taking the absolute value of overall change, thus allowing it to be utilized as a momentum oscillator. However, by taking the absolute value of this oscillator, it could potentially serve as a replacement for ER in the design of adaptive moving averages.
Since this indicator preserves directional information, IER can be regarded as similar to the Chande Momentum Oscillator (CMO) , which was presented in 1994 by Tushar Chande in "The New Technical Trader". Both CMO and ER essentially measure the same relationship between trend and noise. CMO simply differs in scale, and considers the direction of overall changes.
█ FEATURES
Display
Three different display types are included within the script:
• Line : Displays the middle length MA of the IER as a line .
Color for this display can be customized via the "Line" portion of the "Visuals" section in the script settings.
• Candles : Displays the non-smooth IER and two moving averages of different lengths as candles .
The `open` and `close` of the candle are the longest and shortest length MAs of the IER respectively.
The `high` and `low` of the candle are the max and min of the IER, longest length MA of the IER, and shortest length MA of the IER respectively.
Colors for this display can be customized via the "Candles" portion of the "Visuals" section in the script settings.
• Circles : Displays three MAs of the IER as circles .
The color of each plot depends on the percent rank of the respective MA over the previous 100 bars.
Different colors are triggered when ranks are below 10%, between 10% and 50%, between 50% and 90%, and above 90%.
Colors for this display can be customized via the "Circles" portion of the "Visuals" section in the script settings.
With either display type, an optional information box can be displayed. This box shows the LTF that the script is using, the average number of lower timeframe bars per chart bar, and the number of chart bars that contain LTF data.
Specifying intrabar precision
Ten options are included in the script to control the number of intrabars used per chart bar for calculations. The greater the number of intrabars per chart bar, the fewer chart bars can be analyzed.
The first five options allow users to specify the approximate amount of chart bars to be covered:
• Least Precise (Most chart bars) : Covers all chart bars by dividing the current timeframe by four.
This ensures the highest level of intrabar precision while achieving complete coverage for the dataset.
• Less Precise (Some chart bars) & More Precise (Less chart bars) : These options calculate a stepped LTF in relation to the current chart's timeframe.
• Very precise (2min intrabars) : Uses the second highest quantity of intrabars possible with the 2min LTF.
• Most precise (1min intrabars) : Uses the maximum quantity of intrabars possible with the 1min LTF.
The stepped lower timeframe for "Less Precise" and "More Precise" options is calculated from the current chart's timeframe as follows:
Chart Timeframe Lower Timeframe
Less Precise More Precise
< 1hr 1min 1min
< 1D 15min 1min
< 1W 2hr 30min
> 1W 1D 60min
The last five options allow users to specify an approximate fixed number of intrabars to analyze per chart bar. The available choices are 12, 24, 50, 100, and 250. The script will calculate the LTF which most closely approximates the specified number of intrabars per chart bar. Keep in mind that due to factors such as the length of a ticker's sessions and rounding of the LTF, it is not always possible to produce the exact number specified. However, the script will do its best to get as close to the value as possible.
Specifying MA type
Seven MA types are included in the script for different averaging effects:
• Simple
• Exponential
• Wilder (RMA)
• Weighted
• Volume-Weighted
• Arnaud Legoux with `offset` and `sigma` set to 0.85 and 6 respectively.
• Hull
Weighting
This script includes the option to weight IER values based on the percent rank of absolute price changes on the current chart's timeframe over a specified period, which can be enabled by checking the "Weigh using relative close changes" option in the script settings. This places reduced emphasis on IER values from smaller changes, which may help to reduce noise in the output.
█ FOR Pine Script™ CODERS
• This script imports the recently published lower_ltf library for calculating intrabar statistics and the optimal lower timeframe in relation to the current chart's timeframe.
• This script uses the recently released request.security_lower_tf() Pine Script™ function discussed in this blog post .
It works differently from the usual request.security() in that it can only be used on LTFs, and it returns an array containing one value per intrabar.
This makes it much easier for programmers to access intrabar information.
• This script implements a new recommended best practice for tables which works faster and reduces memory consumption.
Using this new method, tables are declared only once with var , as usual. Then, on the first bar only, we use table.cell() to populate the table.
Finally, table.set_*() functions are used to update attributes of table cells on the last bar of the dataset.
This greatly reduces the resources required to render tables.
Look first. Then leap.

ConsoleLibrary "Console"
█ OVERVIEW
An easy way to output messages to a console like table using a a simple "print" function that can be called from anywhere in your code including functions.
█ Supports:
- Scrollable console messages
- Customisable number of displayed messages
- More than one "console" for different types of output if required
- The ability to choose which message to start viewing from (useful if the message list is long)
- The ability to place the console table at different positions on the chart to mitigate against
overwriting an existing table.
█ Limitations:
The "scrollbar" handle is actually a modified time widget handle. As the handle is grabbed and moved left or right across the chart bars, this script calculates the offset of the bar being pointed to from the last bar in the chart and uses that as the console message offset. However, It isn't possible to position this on the last chart bar with code.
So there are two solutions:
1) Manually change timestamp of the variable scrollStart to the current time (roughly)
eg. scrollStart = "25 Dec 2022 14:30 +0000"
2) Use a higher timeframe (Weeks or Months) and visually find the scroll bar. If it is to the right of the chart bars the console output will read NaN. Grab the handle and move it left and it will snap to the last chart candle position. If it is to the left then find it and move it to the right as needed.
█ Notes On Usage
- Import the library as console (the call will be console.print(...) )
- Assign a console variable name and call the console.initialise function
eg. var con1=console.initialise()
- Use the console.print() function to print a message or messages
This takes two parameters:
_consoleName :this is the console name you are printing to
_message: this is the message that you want to display. It is a string and can be built in the normal way using any pinescript string functions like str.tostring() etc
- Use the console.display function to display the messages.
To work as intended this display function should be placed at the last line with the following code
if i_showMessages
....if i_displayTable == "con1"
........display(con1, i_lineOffset, i_rowsToDisplay, i_gotoMsg, posn)
(More "consoles" can be written to and the example code provided with the library shows this in more detail. Also, the indents don't show in these notes)
Lastly, placement of a console.print() without a qualifying "if" statement will occur for every bar. This may be desired. If not then use under an if statement (example in the supplied code).
Happy debugging :)
-----------------------------------------------------------------------------------------------------------
initialise()
initialise: creates the message array
Parameters:
none :
Returns: message array: this is assigned to the "console" identifier
print(_consoleName, _message)
used to output the desired text string to the console
Parameters:
_consoleName : : the message array
_message : : the console message
Returns: none
display(_consoleName, _lineOffset, _rowsToDisplay, _gotoMsg, _posn)
display: placed in the last section of code. Displays the console messages
Parameters:
_consoleName : : the message array
_lineOffset : : the setting of the scroll bar (time widget)
_rowsToDisplay : : how many rows to show in the console table
_gotoMsg : : which message to display from (default is 0)
_posn : : where the console table will be displayed
Returns: none
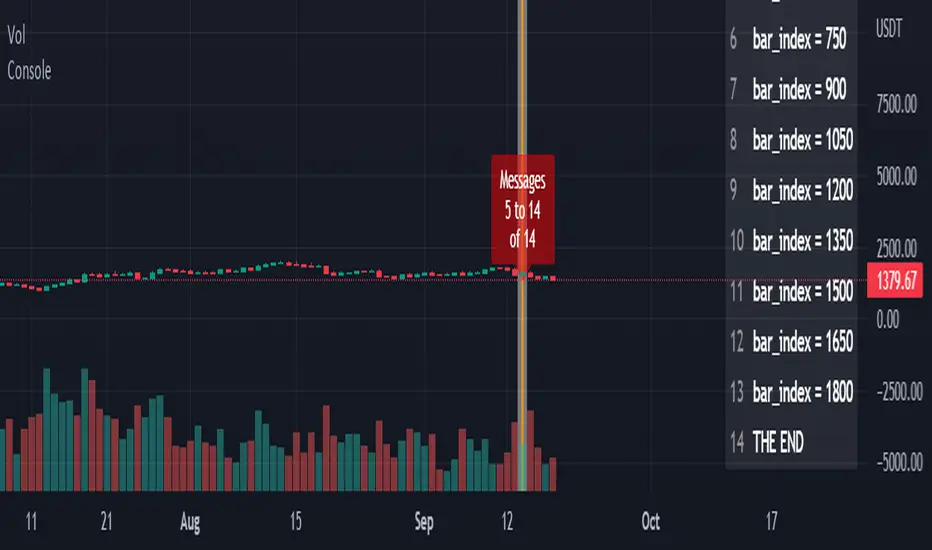
KAIRI RELATIVE INDEXAn old but gold Japanese indicator for Mean Reverting strategies and ideal for Pairs Trading...
The Kairi Relative Index measures the distance between closing prices and a Moving Average in percent value (generally SMA).
Extreme reading in the KRI are considered buy and sell signals.
Extreme readings will vary by asset, with more volatile assets reaching much higher and lower extremes that more sedate assets.
The KRI is not an accurate timing signal, and therefore, should be combined with other forms of analysis to generate trade signals.
You can calculate percent difference between the price and 10 different types of Moving Averages in this version of KAIRI as:
SMA : Simple Moving Average
EMA : Exponential Moving Average
WMA : Weighted Moving Average
TMA : Triangular Moving Average
VAR : Variable Index Dynamic Moving Average a.k.a. VIDYA
WWMA : Welles Wilder's Moving Average
ZLEMA : Zero Lag Exponential Moving Average
TSF : True Strength Force
HULL : Hull Moving Average
VWMA: Volume Veighted Moving Average
Personal advice: try using bigger length of Moving Averages like 50-100-200 for pairs and mean reversion strategies
VisibleChart█ OVERVIEW
This library is a Pine programmer’s tool containing functions that return values calculated from the range of visible bars on the chart.
This is now possible in Pine Script™ thanks to the recently-released chart.left_visible_bar_time and chart.right_visible_bar_time built-ins, which return the opening time of the leftmost and rightmost bars on the chart. These values update as traders scroll or zoom their charts, which gives way to a class of indicators that can dynamically recalculate and draw visuals on visible bars only, as users scroll or zoom their charts. We hope this library's functions help you make the most of the world of possibilities these new built-ins provide for Pine scripts.
For an example of a script using this library, have a look at the Chart VWAP indicator.
█ CONCEPTS
Chart properties
The new chart.left_visible_bar_time and chart.right_visible_bar_time variables return the opening time of the leftmost and rightmost bars on the chart. They are only two of many new built-ins in the `chart.*` namespace. See this blog post for more information, or look them up by typing "chart." in the Pine Script™ Reference Manual .
Dynamic recalculation of scripts on visible bars
Any script using chart.left_visible_bar_time or chart.right_visible_bar_time acquires a unique property, which triggers its recalculation when traders scroll or zoom their charts in such a way that the range of visible bars on the chart changes. This library's functions use the two recent built-ins to derive various values from the range of visible bars.
Designing your scripts for dynamic recalculation
For the library's functions to work correctly, they must be called on every bar. For reliable results, assign their results to global variables and then use the variables locally where needed — not the raw function calls.
Some functions like `barIsVisible()` or `open()` will return a value starting on the leftmost visible bar. Others such as `high()` or `low()` will also return a value starting on the leftmost visible bar, but their correct value can only be known on the rightmost visible bar, after all visible bars have been analyzed by the script.
You can plot values as the script executes on visible bars, but efficient code will, when possible, create resource-intensive labels, lines or tables only once in the global scope using var , and then use the setter functions to modify their properties on the last bar only. The example code included in this library uses this method.
Keep in mind that when your script uses chart.left_visible_bar_time or chart.right_visible_bar_time , your script will recalculate on all bars each time the user scrolls or zooms their chart. To provide script users with the best experience you should strive to keep calculations to a minimum and use efficient code so that traders are not always waiting for your script to recalculate every time they scroll or zoom their chart.
Another aspect to consider is the fact that the rightmost visible bar will not always be the last bar in the dataset. When script users scroll back in time, a large portion of the time series the script calculates on may be situated after the rightmost visible bar. We can never assume the rightmost visible bar is also the last bar of the time series. Use `barIsVisible()` to restrict calculations to visible bars, but also consider that your script can continue to execute past them.
Look first. Then leap.
█ FUNCTIONS
The library contains the following functions:
barIsVisible()
Condition to determine if a given bar is within the users visible time range.
Returns: (bool) True if the the calling bar is between the `chart.left_visible_bar_time` and the `chart.right_visible_bar_time`.
high()
Determines the value of the highest `high` in visible bars.
Returns: (float) The maximum high value of visible chart bars.
highBarIndex()
Determines the `bar_index` of the highest `high` in visible bars.
Returns: (int) The `bar_index` of the `high()`.
highBarTime()
Determines the bar time of the highest `high` in visible bars.
Returns: (int) The `time` of the `high()`.
low()
Determines the value of the lowest `low` in visible bars.
Returns: (float) The minimum low value of visible chart bars.
lowBarIndex()
Determines the `bar_index` of the lowest `low` in visible bars.
Returns: (int) The `bar_index` of the `low()`.
lowBarTime()
Determines the bar time of the lowest `low` in visible bars.
Returns: (int) The `time` of the `low()`.
open()
Determines the value of the opening price in the visible chart time range.
Returns: (float) The `open` of the leftmost visible chart bar.
close()
Determines the value of the closing price in the visible chart time range.
Returns: (float) The `close` of the rightmost visible chart bar.
leftBarIndex()
Determines the `bar_index` of the leftmost visible chart bar.
Returns: (int) A `bar_index`.
rightBarIndex()
Determines the `bar_index` of the rightmost visible chart bar.
Returns: (int) A `bar_index`
bars()
Determines the number of visible chart bars.
Returns: (int) The number of bars.
volume()
Determines the sum of volume of all visible chart bars.
Returns: (float) The cumulative sum of volume.
ohlcv()
Determines the open, high, low, close, and volume sum of the visible bar time range.
Returns: ( ) A tuple of the OHLCV values for the visible chart bars. Example: open is chart left, high is the highest visible high, etc.
chartYPct(pct)
Determines a price level as a percentage of the visible bar price range, which depends on the chart's top/bottom margins in "Settings/Appearance".
Parameters:
pct : (series float) Percentage of the visible price range (50 is 50%). Negative values are allowed.
Returns: (float) A price level equal to the `pct` of the price range between the high and low of visible chart bars. Example: 50 is halfway between the visible high and low.
chartXTimePct(pct)
Determines a time as a percentage of the visible bar time range.
Parameters:
pct : (series float) Percentage of the visible time range (50 is 50%). Negative values are allowed.
Returns: (float) A time in UNIX format equal to the `pct` of the time range from the `chart.left_visible_bar_time` to the `chart.right_visible_bar_time`. Example: 50 is halfway from the leftmost visible bar to the rightmost.
chartXIndexPct(pct)
Determines a `bar_index` as a percentage of the visible bar time range.
Parameters:
pct : (series float) Percentage of the visible time range (50 is 50%). Negative values are allowed.
Returns: (float) A time in UNIX format equal to the `pct` of the time range from the `chart.left_visible_bar_time` to the `chart.right_visible_bar_time`. Example: 50 is halfway from the leftmost visible bar to the rightmost.
whenVisible(src, whenCond, length)
Creates an array containing the `length` last `src` values where `whenCond` is true for visible chart bars.
Parameters:
src : (series int/float) The source of the values to be included.
whenCond : (series bool) The condition determining which values are included. Optional. The default is `true`.
length : (simple int) The number of last values to return. Optional. The default is all values.
Returns: (float ) The array ID of the accumulated `src` values.
avg(src)
Gathers values of the source over visible chart bars and averages them.
Parameters:
src : (series int/float) The source of the values to be averaged. Optional. Default is `close`.
Returns: (float) A cumulative average of values for the visible time range.
median(src)
Calculates the median of a source over visible chart bars.
Parameters:
src : (series int/float) The source of the values. Optional. Default is `close`.
Returns: (float) The median of the `src` for the visible time range.
vVwap(src)
Calculates a volume-weighted average for visible chart bars.
Parameters:
src : (series int/float) Source used for the VWAP calculation. Optional. Default is `hlc3`.
Returns: (float) The VWAP for the visible time range.
Buy/Sell on the levelsThis script is generally
My describe is:
There are a lot of levels we would like to buy some crypto.
When the price has crossed the level-line - we buy, but only if we have the permission in array(2)
When we have bought the crypto - we lose the permission for buy for now(till we will sell it on the next higher level)
When we sell some crypto(on the buying level + 1) we have the permission again.
There also are 2 protect indicators. We can buy if these indicators both green only(super trend and PIVOT )
Jun 12
Release Notes: Hello there,
Uncomment this section before use for real trade:
if array.get(price_to_sellBue, i) >= open and array.get(price_to_sellBue, i) <= close// and
//direction < 0 and permission_for_buy != 0
Here is my script.
In general - this is incredible simple script to use and understand.
First of all You can see this script working with only long orders, it means we going to get money if crypto grows only. Short orders we need to close the position on time.
In this script we buy crypto and sell with step 1% upper.
You can simply change the step by changing the price arrays.
Please note, if You want to see where the levels of this script is You Have to copy the next my indicator called LEVEL 1%
In general - if the price has across the price-level we buy some crypto and loose permission for buying for this level till we sell some crypto. There is ''count_of_orders" array field with value 2. When we bought some crypto the value turns to 0. 0 means not allowed to by on this level!!! The script buy if the bar is green only(last tick).
The script check every level(those we can see in "price_to_sellBue" array).
If the price across one of them - full script runs. After buying(if it possible) we check is there any crypto for sell on the level.
We check all levels below actual level( of actual level - ''i'' than we check all levels from 0 to i-1).
If there is any order that has value 0 in count of orders and index <= i-1 - we count it to var SELL amount and in the end of loop sell all of it.
Pay attention - it sells only if price across the level with red bar AND HAS ORDERS TO SELL WHICH WAS BOUGHT BELOW!!!
In Strategy tester it shows not-profitables orders sometimes, because if You have old Long position - it sells it first. First in - first out.
If the price goes down for a long time and You sell after 5 buys You sell the first of it with the highest value.
There is 2 protection from horrible buying in this strategy. The first one - Supertrend. If the supertrend is red - there is no permission for buy.
The second one - something between PIVOT and supertrend but with switcher.
If the price across last minimum - switcher is red - no permission for buy and the actual price becomes last minimum . The last maximum calculated for last 100 bars.
When the price across last maximum - switcher is green, we can buy. The last minimum calculation for last 100 bars, last maximum is actual price.
This two protections will save You from buying if price get crash down.
Enjoy my script.
Should You need the code or explanation, You have any ideas how to improve this crypt, contact me.
Vladyslav.
Jun 12
Release Notes: Here has been uncommented the protection for buy in case of price get down.
5 hours ago
Release Notes: Changed rages up to actual price to make it work

Open Interest Delta with MAs[Binance Perpetuals]!!!!! This indicator only shows Binance Perpetuals Open Interest Delta !!!!!
!!!!! When Binance Spot pair charts is selected, It still shows the perpetual contract Open Interest, if the pair on the chart is tradeble on perpetual contracts. I assume you know what Open Interest is. !!!!!
ZLEMA , Tillson, VAR MAs codes are coming from @KivancOzbilgic => SuperTrended Moving Averages
KAMA code is coming from @HPOTTER => Kaufman Moving Average Adaptive ( KAMA )

fontilabLibrary "fontilab"
Provides function's indicators for pivot - trend - resistance.
pivots(src, lenght, isHigh) Detecting pivot points (and returning price + bar index.
Parameters:
src : The chart we analyse.
lenght : Used for the calcul.
isHigh : lookging for high if true, low otherwise.
Returns: The bar index and the price of the pivot.
calcDevThreshold(tresholdMultiplier, closePrice) Calculate deviation threshold for identifying major swings.
Parameters:
tresholdMultiplier : Usefull to equilibrate the calculate.
closePrice : Close price of the chart wanted.
Returns: The deviation threshold.
calcDev(basePrice, price) Custom function for calculating price deviation for validating large moves.
Parameters:
basePrice : The reference price.
price : The price tested.
Returns: The deviation.
pivotFoundWithLines(dev, isHigh, index, price, dev_threshold, isHighLast, pLast, iLast, lineLast) Detecting pivots that meet our deviation criteria.
Parameters:
dev : The deviation wanted.
isHigh : The type of pivot tested (high or low).
index : The Index of the pivot tested.
price : The chart price wanted.
dev_threshold : The deviation treshold.
isHighLast : The type of last pivot.
pLast : The pivot price last.
iLast : Index of the last pivot.
lineLast : The lst line.
Returns: The Line and bool is pivot High.
getDeviationPivots(thresholdMultiplier, depth, lineLast, isHighLast, iLast, pLast, deleteLines, closePrice, highPrice, lowPrice) Get pivot that meet our deviation criteria.
Parameters:
thresholdMultiplier : The treshold multiplier.
depth : The depth to calculate pivot.
lineLast : The last line.
isHighLast : The type of last pivot
iLast : Index of the last pivot.
pLast : The pivot price last.
deleteLines : If the line are draw or not.
closePrice : The chart close price.
highPrice : The chart high price.
lowPrice : The chart low price.
Returns: All pivot the informations.
getElIntArrayFromEnd() Get the last element of an int array.
getElFloatArrayFromEnd() Get the last element of an float array.
getElBoolArrayFromEnd() Get the last element of a bool array.
isTrendContinuation(isTrendUp, arrayBounds, lastPrice, precision) Check if last price is between bounds array.
Parameters:
isTrendUp : Is actual trend up.
arrayBounds : The trend array.
lastPrice : The pivot Price that just be found.
precision : The percent we add to actual bounds to validate a move.
Returns: na if price is between bounds, true if continuation, false if not.
getTrendPivots(trendBarIndexes, trendPrices, trendPricesIsHigh, interBarIndexes, interPrices, interPricesIsHigh, isTrendHesitate, isTrendUp, trendPrecision, pLast, iLast, isHighLast) Function to update array and trend related to pivot trend interpretation.
Parameters:
trendBarIndexes : The array trend bar index.
trendPrices : The array trend price.
trendPricesIsHigh : The array trend is high.
interBarIndexes : The array inter bar index.
interPrices : The array inter price.
interPricesIsHigh : The array inter ishigh.
isTrendHesitate : The actual status of is trend hesitate.
isTrendUp : The actual status of is trend up.
trendPrecision : The var precision to add in "iscontinuation" function.
pLast : The last pivot price.
iLast : The last pivot bar index.
isHighLast : The last pivot "isHigh".
Returns: trend & inter arrays, is trend hesitate, is trend up.
drawBoundLines(startIndex, startPrice, endIndex, endPrice, breakingPivotIndex, breakingPivotPrice, isTrendUp) Draw bounds and breaking line of the trend.
Parameters:
startIndex : Index of the first bound line.
startPrice : Price of first bound line.
endIndex : Index of second bound line.
endPrice : price of second bound line.
breakingPivotIndex : The breaking line index.
breakingPivotPrice : The breaking line price.
isTrendUp : The actual status of the trend.
Returns: The lines bounds and breaking line.
