L'MACD GUNHi all!
I would like to present you my universal MACD module.
In addition to the standard functions I have added several improvements:
Source Selection.
In addition to the standard calculation of the moving average "EMA", in the parameter "MA Type" I have added 52 more methods for calculating the MA! :
ADXMA, AHMA, ALF, ALMA, ARI, ARSI, BlackFilter, CTI, DoubleEma, DTA, DWMA, EEO, EHMA, ELA, EMARSI, EREA, HEMA, hma, HWMA, JAMA, KA, KAMA, LSMA, LWMA, McGinley_2, MNMA, PAW, REMA, rma, RMF, RMTA, RWMA, sma, SMMA, SuperSmooth, THMA, TilsonT3, TMA, TRAMA, TripleEma, TSF, VAMA, VAR, VHMA, VIDYA, VVMA, vwma, WCD, wma, WWMA, ZEMA, ZLMA !
Additional histogram and lines from the higher timeframe. With the parameter "Multiple of TF" you can specify on which timeframe the standard histogram should be zoomed.
The Zoom function allows increasing or decreasing the size of the histogram. (It does not affect the calculations in any way, it is only used for visualization purposes.)
How to use it?
I recommend using it as a standard MACD. You can test different types of moving averages thanks to my modules and choose the one you find most suitable.
Tips:
The script is slightly heavy and may take a little longer to load than usual.
All MA types are in alphabetical order and tied to numbers.
Next to the "MA Type" parameter there is a hint which method of calculating MA corresponds to the figure. The default is 15. In the hint 15 = EMA. This is the standard method of calculating the MAСD.
To select the MA more quickly. You can switch them with the mouse wheel or the arrows on the keyboard.
I use the standard parameters prescribed in the script.
The code is calibrated for any TF and displays as correctly as possible. Can be used on any type of chart.
Поиск скриптов по запросу "VAR+计量模型+黄金期货"

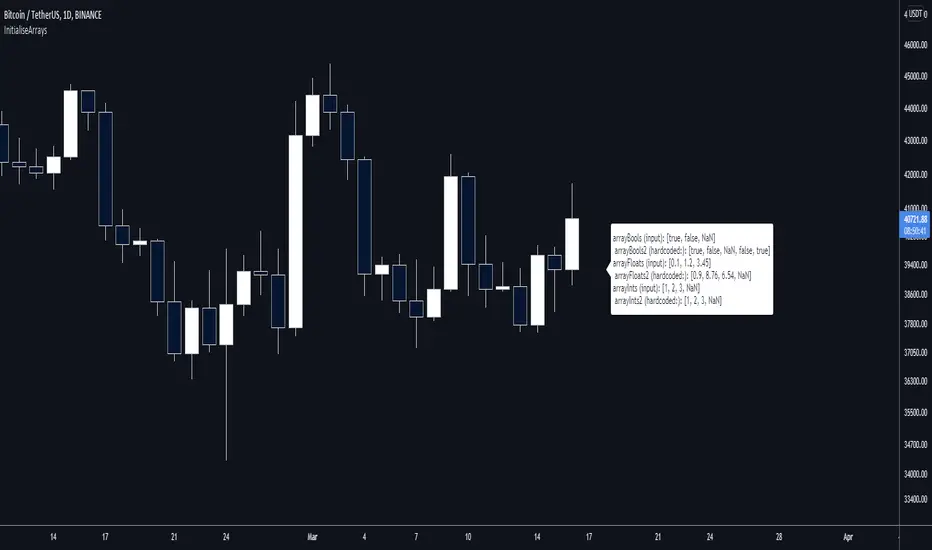
InitialiseArraysLibrary "InitialiseArrays"
@description: Efficiently create arrays, populating them with an arbitrary number of elements and setting their starting values. Works with a mix of typed and na values.
A limitation of the built-in functions to create arrays is that while you can create and populate arrays with a single command, you can only set all elements to the same value in this way.
Or, you can create an array from a set of values or variables, but you can't include any na values.
Now, it's easy enough to work around this, but I wanted to make something more efficient (because I want to use lots of arrays), hence this library.
Calling a function from here is more efficient because you only do it once (assuming it's a var) and don't evaluate an if condition each run, and don't create unnecessary variables.
It's also easier to read and takes less space.
f_initialiseBoolArray()
@function f_initialiseBoolArray(string _values) Creates a boolean array, populated with the values that you specify in the input string.
@param _values is a string that contains a comma-separated list of the values that you want to initialise the boolean array with. Values other than true, false, and na are disregarded. Spaces are disregarded.
@returns Returns a boolean array of arbitrary length.
f_initialiseFloatArray()
@function f_initialiseFloatArray(string _values) Creates a float array, populated with the values that you specify in the input string.
@param _values is a string that contains a comma-separated list of the values that you want to initialise the float array with. Non-numerical entries are converted to NaN values. Spaces are disregarded.
@returns Returns a float array of arbitrary length.
f_initialiseIntArray()
@function f_initialiseIntArray(string _values) Creates an int array, populated with the values that you specify in the input string.
@param _values is a string that contains a comma-separated list of the values that you want to initialise the int array with. Floating-point numbers are rounded down to the nearest integer. Any na values are preserved. Spaces are disregarded.
@returns Returns a float array of arbitrary length.
V1 includes functions for bools, floats, and ints. I might extend it if people want.
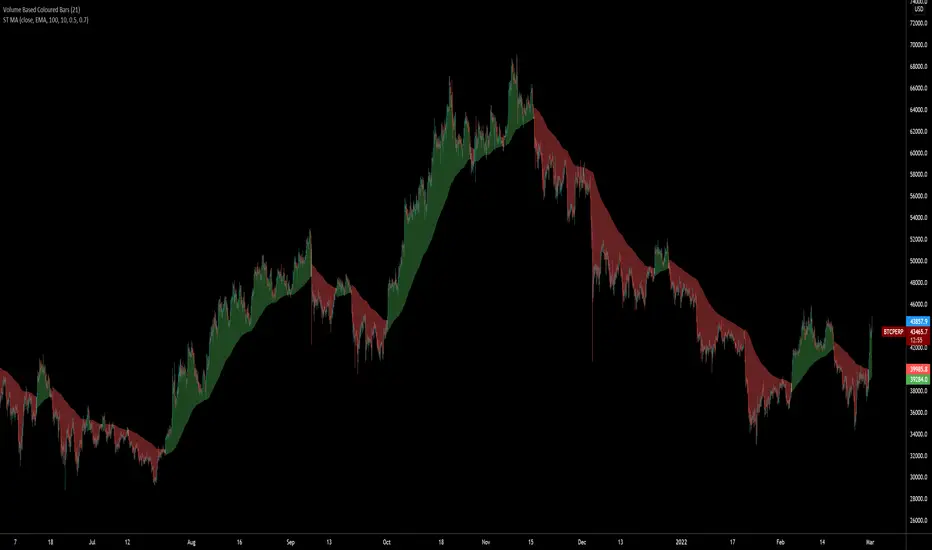
SuperTrended Moving AveragesA different approach to SuperTrend:
adding 100 periods Exponential Moving Average in calculation of SuperTrend and also 0.5 ATR Multiplier to have a clear view of the ongoing trend and also provides significant Supports and Resistances.
Default Moving Average type set as EMA (Exponential Moving Average) but users can choose from 11 different Moving Average types as:
SMA : Simple Moving Average
EMA : Exponential Moving Average
WMA : Weighted Moving Average
DEMA : Double Exponential Moving Average
TMA : Triangular Moving Average
VAR : Variable Index Dynamic Moving Average a.k.a. VIDYA
WWMA : Welles Wilder's Moving Average
ZLEMA : Zero Lag Exponential Moving Average
TSF : True Strength Force
HULL : Hull Moving Average
TILL : Tillson T3 Moving Average
Credits going to @CryptoErge for sharing his development to public.
Value-at-Risk Value-at-Risk is a risk measurement tool widely used by banks and institutions.
This script uses historical simulation method for the calculation of VaR. The default settings are 250-days period. 1 percentile (or 99 percentile confidence level.)
This means the daily loss for the past 250 days should not exceed the risk measure 99% of the time.
traders can calculate the desired level of risk by converting the timeframe OR by multiplying the square root (expected holding period) to find out the VaR value for 5 days, 25 days, 250 days etc.
Do take note that the default assumes a long position, if you are taking a short position, the percentile value has to be adjusted accordingly (to find the worst 1 percent loss for shorts will require changing the input to 99)

Dictionary/Object LibraryThis Library is aimed to mitigate the limitation of Pinescript having only one structured data type which is only arrays.
It lacks data types like Dictionaries(in Python) or Object (in JS) that are standard for other languages. Tuples do exist, but it hardly solves any problem.
Working only with Arrays could be overwhelming if your codebase is large. I looked for alternatives to arrays but couldn't find any library.
So I coded it myself and it's been working good for me. So I wanted to share it with you all.
What does it do:
==================
If you are familiar with Python or Javascript, this library tries to immimate Object/Dictonary like structure with Key Value Pairs.
For Example:
object= {name:"John Doe", age: 28 , org: "PineCoders"}
And then it also tries to immitate the Array of Objects (I call it Stack)
like this:
stack= Array({name:"John Doe", age: 28 , org: "PineCoders"},
{name:"Adam Smith", age: 32 , org: "PineCoders"},
{name:"Paragjyoti Deka", age: 25 , org: "PineCoders"})
So there are basically two ideas: Objects and Stacks.
But it looks whole different in Pinescript for obvious reasons.
Limitation:
The major limitation I couldn't overcome was that, for all of the values: both input and return values for properties will be of string type.
This is due to the limiation of Pinecsript that there is no way to return a value on a if-else statement dynamically with different data types.
And as the input data type must be explicitly defined when exporting the library functions, only string inputs are allowed.
Now that doesn't mean you won't be able to use integer, float or boolens, you just need to pass the string value for it using str.tostring() method.
And the output for the getter functions will be in strings as well. But I have added some type conversion methods that you could use from this library itself.
From String to Float, String To Integer and String to Boolean: these three methods are included in this library.
So basically the whole library is based on a manipulatiion of Array of strings under the hood.
///////////////
Usage
///////////////
Import the library using this statement:
import paragjyoti2012/STR_Dict_Lib/4 as DictLib
Objects
First define an object using this method:
for eample:
object1= DictLib.init("name=John,age=26,org=")
This is similar to
object1= {name:"John",age:"26", org:""} in JS or Python
Just like we did here in for "org", you can set initital value to "". But remember to pass string values, even for a numerical properties, like here in "age".
You can use "age="+str.tostring(age). If you find it tedious, you can always add properties later on using .set() method.
So it could also be initiated like this
object= DictLib.init("name=John")
and later on
DictLib.set(object1,"age", str.toString(age))
DictLib.set(object1,"org", "PineCoders")
The getter function looks like this
age= DictLib.get(object1,"age")
name=DictLib.get(object1,"name")
The first argument for all methods .get, .set, and .remove is the pointer (name of the object).
///////////////////////////
Array Of Objects (Stacks)
///////////////////////////
As I mentioned earlier, I call the array of objects as Stack.
Here's how to initialize a Stack.
stack= DictLib.initStack(object1)
The .initStack() method takes an object pointer as argument. It simply converts the array into a string and pushes it into the newly created stack.
Rest of all the methods for Stacks, takes the stack pointer as it's first arument.
For example:
DictLib.pushStack(stack,object2)
The second argument here is the object pointer. It adds the object to it's stack. Although it might feel like a two dimentional array, it's actually an one dimentional array with string values.
Under the hood, it looks like this
////////////////////
Methods
////////////////////
For Objects
-------------------
init() : Initializes the object.
params: (string) e.g
returns: The object ( )
example:
object1=DictLib.init("name=John,age=26,org=")
...................
get() : Returns the value for given property
params: (string object_pointer, string property)
returns: string
example:
age= DictLib.get(object1,"age")
.......................
set() : Adds a new property or updates an existing property
params: (string object_pointer, string property, string value)
returns: void
example:
DictLib.set(object1,"age", str.tostring(29))
........................
remove() : Removes a property from the object
params : (string object_pointer, string property)
returns: void
example:
DictLib.set(object1,"org")
........................
For Array Of Objects (Stacks)
-------------------------------
initStack() : Initializes the stack.
params: (string object_pointer) e.g
returns: The Stack
example:
stack= DictLib.initStack(object1)
...................
pushToStack() : Adds an object at at last index of the stack
params: (string stack_pointer, string object_pointer)
returns: void
example:
DictLib.pushToStack(stack,object2)
.......................
popFromStack() : Removes the last object from the stack
params: (string stack_pointer)
returns: void
example:
DictLib.popFromStack(stack)
.......................
insertToStack() : Adds an object at at the given index of the stack
params: (string stack_pointer, string object_pointer, int index)
returns: void
example:
DictLib.insertToStack(stack,object3,1)
.......................
removeFromStack() : Removes the object from the given index of the stack
params: (string stack_pointer, int index)
returns: void
example:
DictLib.removeFromStack(stack,2)
.......................
getElement () : Returns the value for given property from an object in the stack (index must be given)
params: (string stack_pointer, int index, string property)
returns: string
example:
ageFromObject1= DictLib.getElement(stack,0,"age")
.......................
setElement() : Updates an existing property of an object in the stack (index must be given)
params: (string stack_pointer, int index, string property, string value)
returns: void
example:
DictLib.setElement(stack,0,"age", str.tostring(32))
........................
includesElement() : Checks if any object exists in the stack with the given property-value pair
params : (string stack_pointer, string property, string value)
returns : Boolean
example:
doesExist= DictLib.includesElement(stack,"org","PineCoders")
........................
searchStack() : Search for a property-value pair in the stack and returns it's index
params: (stringp stack_pointer, string property, string value)
returns: int (-1 if doesn't exist)
example:
index= DictLib.searchElement(stack,"org","PineCoders")
///////////////////////
Type Conversion Methods
///////////////////////
strToFloat() : Converts String value to Float
params: (string value)
returns: float
example:
floatVal= DictLib.strToFloat("57.96")
.............................
strToInt() : Converts String value to Integer
params: (string value)
returns: int
example:
intVal= DictLib.strToFloat("45")
.............................
strToBool() : Converts String value to Boolean
params: (string value)
returns: boolean
example:
boolVal= DictLib.strToBool("true")
.............................
Points to remember
...............
1. Always pass string values as arguments.
2. The return values will be of type string, so convert them before to avoid typecasting conflict.
3. Horses can't vomit.
More Informations
====================
Yes, You can store this objects and stacks for persisting through the iterations of a script across successive bars.
You just need to set the variable using "var" keyword. Remember this objects and stacks are just arrays,
so any methods and properties an array have it pinescript, would be applicable for objects and stacks.
It can also be used in security functions without any issues for MTF Analysis.
If you have any suggestions or feedback, please comment on the thread, I would surely be happy to help.

TradingPortfolioLibrary "TradingPortfolio"
Simple functions for portfolio management. A portfolio is essentially
a float array with 3 positions that gets passed around
into these functions that ensure it gets properly updated as trading ensues.
An example usage:
import hugodanielcom/TradingPortfolio/XXXX as portfolio
var float my_portfolio = portfolio.init(0.0, strategy.initial_capital) // Initialize the portfolio with the strategy capital
if close < 10.0
portfolio.buy(my_portfolio, 10.0, close) // Buy when the close is below 10.0
plot(portfolio.total(my_portfolio), title = "Total portfolio value")
get_balance(portfolio) Gets the number of tokens and fiat available in the supplied portfolio.
Parameters:
portfolio : A portfolio float array as created by the `init()` function.
Returns: The tokens and fiat in a tuple
set_balance(portfolio, new_crypto, new_fiat) Sets the portfolio number of tokens and fiat amounts. This function overrides the current values in the portfolio and sets the provided ones as the new portfolio.
Parameters:
portfolio : A portfolio float array as created by the `init()` function.
new_crypto : The new amount of tokens in the portfolio.
new_fiat : The new amount of fiat in the portfolio
Returns: The tokens and fiat in a tuple
init(crypto, fiat) This function returns a clean portfolio. Start by calling this function and pass its return value as an argument to the other functions in this library.
Parameters:
crypto : The initial amount of tokens in the portfolio (defaults to 0.0).
fiat : The initial amount of fiat in the portfolio (defaults to 0.0).
Returns: The portfolio (a float )
crypto(portfolio) Gets the number of tokens in the portfolio
Parameters:
portfolio : A portfolio float array as created by the `init()` function.
Returns: The amount of tokens in the portfolio
fiat(portfolio) Gets the fiat in the portfolio
Parameters:
portfolio : A portfolio float array as created by the `init()` function.
Returns: The amount of fiat in the portfolio
retained(portfolio) Gets the amount of reatined fiat in the portfolio. Retained fiat is not considered as part of the balance when buying/selling, but it is considered as part of the total of the portfolio.
Parameters:
portfolio : A portfolio float array as created by the `init()` function.
Returns: The amount of retained fiat in the portfolio
retain(portfolio, fiat_to_retain) Sets the amount of fiat to retain. It removes the amount from the current fiat in the portfolio and marks it as retained.
Parameters:
portfolio : A portfolio float array as created by the `init()` function.
fiat_to_retain : The amount of fiat to remove and mark as retained.
Returns: void
total(portfolio, token_value) Calculates the total fiat value of the portfolio. It multiplies the amount of tokens by the supplied value and adds to the result the current fiat and retained amount.
Parameters:
portfolio : A portfolio float array as created by the `init()` function.
token_value : The fiat value of a unit (1) of token
Returns: A float that corresponds to the total fiat value of the portfolio (retained amount included)
ratio(portfolio, token_value) Calculates the ratio of tokens / fiat. The retained amount of fiat is not considered, only the active fiat being considered for trading.
Parameters:
portfolio : A portfolio float array as created by the `init()` function.
token_value : The fiat value of a unit (1) of token
Returns: A float between 1.0 and 0.0 that corresponds to the portfolio ratio of token / fiat (i.e. 0.6 corresponds to a portfolio whose value is made by 60% tokens and 40% fiat)
can_buy(portfolio, amount, token_value) Asserts that there is enough balance to buy the requested amount of tokens.
Parameters:
portfolio : A portfolio float array as created by the `init()` function.
amount : The amount of tokens to assert that can be bought
token_value : The fiat value of a unit (1) of token
Returns: A boolean value, true if there is capacity to buy the amount of tokens provided.
can_sell(portfolio, amount) Asserts that there is enough token balance to sell the requested amount of tokens.
Parameters:
portfolio : A portfolio float array as created by the `init()` function.
amount : The amount of tokens to assert that can be sold
Returns: A boolean value, true if there is capacity to sold the amount of tokens provided.
buy(portfolio, amount, token_value) Adjusts the portfolio state to perform the equivalent of a buy operation (as in, buy the requested amount of tokens at the provided value and set the portfolio accordingly).
Parameters:
portfolio : A portfolio float array as created by the `init()` function.
amount : The amount of tokens to buy
token_value : The fiat value of a unit (1) of token
Returns: A boolean value, true the requested amount of tokens was "bought" and the portfolio updated. False if nothing was changed.
sell(portfolio, amount, token_value) Adjusts the portfolio state to perform the equivalent of a sell operation (as in, sell the requested amount of tokens at the provided value and set the portfolio accordingly).
Parameters:
portfolio : A portfolio float array as created by the `init()` function.
amount : The amount of tokens to sell
token_value : The fiat value of a unit (1) of token
Returns: A boolean value, true the requested amount of tokens was "sold" and the portfolio updated. False if nothing was changed.
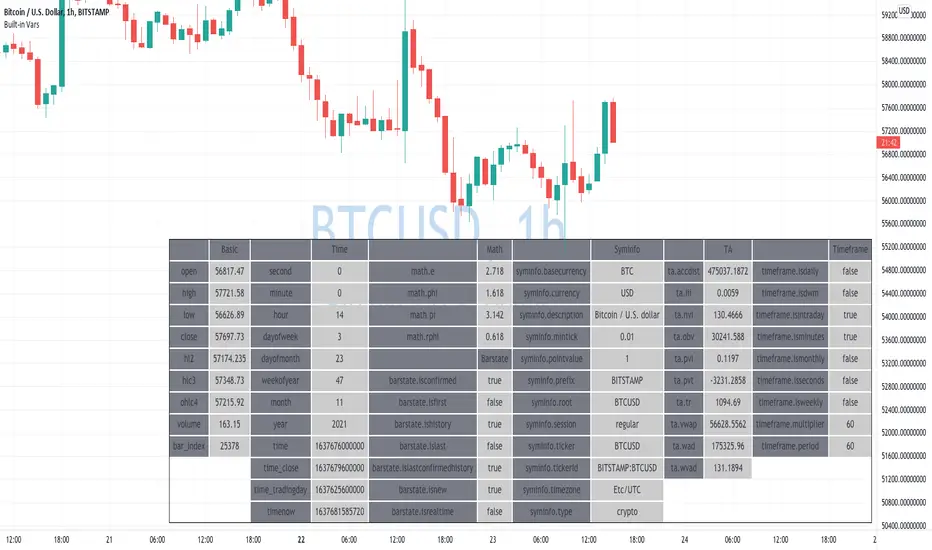
Learning Built-in VarsI'm currently working on v5 of my Pine Script Programming Course.
As a part of it, I'm building a few tools/widgets to help students get the content easier.
Here is one of the tools. It's quite basic with it you can select a bar and see all the build-in variables for this bar (Except strategy variables)
I hope it will help you in learning Pine Script!
Disclaimer
Please remember that past performance may not be indicative of future results.
Due to various factors, including changing market conditions, the strategy may no longer perform as well as in historical backtesting.
This post and the script don’t provide any financial advice.
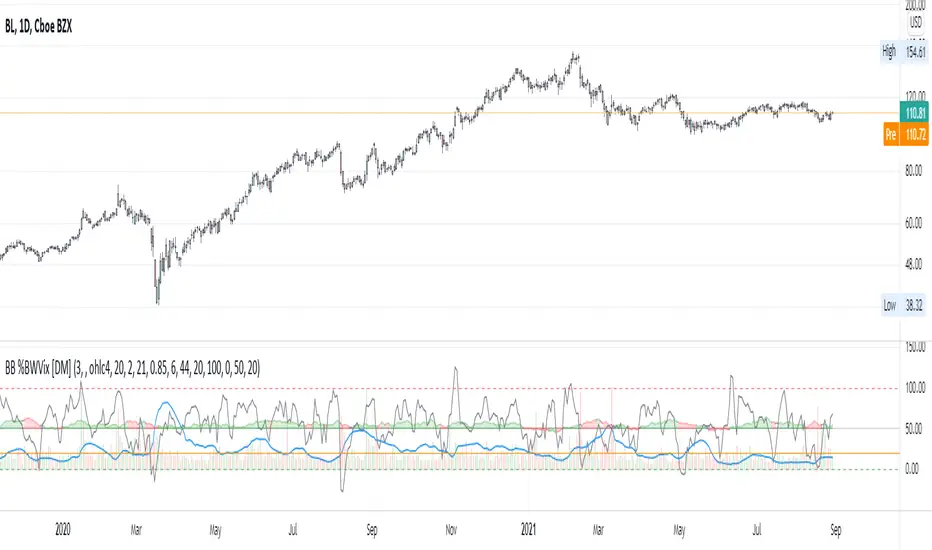
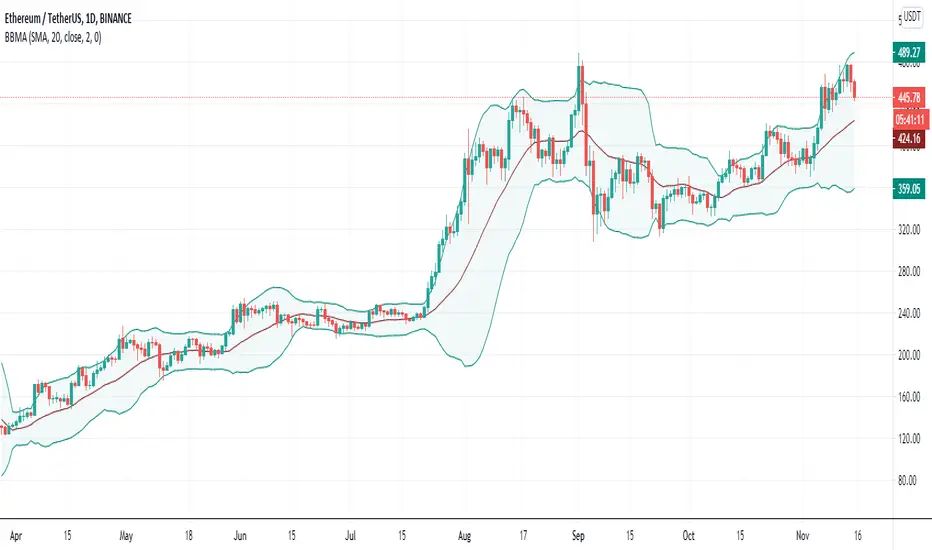
Bollinger Bands Width + %B + Vol. + Intraday Idx Alma var [DM]Greetings Colleagues here I published another script of the series "Alma Variant"
This script incorporates four different standard signals from Bollinger Band Book.
Signals:
Bollinger Band Width. Line blue
Bollinger Band %B. Line gray
Intraday intensity Index “normalized using log(volume)”. Oscillator line in the middle of the indicator with decision color green = buy, red=sell, purple=na
Bollinger Band Volume “normalized, decreased to 20% and limited to 100”
Alerts:
Bollinger Band (%B) Alert Level with your switch
Bollinger Band (Width) Alert Level with your switch
BB (Volume) Alert with your switch
Setting.
Individual ma settings
All alerts can be adjusted
The color of the Intraday intensity index background and lines help you decide on your volatility breakout direction
The background color has been conditioned to smoothed X periods for the accumulated volume above the alert level, Intraday Intensity Index direction and %B direction.
I recommend for the use of this indicator to first read John Bollinger's book to understand the usefulness of each of the signals and their configuration to execute the orders.
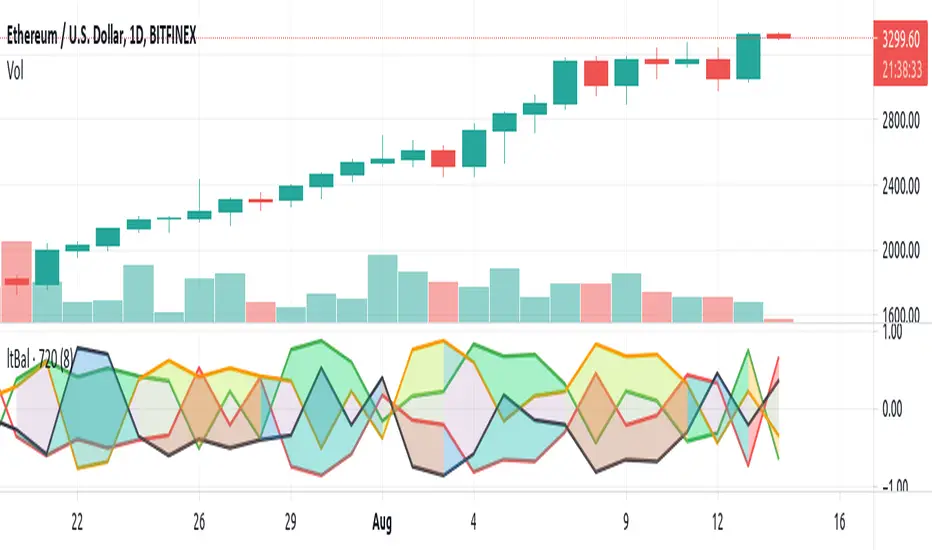
Light BalanceThe script is simple, going for a color scheme logic which tenderly avoids rigorous signals processing.
For the script to remain simple, logical derivatives are also out; as such, there are no secondary relations built off of primary ones. And it also ignores (unless you do this yourself) the logic in a varying order of lines.
Coloring has been done according to a limited set of relations between the four (4) plotted lines.
Quite a bit of information is capture, as you'll see when looking at line order, crossings, and transparency transitions and their patterns.
The approach makes the relations ones which can be learned over time; you become the algorithm to sort out signals. Ha ha. I know that sounds like a cop out doesn't it. Did I mention it's a simple script?
One thing you might want to play with right away are fills having red and green, and lime and fuchsia. It would be cool to reduce it all down to two (2) colors, but all the boolean relations might have to be listed, and it also may not be possible to cumulatively combine transparency overlays of the same value. Visually, that approach may not result to awaken a useful feature anyway. Also, fill() has its limitations in that it cannot be in a local scope; this includes function wrapped calls to fill(), or calls made using branching logic statements if/elseif, iff(), and var = (cond) ? t_val/exp : f_val/exp. So, to my knowledge, a fill() can not be made to be logically on/off.
Please, enjoy getting some use out of it.
HYE Trend Hunter [Strategy]*** Stratejinin Türkçe ve İngilizce açıklaması aşağıya eklenmiştir.
HYE Trend Hunter
In this strategy, two of the most basic data (price and volume) necessary for detecting trends as early as possible and entering the trade on time are used. In this context, the approaches of some classical and new generation indicators using price and volume have been taken into account.
The strategy is prepared to generate buy signals only. The following steps were followed to generate the buy and exit signals.
1-) First of all, the two most basic data of the strategy, “slow leading line” and “fast leading line” need to be calculated. For this, we use the formula of the “senkou span A” line of the indicator known as the Ichimoku Cloud. We also need to calculate lines known as tenkan sen and kijun sen in ichimoku because they are used in the calculation of this formula.
The high and low values of the candles are taken into account when calculating the Tenkansen, Kijunsen and Senkou Span A lines in the Ichimoku cloud. In this strategy, the highest and lowest values of the periodic VWAP are taken into account when calculating the "slow leading line" and "fast leading line". (The periodic vwap formula was coded and made available by @neolao on tradingviev). Also, in the ichimoku cloud, while the Senkou Span A line is plotted 26 periods into the future, we consider the values of the fast and slow leading lines in the last candle in this strategy.
ORIGINAL ICHIMOKU SPAN A FORMULA
Tenkansen = (Highest high of the last 9 candles + Lowest low of the last 9 candles) / 2
Kijunsen = (Highest high of the last 26 candles + Lowest low of the last 26 candles) / 2
Senkou Span A = Tenkansen + Kijunsen / 2
HYE TREND HUNTER SPAN A FORMULA*
Tenkansen = (Highest VWAP of the last 9 candles + Lowest VWAP of the last 9 candles) / 2
Kijunsen = (Highest VWAP of the last 26 candles + Lowest VWAP of the last 26 candles) / 2
Senkou Span A = Tenkansen + Kijunsen / 2
* We use the original ichimoku values 9 and 26 for the slow line, and 5 and 13 for the fast line. These settings can be changed from the strategy settings.
2-) At this stage, we have 2 lines that we obtained by using the formula of the ichimoku cloud, one of the most classical trend indicators, and by including the volume-weighted average price.
a-) Fast Leading Line (5-13)
b-) Slow Leading Line (9-26)
For the calculation we will do soon, we get a new value by taking the average of these two lines. Using this value, which is the average of the fast and slow leading lines, we plot the Bollinger Bands indicator, which is known as one of the most classic volatility indicators of technical analysis. Thus, we are trying to understand whether there is a volatility change in the market, which may mean the presence of a trend start. We will use this data in the calculation of buy-sell signals.
In the classical Bollinger Bands calculation, the standard deviation is calculated by applying a multiplier at the rate determined by the user (2 is used in the original settings) to the moving average calculated with the “closing price”, and this value is added or subtracted from the moving average and upper band and lower band lines are drawn.
In the HYE Trend Hunter Strategy, instead of the moving average calculated with the closing price in the Bollinger Band calculation, we consider the average of the fast and slow leading lines calculated in the 1st step and draw the Bollinger upper and lower bands accordingly. We use the values of 2 and 20 as the standard deviation and period, as in the original settings. These settings can also be changed from the strategy settings.
3-) At this stage, we have fast and slow leading lines trying to understand the trend direction using VWAP, and Bollinger lower and upper bands calculated by the average of these lines.
In this step, we will use another tool that will help us understand whether the invested market (forex, crypto, stocks) is gaining momentum in volume. The Time Segmented Volume indicator was created by the Worden Brothers Inc. and coded by @liw0 and @vitelot on tradingview. The TSV indicator segments the price and volume of an investment instrument according to certain time periods and makes calculations on comparing these price and volume data to reveal the buying and selling periods.
To trade in the buy direction on the HYE Trend Hunter Strategy, we look for the TSV indicator to be above 0 and above its exponential moving average value. TSV period and exponential moving average period settings (13 and 7) can also be changed in the strategy settings.
BUY SIGNAL
1-) Fast Leading Line value should be higher than the Fast Leading Line value in the previous candle.
2-) Slow Leading Line value should be higher than the Slow Leading Line value in the previous candle.
3-) Candle Closing value must be higher than the Upper Bollinger Band.
4-) TSV value must be greater than 0.
5-) TSV value must be greater than TSVEMA value.
EXIT SIGNAL
1-) Fast Leading Line value should be lower than the Fast Leading Line value in the previous candle.
2-) Slow Leading Line value should be lower than the Slow Leading Line value in the previous candle.
TIPS AND WARNINGS
1-) The standard settings of the strategy work better in higher timeframes (4-hour, daily, etc.). For lower timeframes, you should change the strategy settings and find the best value for yourself.
2-) All lines (fast and slow leading lines and Bollinger bands) except TSV are displayed on the strategy. For a simpler view, you can hide these lines in the strategy settings.
3-) You can see the color changes of the fast and slow leading lines as well as you can specify a single color for these lines in the strategy settings.
4-) It is an strategy for educational and experimental purposes. It cannot be considered as investment advice. You should be careful and make your own risk assessment when opening real market trades using this strategy.
_______________________________________________
HYE Trend Avcısı
Bu stratejide, trendlerin olabildiğince erken tespit edilebilmesi ve zamanında işleme girilebilmesi için gerekli olan en temel iki veriden (fiyat ve hacim) yararlanılmaktadır. Bu kapsamda, fiyat ve hacim kullanan bazı klasik ve yeni nesil indikatörlerin yaklaşımları dikkate alınmıştır.
Strateji yalnızca alış yönlü sinyaller üretecek şekilde hazırlanmıştır. Alış ve çıkış sinyallerinin üretilmesi için aşağıdaki adımlar izlenmiştir.
1-) Öncelikle, stratejinin en temel iki verisi olan “yavaş öncü çizgi” ve “hızlı öncü çizgi” hesaplamasının yapılması gerekiyor. Bunun için de Ichimoku Bulutu olarak bilinen indikatörün “senkou span A” çizgisinin formülünü kullanıyoruz. Bu formülün hesaplamasında kullanılmaları nedeniyle ichimoku’da tenkan sen ve kijun sen olarak bilinen çizgileri de hesaplamamız gerekiyor.
Ichimoku bulutunda Tenkansen, Kijunsen ve Senkou Span A çizgileri hesaplanırken mumların yüksek ve düşük değerleri dikkate alınıyor. Bu stratejide ise “yavaş öncü çizgi” ve “hızlı öncü çizgi” hesaplanırken periyodik VWAP’ın en yüksek ve en düşük değerleri dikkate alınıyor. (Periyodik vwap formülü, tradingviev’de @neolao tarafından kodlanmış ve kullanıma açılmış). Ayrıca, ichimoku bulutunda Senkou Span A çizgisi geleceğe yönelik çizilirken (26 mum ileriye dönük) biz bu stratejide öncü çizgilerin son mumdaki değerlerini dikkate alıyoruz.
ORJİNAL ICHIMOKU SPAN A FORMÜLÜ
Tenkansen = (Son 9 mumun en yüksek değeri + Son 9 mumun en düşük değeri) / 2
Kijunsen = (Son 26 mumun en yüksek değeri + Son 26 mumun en düşük değeri) / 2
Senkou Span A = Tenkansen + Kijunsen / 2
HYE TREND HUNTER SPAN A FORMÜLÜ*
Tenkansen = (Son 9 mumun en yüksek VWAP değeri + Son 9 mumun en düşük VWAP değeri) / 2
Kijunsen = (Son 26 mumun en yüksek VWAP değeri + Son 26 mumun en düşük VWAP değeri) / 2
Senkou Span A = Tenkansen + Kijunsen / 2
* Yavaş çizgi için orijinal ichimoku değerleri olan 9 ve 26’yı kullanırken, hızlı çizgi için 5 ve 13’ü kullanıyoruz. Bu ayarlar, strateji ayarlarından değiştirilebiliyor.
2-) Bu aşamada, elimizde en klasik trend indikatörlerinden birisi olan ichimoku bulutunun formülünden faydalanarak, işin içinde hacim ağırlıklı ortalama fiyatı da sokmak suretiyle elde ettiğimiz 2 çizgimiz var.
a-) Hızlı Öncü Çizgi (5-13)
b-) Yavaş Öncü Çizgi (9-26)
Birazdan yapacağımız hesaplama için bu iki çizginin de ortalamasını alarak yeni bir değer elde ediyoruz. Hızlı ve yavaş öncü çizgilerin ortalaması olan bu değeri kullanarak, teknik analizin en klasik volatilite indikatörlerinden birisi olarak bilinen Bollinger Bantları indikatörünü çizdiriyoruz. Böylelikle piyasada bir trend başlangıcının varlığı anlamına gelebilecek volatilite değişikliği var mı yok mu anlamaya çalışıyoruz. Bu veriyi al-sat sinyallerinin hesaplamasında kullanacağız.
Klasik Bollinger Bantları hesaplamasında, “kapanış fiyatıyla” hesaplanan hareketli ortalamaya, kullanıcı olarak belirlenen oranda (orijinal ayarlarında 2 kullanılır) bir çarpan uygulanarak standart sapma hesaplanıyor ve bu değer hareketli ortalamaya eklenip çıkartılarak üst bant ve alt bant çizgileri çiziliyor.
HYE Trend Avcısı stratejisinde, Bollinger Bandı hesaplamasında kapanış fiyatıyla hesaplanan hareketli ortalama yerine, 1. adımda hesapladığımız hızlı ve yavaş öncü çizgilerin ortalamasını dikkate alıyoruz ve buna göre bollinger üst ve alt bantlarını çizdiriyoruz. Standart sapma ve periyot olarak yine orijinal ayarlarında olduğu gibi 2 ve 20 değerlerini kullanıyoruz. Bu ayarlar da strateji ayarlarından değiştirilebiliyor.
3-) Bu aşamada, elimizde VWAP kullanarak trend yönünü anlamaya çalışan hızlı ve yavaş öncü çizgilerimiz ile bu çizgilerin ortalaması ile hesaplanan bollinger alt ve üst bantlarımız var.
Bu adımda, yatırım yapılan piyasanın (forex, kripto, hisse senedi) hacimsel olarak ivme kazanıp kazanmadığını anlamamıza yarayacak bir araç daha kullanacağız. Time Segmented Volume indikatörü, Worden Kardeşler şirketi tarafından oluşturulmuş ve tradingview’de @liw0 ve @vitelot tarafından kodlanarak kullanıma açılmış. TSV indikatörü, bir yatırım aracının fiyatını ve hacmini belirli zaman aralıklarına göre bölümlere ayırarak, bu fiyat ve hacim verilerini, alış ve satış dönemlerini ortaya çıkarmak için karşılaştırmak üzerine hesaplamalar yapar.
HYE Trend Avcısı stratejisinde alış yönünde işlem yapmak için, TSV indikatörünün 0’ın üzerinde olmasını ve kendi üstel hareketli ortalama değerinin üzerinde olmasını arıyoruz. TSV periyodu ve üstel hareketli ortalama periyodu ayarları da (13 ve 7) strateji ayarlarından değiştirilebiliyor.
ALIŞ SİNYALİ
1-) Hızlı Öncü Çizgi değeri bir önceki mumdaki Hızlı Öncü Çizgi değerinden yüksek olmalı.
2-) Yavaş Öncü Çizgi değeri bir önceki mumdaki Yavaş Öncü Çizgi değerinden yüksek olmalı.
3-) Kapanış Değeri, Üst Bollinger Bandı değerinden yüksek olmalı.
4-) TSV değeri 0’dan büyük olmalı.
5-) TSV değeri TSVEMA değerinden büyük olmalı.
ÇIKIŞ SİNYALİ
1-) Hızlı Öncü Çizgi değeri bir önceki mumdaki Hızlı Öncü Çizgi değerinden düşük olmalı.
2-) Yavaş Öncü Çizgi değeri bir önceki mumdaki Yavaş Öncü Çizgi değerinden düşük olmalı.
İPUÇLARI VE UYARILAR
1-) Stratejinin standart ayarları, yüksek zaman dilimlerinde (4 saatlik, günlük vs.) daha iyi çalışıyor. Düşük zaman dilimleri için strateji ayarlarını değiştirmeli ve kendiniz için en iyi değeri bulmalısınız.
2-) Stratejide tüm çizgiler (hızlı ve yavaş öncü çizgiler ile bollinger bantları) -TSV dışında- açık olarak gelmektedir. Daha sade bir görüntü için bu çizgilerin görünürlüğünü strateji ayarlarından gizleyebilirsiniz.
3-) Hızlı ve yavaş öncü çizgilerin renk değişimlerini görebileceğiniz gibi bu çizgiler için tek bir renk olarak da strateji ayarlarında belirleme yapabilirsiniz.
4-) Eğitim ve deneysel amaçlı bir stratejidir. Yatırım tavsiyesi olarak değerlendirilemez. Bu stratejiyi kullanarak gerçek piyasa işlem açarken dikkatli olmalı ve kendi risk değerlendirmenizi yapmalısınız.

HYE Trend Hunter [Indicator]*** İndikatörün Türkçe ve İngilizce açıklaması aşağıya eklenmiştir.
HYE Trend Hunter
In this indicator, two of the most basic data (price and volume) necessary for detecting trends as early as possible and entering the trade on time are used. In this context, the approaches of some classical and new generation indicators using price and volume have been taken into account.
The indicator is prepared to generate buy signals only. The following steps were followed to generate the buy and exit signals.
1-) First of all, the two most basic data of the indicator, “slow leading line” and “fast leading line” need to be calculated. For this, we use the formula of the “senkou span A” line of the indicator known as the Ichimoku Cloud. We also need to calculate lines known as tenkan sen and kijun sen in ichimoku because they are used in the calculation of this formula.
The high and low values of the candles are taken into account when calculating the Tenkansen, Kijunsen and Senkou Span A lines in the Ichimoku cloud. In this indicator, the highest and lowest values of the periodic VWAP are taken into account when calculating the "slow leading line" and "fast leading line". (The periodic vwap formula was coded and made available by @neolao on tradingviev). Also, in the ichimoku cloud, while the Senkou Span A line is plotted 26 periods into the future, we consider the values of the fast and slow leading lines in the last candle in this indicator.
ORIGINAL ICHIMOKU SPAN A FORMULA
Tenkansen = (Highest high of the last 9 candles + Lowest low of the last 9 candles) / 2
Kijunsen = (Highest high of the last 26 candles + Lowest low of the last 26 candles) / 2
Senkou Span A = Tenkansen + Kijunsen / 2
HYE TREND HUNTER SPAN A FORMULA*
Tenkansen = (Highest VWAP of the last 9 candles + Lowest VWAP of the last 9 candles) / 2
Kijunsen = (Highest VWAP of the last 26 candles + Lowest VWAP of the last 26 candles) / 2
Senkou Span A = Tenkansen + Kijunsen / 2
* We use the original ichimoku values 9 and 26 for the slow line, and 5 and 13 for the fast line. These settings can be changed from the indicator settings.
2-) At this stage, we have 2 lines that we obtained by using the formula of the ichimoku cloud, one of the most classical trend indicators, and by including the volume-weighted average price.
a-) Fast Leading Line (5-13)
b-) Slow Leading Line (9-26)
For the calculation we will do soon, we get a new value by taking the average of these two lines. Using this value, which is the average of the fast and slow leading lines, we plot the Bollinger Bands indicator, which is known as one of the most classic volatility indicators of technical analysis. Thus, we are trying to understand whether there is a volatility change in the market, which may mean the presence of a trend start. We will use this data in the calculation of buy-sell signals.
In the classical Bollinger Bands calculation, the standard deviation is calculated by applying a multiplier at the rate determined by the user (2 is used in the original settings) to the moving average calculated with the “closing price”, and this value is added or subtracted from the moving average and upper band and lower band lines are drawn.
In the HYE Trend Hunter indicator, instead of the moving average calculated with the closing price in the Bollinger Band calculation, we consider the average of the fast and slow leading lines calculated in the 1st step and draw the Bollinger upper and lower bands accordingly. We use the values of 2 and 20 as the standard deviation and period, as in the original settings. These settings can also be changed from the indicator settings.
3-) At this stage, we have fast and slow leading lines trying to understand the trend direction using VWAP, and Bollinger lower and upper bands calculated by the average of these lines.
In this step, we will use another tool that will help us understand whether the invested market (forex, crypto, stocks) is gaining momentum in volume. The Time Segmented Volume indicator was created by the Worden Brothers Inc. and coded by @liw0 and @vitelot on tradingview. The TSV indicator segments the price and volume of an investment instrument according to certain time periods and makes calculations on comparing these price and volume data to reveal the buying and selling periods.
To trade in the buy direction on the HYE Trend Hunter indicator, we look for the TSV indicator to be above 0 and above its exponential moving average value. TSV period and exponential moving average period settings (13 and 7) can also be changed in the indicator settings.
BUY SIGNAL
1-) Fast Leading Line value should be higher than the Fast Leading Line value in the previous candle.
2-) Slow Leading Line value should be higher than the Slow Leading Line value in the previous candle.
3-) Candle Closing value must be higher than the Upper Bollinger Band.
4-) TSV value must be greater than 0.
5-) TSV value must be greater than TSVEMA value.
EXIT SIGNAL
1-) Fast Leading Line value should be lower than the Fast Leading Line value in the previous candle.
2-) Slow Leading Line value should be lower than the Slow Leading Line value in the previous candle.
TIPS AND WARNINGS
1-) The standard settings of the indicator work better in higher timeframes (4-hour, daily, etc.). For lower timeframes, you should change the indicator settings and find the best value for yourself.
2-) All lines (fast and slow leading lines and Bollinger bands) except TSV are displayed on the indicator. For a simpler view, you can hide these lines in the indicator settings.
3-) You can see the color changes of the fast and slow leading lines as well as you can specify a single color for these lines in the Indicator settings.
4-) Alarms have been added for Buy and Exit. When setting up the alarm, you should set it to be triggered at "every bar close". Otherwise it may repaint. There is no repaint after the candle closes.
5-) It is an indicator for educational and experimental purposes. It cannot be considered as investment advice. You should be careful and make your own risk assessment when opening real market trades using this indicator.
_______________________________________________
HYE Trend Avcısı
Bu indikatörde, trendlerin olabildiğince erken tespit edilebilmesi ve zamanında işleme girilebilmesi için gerekli olan en temel iki veriden (fiyat ve hacim) yararlanılmaktadır. Bu kapsamda, fiyat ve hacim kullanan bazı klasik ve yeni nesil indikatörlerin yaklaşımları dikkate alınmıştır.
İndikatör yalnızca alış yönlü sinyaller üretecek şekilde hazırlanmıştır. Alış ve çıkış sinyallerinin üretilmesi için aşağıdaki adımlar izlenmiştir.
1-) Öncelikle, indikatörün en temel iki verisi olan “yavaş öncü çizgi” ve “hızlı öncü çizgi” hesaplamasının yapılması gerekiyor. Bunun için de Ichimoku Bulutu olarak bilinen indikatörün “senkou span A” çizgisinin formülünü kullanıyoruz. Bu formülün hesaplamasında kullanılmaları nedeniyle ichimoku’da tenkan sen ve kijun sen olarak bilinen çizgileri de hesaplamamız gerekiyor.
Ichimoku bulutunda Tenkansen, Kijunsen ve Senkou Span A çizgileri hesaplanırken mumların yüksek ve düşük değerleri dikkate alınıyor. Bu indikatörde ise “yavaş öncü çizgi” ve “hızlı öncü çizgi” hesaplanırken periyodik VWAP’ın en yüksek ve en düşük değerleri dikkate alınıyor. (Periyodik vwap formülü, tradingviev’de @neolao tarafından kodlanmış ve kullanıma açılmış). Ayrıca, ichimoku bulutunda Senkou Span A çizgisi geleceğe yönelik çizilirken (26 mum ileriye dönük) biz bu indikatörde öncü çizgilerin son mumdaki değerlerini dikkate alıyoruz.
ORJİNAL ICHIMOKU SPAN A FORMÜLÜ
Tenkansen = (Son 9 mumun en yüksek değeri + Son 9 mumun en düşük değeri) / 2
Kijunsen = (Son 26 mumun en yüksek değeri + Son 26 mumun en düşük değeri) / 2
Senkou Span A = Tenkansen + Kijunsen / 2
HYE TREND HUNTER SPAN A FORMÜLÜ*
Tenkansen = (Son 9 mumun en yüksek VWAP değeri + Son 9 mumun en düşük VWAP değeri) / 2
Kijunsen = (Son 26 mumun en yüksek VWAP değeri + Son 26 mumun en düşük VWAP değeri) / 2
Senkou Span A = Tenkansen + Kijunsen / 2
* Yavaş çizgi için orijinal ichimoku değerleri olan 9 ve 26’yı kullanırken, hızlı çizgi için 5 ve 13’ü kullanıyoruz. Bu ayarlar, indikatör ayarlarından değiştirilebiliyor.
2-) Bu aşamada, elimizde en klasik trend indikatörlerinden birisi olan ichimoku bulutunun formülünden faydalanarak, işin içinde hacim ağırlıklı ortalama fiyatı da sokmak suretiyle elde ettiğimiz 2 çizgimiz var.
a-) Hızlı Öncü Çizgi (5-13)
b-) Yavaş Öncü Çizgi (9-26)
Birazdan yapacağımız hesaplama için bu iki çizginin de ortalamasını alarak yeni bir değer elde ediyoruz. Hızlı ve yavaş öncü çizgilerin ortalaması olan bu değeri kullanarak, teknik analizin en klasik volatilite indikatörlerinden birisi olarak bilinen Bollinger Bantları indikatörünü çizdiriyoruz. Böylelikle piyasada bir trend başlangıcının varlığı anlamına gelebilecek volatilite değişikliği var mı yok mu anlamaya çalışıyoruz. Bu veriyi al-sat sinyallerinin hesaplamasında kullanacağız.
Klasik Bollinger Bantları hesaplamasında, “kapanış fiyatıyla” hesaplanan hareketli ortalamaya, kullanıcı olarak belirlenen oranda (orijinal ayarlarında 2 kullanılır) bir çarpan uygulanarak standart sapma hesaplanıyor ve bu değer hareketli ortalamaya eklenip çıkartılarak üst bant ve alt bant çizgileri çiziliyor.
HYE Trend Avcısı indikatöründe, Bollinger Bandı hesaplamasında kapanış fiyatıyla hesaplanan hareketli ortalama yerine, 1. adımda hesapladığımız hızlı ve yavaş öncü çizgilerin ortalamasını dikkate alıyoruz ve buna göre bollinger üst ve alt bantlarını çizdiriyoruz. Standart sapma ve periyot olarak yine orijinal ayarlarında olduğu gibi 2 ve 20 değerlerini kullanıyoruz. Bu ayarlar da indikatör ayarlarından değiştirilebiliyor.
3-) Bu aşamada, elimizde VWAP kullanarak trend yönünü anlamaya çalışan hızlı ve yavaş öncü çizgilerimiz ile bu çizgilerin ortalaması ile hesaplanan bollinger alt ve üst bantlarımız var.
Bu adımda, yatırım yapılan piyasanın (forex, kripto, hisse senedi) hacimsel olarak ivme kazanıp kazanmadığını anlamamıza yarayacak bir araç daha kullanacağız. Time Segmented Volume indikatörü, Worden Kardeşler şirketi tarafından oluşturulmuş ve tradingview’de @liw0 ve @vitelot tarafından kodlanarak kullanıma açılmış. TSV indikatörü, bir yatırım aracının fiyatını ve hacmini belirli zaman aralıklarına göre bölümlere ayırarak, bu fiyat ve hacim verilerini, alış ve satış dönemlerini ortaya çıkarmak için karşılaştırmak üzerine hesaplamalar yapar.
HYE Trend Avcısı indikatöründe alış yönünde işlem yapmak için, TSV indikatörünün 0’ın üzerinde olmasını ve kendi üstel hareketli ortalama değerinin üzerinde olmasını arıyoruz. TSV periyodu ve üstel hareketli ortalama periyodu ayarları da (13 ve 7) indikatör ayarlarından değiştirilebiliyor.
ALIŞ SİNYALİ
1-) Hızlı Öncü Çizgi değeri bir önceki mumdaki Hızlı Öncü Çizgi değerinden yüksek olmalı.
2-) Yavaş Öncü Çizgi değeri bir önceki mumdaki Yavaş Öncü Çizgi değerinden yüksek olmalı.
3-) Kapanış Değeri, Üst Bollinger Bandı değerinden yüksek olmalı.
4-) TSV değeri 0’dan büyük olmalı.
5-) TSV değeri TSVEMA değerinden büyük olmalı.
ÇIKIŞ SİNYALİ
1-) Hızlı Öncü Çizgi değeri bir önceki mumdaki Hızlı Öncü Çizgi değerinden düşük olmalı.
2-) Yavaş Öncü Çizgi değeri bir önceki mumdaki Yavaş Öncü Çizgi değerinden düşük olmalı.
İPUÇLARI VE UYARILAR
1-) İndikatörün standart ayarları, yüksek zaman dilimlerinde (4 saatlik, günlük vs.) daha iyi çalışıyor. Düşük zaman dilimleri için indikatör ayarlarını değiştirmeli ve kendiniz için en iyi değeri bulmalısınız.
2-) İndikatörde tüm çizgiler (hızlı ve yavaş öncü çizgiler ile bollinger bantları) -TSV dışında- açık olarak gelmektedir. Daha sade bir görüntü için bu çizgilerin görünürlüğünü indikatör ayarlarından gizleyebilirsiniz.
3-) Hızlı ve yavaş öncü çizgilerin renk değişimlerini görebileceğiniz gibi bu çizgiler için tek bir renk olarak da İndikatör ayarlarında belirleme yapabilirsiniz.
4-) Alış ve Çıkış için alarmlar eklenmiştir. Alarm kurulumu yaparken “Her çubuk kapanışında” tetiklenecek şekilde ayarlama yapmalısınız. Aksi takdirde repaint yapabilir. Mum kapanışından sonra repaint söz konusu değildir.
5-) Eğitim ve deneysel amaçlı bir indikatördür. Yatırım tavsiyesi olarak değerlendirilemez. Bu indikatörü kullanarak gerçek piyasa işlem açarken dikkatli olmalı ve kendi risk değerlendirmenizi yapmalısınız.

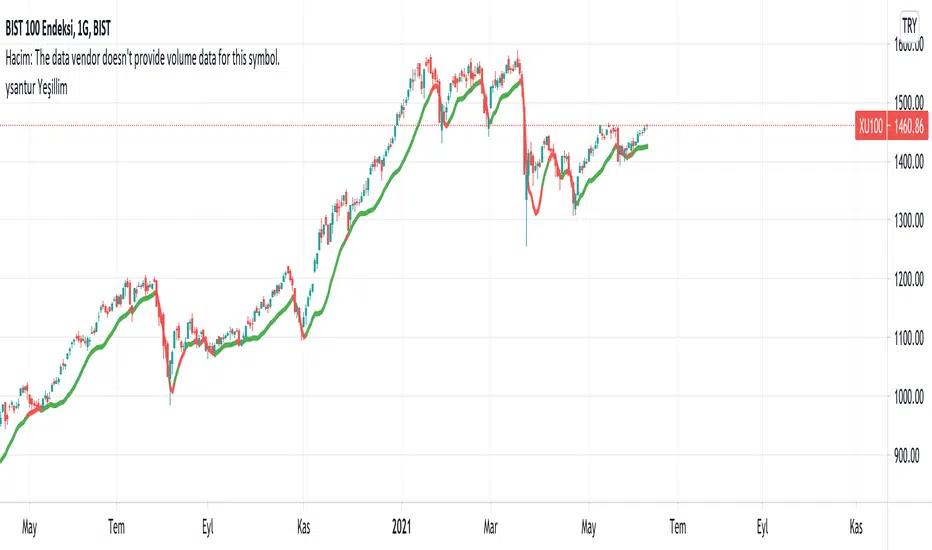
YesillimThe "Yesillim" indicator is a trend follower and trailing stop indicator that reacts quickly and aims to enter early in an uptrend and exit early from a downtrend. Since moving averages are used, it can be used in daytrade and scalping in daily or lower periods. The crossover and crossdown intersections of the price and the indicator line may be meaningful, but it is actually a color changing indicator and color changes should be interpreted. The bullish market gains strength when the color turns green, and the bearish market when it turns red. When prices get too far from the indicator, they are approaching again, in this case, it may be support will work like resistance according to the current trend. Like any indicator, it is possible to produce false signals in the horizontal market, so it should not be used alone, the oscillator and volume should support the current trend. In strong trend changes, angle changes in the indicator can also be interpreted manually. In this case, sharp angled turns indicate a sharp trend change. Technically customized weighted moving average weights are specially weighted with golden ratio coefficients, smoothed with a lower period for noise removal with the same principle and added bias. I wish it to be used in profitable transactions.
Turkish (Türkçe): Yeşillim indikatörü bir trend izleme ve hareketli iz süren indikatördür. Son barları agresif olarak ağırlıklandırdığı için var olan bir yükseliş trendine erken sokup, düşüş trendinden erken çıkarması olasıdır. İndikatör yorumlanırken fiyat ve indikatör kesişimleri anlamlı olsada (yükseliş düşüş trendlerinde destek-direnç görevi görebilecektir) ancak asıl amaç renk değişimi yorumlanmalıdır, yeşil yükseliş trendinin, kırmızı ise düşüş trendinin güç kazandığını göstermektedir. Her indikatör gibi yatay piyasada hatalı sonuçlar üretebilir, bu nedenle rsi, sokastik gibi bir osilatörle desteklenmesi hacimin mevcut trendi desteklemesi gerekmektedir. Kazançlı işlemlerde kullanılmasını temenni ederim.
String Manipulation Framework [PineCoders FAQ]█ OVERVIEW
This script provides string manipulation functions to help Pine coders.
█ FUNCTIONS PROVIDED
f_strLeft(_str, _n)
Function returning the leftmost `_n` characters in `_str`.
f_strRight(_str, _n)
Function returning the rightmost `_n` characters in `_str`.
f_strMid(_str, _from, _to)
Function returning the substring of `_str` from character position `_from` to `_to` inclusively.
f_strLeftOf(_str, _of)
Function returning the sub-string of `_str` to the left of the `_of` separating character.
f_strRightOf(_str, _of)
Function returning the sub-string of `_str` to the right of the `_of` separating character.
f_strCharPos(_str, _chr)
Function returning the position of the first occurrence of `_chr` in `_str`, where the first character position is 0. Returns -1 if the character is not found.
f_strReplace(_src, _pos, _str)
Function that replaces a character at position `_pos` in the `_src` string with the `_str` character or string.
f_tickFormat()
Function returning a format string usable with `tostring()` to round a value to the symbol's tick precision.
f_tostringPad(_val, _fmt)
Function returning a string representation of a numeric `_val` using a special `_fmt` string allowing all strings to be of the same width, to help align columns of values.
`f_tostringPad()`
Using the functions should be straightforward, but `f_tostringPad()` requires more explanations. Its purpose is to help coders produce columns of fixed-width string representations of numbers which can be used to produce columns of numbers that vertically align neatly in labels, something that comes in handy when, for example, you need to center columns, yet still produce numbers of various lengths that nonetheless align.
While the formatting string used with this function resembles the one used in tostring() , it has a few additional characteristics:
• The question mark (" ? ") is used to indicate that padding is needed.
• If negative numbers must be handled by the function, the first character of the formatting string must be a minus sign ("-"),
otherwise the unary minus sign of negative numbers will be stripped out.
• You will produce more predictable results by using "0" rather than "#" in the formatting string.
You can experiment with `f_tostringPad()` formatting strings by changing the one used in the script's inputs and see the results on the chart.
These are some valid examples of formatting strings that can be used with `f_tostringPad()`:
"???0": forces strings to be four units wide, in all-positive "int" format.
"-???0": forces strings to be four units wide, plus room for a unary minus sign in the first position, in "int" format.
"???0.0": forces strings to be four units wide to the left of the point, all-positive, with a decimal point and then a mantissa rounded to a single digit.
"-???0.0?": same as above, but adds a unary minus sign for negative values, and adds a space after the single-digit mantissa.
"?????????0.0": forces the left part of the float to occupy the space of 10 digits, with a decimal point and then a mantissa rounded to a single digit.
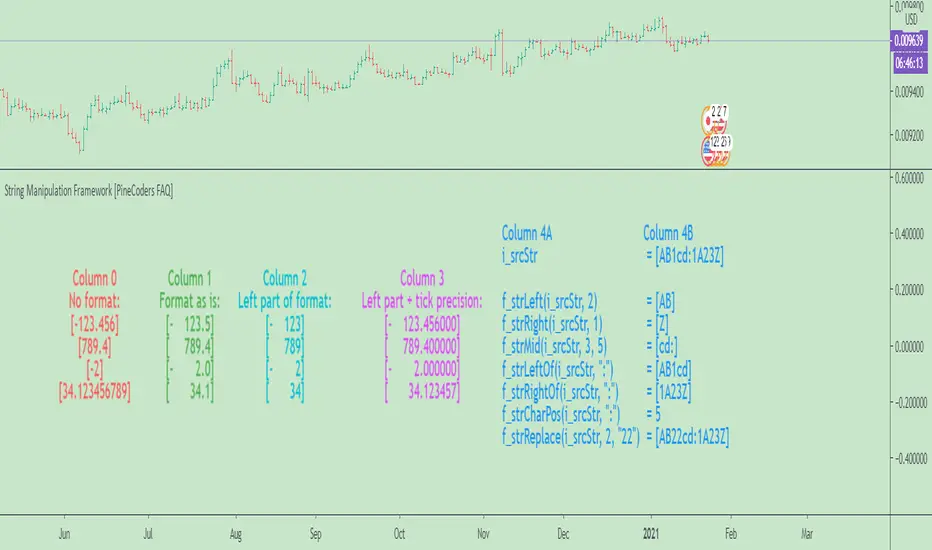
█ CHART
The information displayed by this indicator uses the values in the script's Inputs, so you can use them to play around.
The chart shows the following information:
• Column 0 : The numeric input values in a centered column, converted to strings using tostring() without a formatting argument.
• Column 1 : Shows the values formatted using `f_tostringPad()` with the formatting string from the inputs.
• Column 2 : Shows the values formatted using `f_tostringPad()` but with only the part of the formatting string left of the decimal point, if it contains one.
• Column 3 : Shows the values formatted using `f_tostringPad()` but with the part of the formatting string left of the decimal point,
to which is added the right part of the `f_tostringPad()` formatting string, to obtain the precision in ticks of the symbol the chart is on.
• Column 4 : Shows the result of using the other string manipulation functions in the script on the source string supplied in the inputs.
It also demonstrates how to split up a label in two distinct parts so that you can vertically align columns when the leftmost part contains strings with varying lengths.
You will see in our code how we construct this column in two steps.
█ LIMITATIONS
The Pine runtime is optimized for number crunching. Too many string manipulations will take a toll on the performance of your scripts, as can readily be seen with the running time of this script. To minimize the impact of using string manipulation functions in your scripts, consider limiting their calculation to the first or last bar of the dataset when possible. This can be achieved by using the var keyword when declaring variables containing the result of your string manipulations, or by enclosing blocks of code in if blocks using barstate.isfirst or barstate.islast .
█ NOTES
To understand the challenges we face when trying to align strings vertically, it is useful to know that:
• As is the case in many other places in the TadingView UI and other docs, the Pine runtime uses the MS Trebuchet font to display label text.
• Trebuchet uses proportionally-spaced letters (a "W" takes more horizontal space than an "I"), but fixed-space digits (a "1" takes the same horizontal space as a "3").
Digits all use a figure space width, and it is this property that allows us to align numbers vertically.
The fact that letters are proportionally spaced is the reason why we can't vertically align columns using a "legend" + ":" `+ value structure when the "legend" part varies in width.
• The unary minus sign is the width of a punctuation space . We use this property to pad the beginning of numbers
when you use a "-" as the first character of the `f_tostringPad()` formatting string.
Our script was written using the PineCoders Coding Conventions for Pine .
The description was formatted using the techniques explained in the How We Write and Format Script Descriptions PineCoders publication.
█ THANKS
Thanks to LonesomeTheBlue for the `f_strReplace()` function.
Look first. Then leap.
Weekly/Daily/Hourly/Minutes Colored Background IntervalsThis is my "Weekly/Daily/Hourly/Minutes Colored Background Intervals" assistant. I wouldn't describe it as an indicator, it just exhibits coloration of referenced periods of time with bgcolor() in Pine. With the arrival of 2021, I pondered the necessity of needing a visualization pre-2021 to visually recognize periodicity of market movements by the week, day, hour, or an adjustable period of minutes. While this script is simply generic, I hope you may find useful in your endeavors as a member on TradingView.
Explaining the script's usage, the "Minutes" input can be adjusted from anywhere between 5-55 minutes for only intraday. This can be modified to accommodate 90 minutes (1.5hrs) or any other minutes period desirable by tweaking certain numbers up to 1440. Minutes and Hourly backgrounds are disabled by default for most daily traders. Changing the input() code to `true` will provide them on by default when the script loads, if you choose that route. Each time periods background color is enable/disable capable. All of the colors are easily adjustable to any combination you can ponder for your visual acuity with the color swatch provided by input(type=input.color). The coloring can be "swapped" by input() depending on how you wish to start and end the day visually. I thought this would come in handy. The weekly background can have different starting points, whether it be Sunday, Monday, or any other day such as Friday for example.
The entire script's contents isn't intended for complete re-use as is for publicly published scripts. It's more along the lines of code that could be used to personally modify indicators you have, depending on the time frames you may actually be trading on. The code is basically modular, so you can use bits and pieces of it in your personally modified Pine Editor scripts that you wish to customize for yourself. I will say that the isXxx() functions are completely reusable in any script without any need for author permission inquiries from me, as easy as copy and paste. Those may come in handy for many folks. If you find them useful in certain circumstances, use isXxx() functions as you please. Day of the week detection by functions will have applications beyond my current intended use for them.
Of notable mention, this is a miniature lesson by example of how the new input(type=input.color) may be used. I'm also using `var` inside functions to aid in computational efficiency of the script runtime. The colors are permanently stored at the very beginning of the scripts operation inside the function and just reused from that point onward. Its a rare use case, but well suited for this scripts intention. Once again I have demonstrated the "Power of Pine" for developers of any experience level to learn from via code elegance.
When available time provides itself, I will consider your inquiries, thoughts, and concepts presented below in the comments section, should you have any questions or comments regarding this indicator. When my indicators achieve more prevalent use by TV members , I may implement more ideas when they present themselves as worthy additions. Have a profitable future everyone!

Bollinger Bands with Moving Averages and MTFBollinger Bands basically use SMA, here I revised it for use with many moving averages. Moving average types I have added: "EMA", "RMA", "SMA", "WMA", "VWMA", "WWMA", "TMA", "VAR", "ZLEMA", "TSF".
There is also an MTF option to view different time zones.
Cumulative Volume v3The script, for Pine Script version 3, shows how to accumulate volume values during a defined session/period.
The input is the period to use for accumulation. "D" is the default value, useful to view data for each session.
This is slower than version 4 because there is no "var" and you need to use a loop. Also, you can't use "sum( volume , cnt_new_day)" with a variable length argument instead of "for".

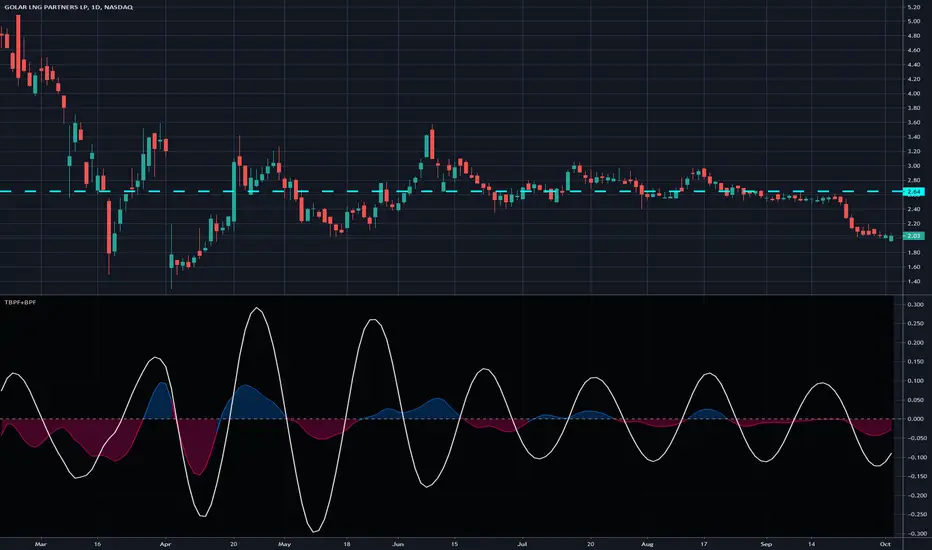
Truncated Bandpass Filter and Bandpass Filter - Dr. John EhlersWith the arrival of the blessed gifts of arrays from TV, I now present the REAL "Truncated Bandpass Filter" indicator employing PSv4.0 upon initial release, originally formulated by the magnificent mathemagician Dr. John Ehlers for TASC - July 2020 Traders Tips. Don't be bamboozled by the other incorrect truncated bandpass filters found on TV, those published with an erroneous haste that preceded Pine array availability. More information about these bandpass filters can be acquired with a simple search for this indicator's white paper, entitled "TRUNCATED INDICATORS by John F. Ehlers", on his site in the educational reference section.
This actually contains two indicators, one being the truncated bandpass, the other being a two pole bandpass which is also found in my Voss implementation. The two pole bandpass is primarily for comparison of both types, but as you can see, they share common code within both, one being truncated and the other not. I modified Ehlers' original truncation formulation by allowing the capability to alter the truncation period using two distinct methods. I will explain very briefly that the purpose of a truncated "infinite impulse response" filter is to dampen it's response. Truncation techniques aren't limited to only bandpass filters, "some" other IIR filters, but not all, may benefit from this as well.
Lastly this is a miniature starter lesson by example of how the new native Pine array functions may be used, along with other various methods such as `var` to improve computational efficiency on the cloud servers. Yep, native Pine arrays just doubled the "Power of Pine" by exponential magnitudes of power into the dimension of what I would now term as the "Immense Power of Pine" . The next generation capability of programming extremely advanced indicators has now successfully arrived on mothership Earth, right on TradingView's front lawn. Who would of known?? This is brought to you in part by the devoted voluntary efforts of the most skilled poetic programmers on TV, the likes of which most extraterrestrial alien programmers would fear. Ladies and Gents, YOU KNOW WHO YOU ARE. Wink, wink!
NOTICE: You have absolute freedom to use this source code any way you see fit within your new Pine projects. You don't have to ask for my permission to reuse these functions in your published scripts, simply because I have better things to do than answer requests for the reuse of the tbpf() and bpf() functions. Sufficient accreditation regarding this script and compliance with "TV's House Rules" regarding code reuse, is as easy as copying the functions in their entirety as is. Fair enough? Good!
Features List Includes:
Dark Background - Easily disabled in indicator Settings->Style for "Light" charts or with Pine commenting
AND a few more... Why list them, when you have the source code to explore!
When available time provides itself, I will consider your inquiries, thoughts, and concepts presented below in the comments section, should you have any questions or comments regarding this indicator. When my indicators achieve more prevalent use by TV members, I may implement more ideas when they present themselves as worthy additions. Have a profitable future everyone!
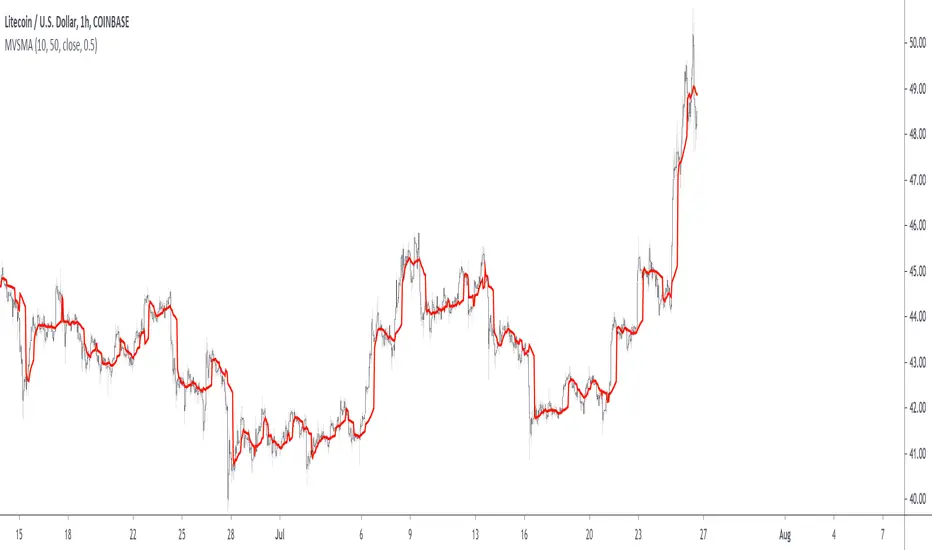
Minimum Variance SMAReturn the value of a simple moving average with a period within the range min to max such that the variance of the same period is the smallest available.
Since the smallest variance is often the one with the smallest period, a penalty setting is introduced, and allows the indicator to return moving averages values with higher periods more often, with higher penalty values returning moving averages values with higher periods.
Because variances with smaller periods are more reactive than ones with higher periods, it is common for the indicator to return the value of an SMA of a higher period during more volatile market, this can be seen on the image below:
here variances from period 10 to 15 are plotted, a blueish color represents a higher period, note how they are the smallest ones when fluctuations are more volatile.
Indicator with min = 50, max = 200 and penalty = 0.5
In blue the indicator with penalty = 0, in red with penalty = 1, with both min = 50 and max = 200.
On The Script
The script minimize Var(i)/p with i ∈ (min,max) and p = i^penalty , this is done by computing the variance for each period i and keeping the smallest one currently in the loop, if we get a variance value smaller than the previously one found we calculate the value of an SMA with period i , as such the script deal with brute force optimization.
For our use case it is not possible to use the built-in sma and variance functions within a loop, as such we use cumulative forms for both functions.
Moving Average profit targets with var sizeProfit target:
Profit targets are those scenarios where the system expects to be greater than the actual return at the end of the transaction: they may be short-term benefits, such as a favorable price shock model.
In short-term transactions, profit objectives are essential. Price fluctuations make any favorable event likely to turn around in an instant. Moreover, profit objectives are more difficult to integrate into the longer-term trading system, because they are afraid of losing larger profits at risk, so they will replace them with smaller but more frequent gains. As a follower of the trend, once you make a profit and stop earning, but the trend direction is still intact, you need to find a way to re-enter the transaction to avoid losing the rare but very large market situation.
Profit target is best calculated based on price volatility (V), and the most commonly used method:
For Long, the system buy point (E), needs to be multiplied by the average true volatility or annualized volatility :E+f×V.
The net value multiplier f used to calculate the profit level is usually obtained through data mining.

Quadratic Least Squares Moving Average - Smoothing + Forecast Introduction
Technical analysis make often uses of classical statistical procedures, one of them being regression analysis, and since fitting polynomial functions that minimize the sum of squares can be achieved with the use of the mean, variance, covariance...etc, technical analyst only needed to replace the mean in all those calculations with a moving average, we then end up with a low lag filter called least squares moving average (lsma) .
The least squares moving average could be classified as a rolling linear regression, altho this sound really bad it is useful to understand the relationship of both methods, both have the same form, that is ax + b , where a and b are coefficients of the model. However in a simple linear regression a and b are constant, while the lsma use variables instead.
In a simple lsma we model the relationship of the closing price (dependent variable) with a linear sequence (independent variable), therefore x = 1,2,3,4..etc. However we can use polynomial of higher degrees to model such relationship, this is required if we want more reactivity. Therefore we can use a quadratic form, that is ax^2 + bx + c , where a,b and c are variables.
This is the quadratic least squares moving average (qlsma), a not so official term, but we'll stick with it because it still represent the aim of the filter quite well. In this indicator i make the calculations of the qlsma less troublesome, therefore one might understand how it would work, note that in general the coefficients of a polynomial regression model are found using matrix calculus.
The Indicator
A qlsma, unlike the classic lsma, will fit better to the price and will be more reactive, this is the advantage of using an higher degrees for its calculation, we can model more complex relationship.
lsma in green, qlsma in red, with both length = 200
However the over/under shoots are greater, i'll explain why in the next sections, but this is one of the drawbacks of using higher degrees.
The indicator allow to forecast future values, the ahead period of the forecast is determined by the forecast setting. The value for this setting should be lower than length, else the forecasts can easily over/under shoot which heavily damage the forecast. In order to get a view on how well the forecast is performing you can check the option "Show past predicted values".
Of course understanding the logic behind the forecast is important, in short regressions models best fit a certain curve to the data, this curve can be a line (linear regression), a parabola (quadratic regression) and so on, the type of curve is determined by the degree of the polynomial used, here 2, which is a parabola. Lets use a linear regression model as example :
ax + b where x is a linear sequence 1,2,3...and a/b are constants. Our goal is to find the values for a and b that minimize the sum of squares of the line with the dependent variable y, here the closing price, so our hypothesis is that :
closing price = ax + b + ε
where ε is white noise, a component that the model couldn't forecast. The forecast of the closing price 14 step ahead would be equal to :
closing price 14 step aheads = a(x+14) + b
Since x is a linear sequence we only need to sum it with the forecasting horizon period, the same is done here with :
a*(n+forecast)^2 + b*(n + forecast) + c
Note that the forecast proposed in the indicator is more for teaching purpose that anything else, this indicator can't possibly forecast future values, even on a meh rate.
Low lag filters have been used to provide noise free crosses with slow moving average, a bad practice in my opinion due to the ability low lag filters have to overshoot/undershoot, more interesting use cases might be to use the qlsma as input for other indicators.
On The Code
Some of you might know that i posted a "quadratic regression" indicator long ago, the original calculations was coming from a forum, but because the calculation was ugly as hell as well as extra inefficient (dogfood level) i had to do something about it, the name was also terribly misleading.
We can see in the code that we make heavy use of the variance and covariance, both estimated with :
VAR(x) = SMA(x^2) - SMA(x)^2
COV(x,y) = SMA(xy) - SMA(x)SMA(y)
Those elements are then combined, we can easily recognize the intercept element c , who don't change much from the classical lsma.
As Digital Filter
The frequency response of the qlsma is similar to the one of the lsma, those filters amplify certain frequencies in the passband, and have ripples in the stop band. There is something interesting about those filters, first using higher degrees allow to greater boost of the frequencies in the passband, which result in greater over/under shoots. Another funny thing is that the peak/valley of the ripples is equal the peak or valley in the ripples of another lsma of different degree.
The transient response of those filters, that is impulse response, step response...etc is related to the degree of the polynomial used, therefore lets denote a lsma of degree p : lsma(p) , the impulse response of lsma(p) is a polynomial of degree p, and the step response is simple a polynomial of order p+1.
This is why it was more interesting to estimate the qlsma using convolution, however we can no longer forecast future values.
Conclusion
I proposed a more usable quadratic least squares moving average, with more options, as well as a cleaner and more efficient code. The process of shrinking the original code is made easier when you know about the estimations of both variance and covariance.
I hope the proposed indicator/calculation is useful.
Thx for reading !

Multi SMA EMA WMA HMA BB (4x3 MAs Bollinger Bands) Pro MTF - RRBMulti SMA EMA WMA HMA 4x3 Moving Averages with Bollinger Bands Pro MTF by RagingRocketBull 2018
Version 1.0
This indicator shows multiple MAs of any type SMA EMA WMA HMA etc with BB and MTF support, can show MAs as dynamically moving levels.
There are 4 MA groups + 1 BB group. You can assign any type/timeframe combo to a group, for example:
- EMAs 50,100,200 x H1, H4, D1, W1 (4 TFs x 3 MAs x 1 type)
- EMAs 8,13,21,55,100,200 x M15, H1 (2 TFs x 6 MAs x 1 type)
- D1 EMAs and SMAs 12,26,50,100,200,400 (1 TF x 6 MAs x 2 types)
- H1 WMAs 7,77,231; H4 HMAs 50,100,200; D1 EMAs 144,169,233; W1 SMAs 50,100,200 (4 TFs x 3 MAs x 4 types)
- +1 extra MA type/timeframe for BB
compile time: 25-30 sec
full redraw time after parameter change in UI: 3 sec
There are several versions: Simple, MTF, Pro MTF, Advanced MTF and Ultimate MTF. This is the Pro MTF version. The Differences are listed below. All versions have BB
- Simple: you have 2 groups of MAs that can be assigned any type (5+5)
- MTF: +2 custom Timeframes for each group (2x5 MTF)
- Pro MTF: +4 custom Timeframes for each group (4x3 MTF), MA levels and show max bars back options
- Advanced MTF: +2 extra MAs/group (4x5 MTF), custom Ticker/Symbol, backreferences for type, TF and MA lengths in UI
- Ultimate MTF: +individual settings for each MA, custom Ticker/Symbols
Features:
- 4x3 = 12 MAs of any type including Hull Moving Average (HMA)
- 4x MTF groups with step line smoothing
- BB +1 extra TF/type for BB MAs
- 12 MA levels with adjustable group offsets, indents and shift
- show max bars back
- you can show/hide both groups of MAs/levels and individual MAs
Notes:
1. based on 3EmaBB, uses plot*, barssince and security functions
2. you can't set certain constants from input due to Pinescript limitations - change the code as needed, recompile and use as a private version
3. Levels = trackprice implementation
4. Show Max Bars Back = show_last implementation
5. uses timeframe textbox instead of input resolution to allow for 120 240 and other custom TFs. Also supports TFs in hours: 2H or H2
6. swma has a fixed length = 4, alma and linreg have additional offset and smoothing params
7. Smoothing is applied by default for visual aesthetics on MTF. To use exact ma mtf values (lines with stair stepping) - disable it
MTF Notes:
- uses simple timeframe textbox instead of input resolution dropdown to allow for 120, 240 and other custom TFs, also supports timeframes in H: 2H, H2
- Groups that are not assigned a Custom TF will use Current Timeframe (0).
- MTF will work for any MA type assigned to the group
- MTF works both ways: you can display a higher TF MA/BB on a lower TF or a lower TF MA/BB on a higher TF.
- MTF MA values are normally aligned at the boundary of their native timeframe. This produces stair stepping when a higher TF MA is viewed on a lower TF.
Therefore X Y Point Density/Smoothing is applied by default on MA MTF for visual aesthetics. Set both to 0 to disable and see exact ma mtf values (lines with stair stepping and original mtf alignment).
- Smoothing is disabled for BB MTF bands because fill doesn't work with smoothed MAs after duplicate values are replaced with na.
- MTF MA Value fluctuation is possible on the current bar due to default security lookahead
Smoothing:
- X,Y == 0 - X,Y smoothing disabled (stair stepping on high TFs)
- X == 0, Y > 0 - X,Y smoothing applied to all TFs
- Y == 0, X > 0 - X smoothing applied to all TFs < deltaX_max_tf, Y smoothing disabled
- X > 0, Y > 0 - Y smoothing applied to all TFs, then X smoothing applied to all TFs < deltaX_max_tf
X Smoothing with Y == 0 - shows only every deltaX-th point starting from the first bar.
X Smoothing with Y > 0 - shows only every deltaX-th point starting from the last shown Y point, essentially filling huge gaps remaining after Y Smoothing with points and preserving the curve's general shape
X Smoothing on high TFs with already scarce points produces weird curve shapes, it works best only on high density lower TFs
Y Smoothing reduces points on all TFs, removes adjacent points with prices within deltaY, while preserving the smaller curve details.
A combination of X,Y produces the most accurate smoothing. Higher delta value - larger range, more points removed.
Show Max Bars Back:
- can't set plot show_last from input -> implemented using a timenow based range check
- you can't delete/modify history once plotted, so essentially it just sets a start point for plotting (from num_bars bars back) that works only in realtime mode (not in replay)
Levels:
You can plot current MA value using plot trackprice=true or by checking Show Price Line in Style. Problem is:
- you can only change color (not the dashed line style, width), have both ma + price line (not just the line), and it's full screen wide
- you can't set plot trackprice from input => implemented using plotshape/plotchar with fixed text labels serving as levels
- there's no other way of creating a dynamic level: hline, plot, offset - nothing else works.
- you can't plot a text var - all text strings must be constants, so you can't change the style, width and text labels without recompiling.
- from input you can only adjust offset, indent and shift for each level group, and change color
- the dot below each level line is the exact MA value. If you want just the line swap plotshape with plotchar, recompile and save as your private version, adjust Y shift.
To speed up redraw times: reduce last_bars to ~2000, recompile and use as your own private version
Pinescript is a rudimentary language (should be called Painscript instead) that can basically only plot data. You can't do much else. Please see the code for tips and hints.
Certain things just can't be done or require shady workarounds and weeks of testing trying to resolve weird node.js compiler errors.
Feel free to learn from/reuse/change the code as needed and use as your own private version. See comments in code. Good Luck!

Ehlers Forward Reverse EMAThis is Ehlers most recent indicator, today is 6/17/18 "Forward and Reverse EMA". I have done my best to translate the code form trade stations easy language.
If anyone knows easy language could they check my translation against the easy language code below.
{
Forward / Reverse EMA
(c) 2017 John F. Ehlers
}
Inputs:
AA(.1);
Vars:
CC(.9),
RE1(0),
RE2(0),
RE3(0),
RE4(0),
RE5(0),
RE6(0),
RE7(0),
RE8(0),
EMA(0),
Signal(0);
CC = 1 - AA;
EMA = AA*Close + CC*EMA ;
RE1 = CC*EMA + EMA ;
RE2 = Power(CC, 2)*RE1 + RE1 ;
RE3 = Power(CC, 4)*RE2 + RE2 ;
RE4 = Power(CC, 8)*RE3 + RE3 ;
RE5 = Power(CC, 16)*RE4 + RE4 ;
RE6 = Power(CC, 32)*RE5 + RE5 ;
RE7 = Power(CC, 64)*RE6 + RE6 ;
RE8 = Power(CC, 128)*RE7 + RE7 ;
Signal = EMA - AA*RE8;
Plot1(Signal);
Plot2(0);
Bollinger Bands NEW
var tradingview_embed_options = {};
tradingview_embed_options.width = 640;
tradingview_embed_options.height = 400;
tradingview_embed_options.chart = 's48QJlfi';
new TradingView.chart(tradingview_embed_options);
Vdub Binary Options SniperVX v1 by vdubus on TradingView.com