Поиск скриптов по запросу "VOLUME BAR"
FVE Volatility color-coded Volume bar The FVE is a pure volume indicator. Unlike most of the other indicators
(except OBV), price change doesn?t come into the equation for the FVE
(price is not multiplied by volume), but is only used to determine whether
money is flowing in or out of the stock. This is contrary to the current trend
in the design of modern money flow indicators. The author decided against a
price-volume indicator for the following reasons:
- A pure volume indicator has more power to contradict.
- The number of buyers or sellers (which is assessed by volume) will be the same,
regardless of the price fluctuation.
- Price-volume indicators tend to spike excessively at breakouts or breakdowns.
This study is an addition to FVE indicator. Indicator plots different-coloured volume
bars depending on volatility.

Equivolume Overlay - Volume BarsThis is an addon for displaying volume bars along with Equivolume bars which can be found here

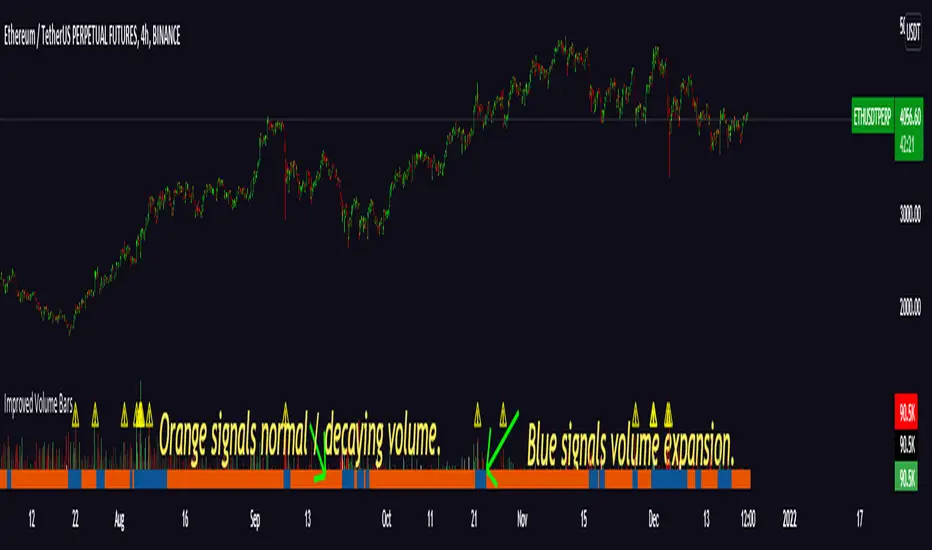
Improved Volume Bars IVB"IVB" is an attempt to improve volume analyze using classical volume bars , focusing on market cycle phase recognition and noticing cycle onset/peak points
V.01
Colored Volume Bars with Standard Deviation from the MeanI have updated the indicator to help visualize volume . The percentage scale is based on a 21 period look back average . The colored volume bars represent volumes that exceed specified standard deviation of this 21 period average as indicated in the figure. The deviation bands are based on a the 55sma of the 21 period average (brown line). A 8 period sma of the 21 moving average (red line) is also indicated.

Weis Wave Volume Bar Colours AdvancedIn this advanced version of the Weis Wave Volume Bar Colour indicator, you can change the trend length for the green & red bars individually. Alerts can also be triggered at the start of a new trend easily, by the green/red dots.

Colored Volume Bars [LazyBear] with overlayDivs and candle alignment a little easier to see - volume/2 to size correctly - could still use some refining
All credits to LazyBear for his color volume bar source code
ZenTrading Volume BarsThis is a script for beta testing only.
Tests volume bars for relevance, used to signal exhaustions/bottoms/tops

C Volume BarsOk do not take this one as serious as I made it as a joke .Its a volume bar that give you such great results and you can call it with fancy names and even hide the code . as there is no signals no one will pay attention that its repaint . And folks can even pay you money for it as its look so good. I even give you the script to show you how generous I am :)
its even better then the fancy name one as it actually give you time frames to choose from.
but on the other hand who said that repainting is bad?
mine look better:)))


Volume Color Bars with SMA MACD & Linear RegressionVolume Bars colored to make it easy to read with Volume Spread Analysis Indicator.
1. Red - Volume less than Simple Moving Average
2. Blue - Volume higher than Simple Moving Average
3. Black - Maximum volume of last Max_Count bar (default = 40 bars)
Additionally, you can plot Moving Average, Linear Regression and MACD of volume.

Volume BarsVolume Sato's Bar / Satos Bar / Raio X Preditivo
This is an experimental code based on Satos Bar by Raio X Preditivo
It's a way to check expressive volume in one bar, and it's can give you an idea of a important Zones to make decisions.
Example:

Volume Bars and Regions of InterestThe bars are colored according to the volume traded. The volume weights were distributed logically for a better analysis.
<0.666 low volume
0.666 to 1.333 median volume
1,333 to 2,666 high volume
> 2,666 'institutional' volume
The moving average bands are the average of the highs and lows. They show a region of interest and not just a 'line'.

Volume Bars - Shubhashish DixitThis helps you to identify volume based on your given period and it solves the issues which we are unable to see units in the main bar of Volume default chart

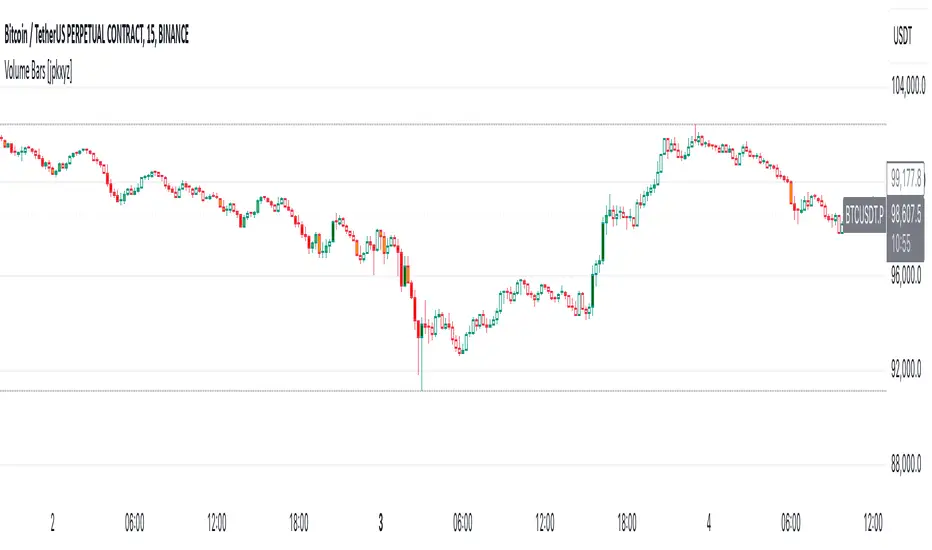
Volume Bars [jpkxyz]
Multi-Timeframe Volume indicator by @jpkxyz
This script is a Multi-Timeframe Volume Z-Score Indicator. It dynamically calculates /the Z-Score of volume over different timeframes to assess how significantly current
volume deviates from its historical average. The Z-Score is computed for each
timeframe independently and is based on a user-defined lookback period. The
script switches between timeframes automatically, adapting to the chart's current
timeframe using `timeframe.multiplier`.
The Z-Score formula used is: (current volume - mean) / standard deviation, where
mean and standard deviation are calculated over the lookback period.
The indicator highlights periods of "significant" and "massive" volume by comparing
the Z-Score to user-specified thresholds (`zScoreThreshold` for significant volume
and `massiveZScoreThreshold` for massive volume). The script flags buy or sell
conditions based on whether the current close is higher or lower than the open.
Visual cues:
- Dark Green for massive buy volume.
- Red for massive sell volume.
- Green for significant buy volume.
- Orange for significant sell volume.
- Gray for normal volume.
The script also provides customizable alert conditions for detecting significant or massive buy/sell volume events, allowing users to set real-time alerts.


Volume BarsShows Weakening in volume and price action. As always wait for the candle to close showing the signal


Sell-to-Buy Pressure RatioSell/Buy Pressure Ratio
What It Measures
The Sell/Buy Pressure Ratio quantifies the aggressiveness of sellers versus buyers by comparing conviction-weighted volume on down candles versus up candles. It answers a simple question: who is more committed right now—buyers or sellers?
How It Works
The indicator examines each candle and determines directional conviction based on where price closes within the bar's range. A candle that closes near its high shows strong buyer conviction. A candle that closes near its low shows strong seller conviction. This conviction percentage is then multiplied by volume to create a weighted measure of buying and selling pressure.
The ratio divides total selling pressure by total buying pressure over a lookback period. A ratio of 1.5 means sellers are 50% more aggressive than buyers. A ratio of 0.5 means buyers are twice as aggressive as sellers.
Key Features
Conviction weighting: Not all volume is equal. A strong close near the high counts more than a weak close mid-range.
Doji handling: Indecisive candles (where open and close are nearly equal) split volume 50/50 between buyers and sellers.
Volume filtering: Low-volume bars below 60% of average are excluded to focus on meaningful activity.
Normalized output: Optional -1 to +1 scale for cross-stock comparison.
Interpretation
RatioMeaning≤ 0.5Strong buyers — accumulation, continuation setups0.5 – 0.8Buyers favored — healthy environment for longs0.8 – 1.2Balanced — equilibrium, wait for direction1.2 – 1.5Sellers favored — caution warranted≥ 1.5Strong sellers — distribution, avoid new longs
Primary Use
Timing entries within confirmed trends. The ratio identifies when selling pressure has exhausted itself, signaling safer entry points. Rather than buying strength, traders wait for the ratio to transition from elevated levels back toward equilibrium—buying when selling stops being dangerous.
What It Does Not Do
This indicator does not predict direction. It measures current pressure dynamics. Pair it with trend analysis (moving averages, price structure) to determine direction, then use the pressure ratio to time entries and exits.

[blackcat] L4 Better Stephen Klinger KVOLevel: 4
Background
The Klinger Volume Oscillator (KVO) is a trading indicator that uses both price and volume to identify potential longer-term trend reversal points in the markets. Introduced to the trading community by Stephen Klinger, this indicator measures the trend of cash flow based on volume and price movements. In this version, I enhanced it with better volume indicator colorful bars and better trading strategy to have entries and exits, which can be called as Better Klinger Volume Oscillator (BKVO)
Function
Although it is designed to measure the longer-term cash flow trend, it can also exhibit short-term fluctuations. This may sound confusing, but a simple version of the Klinger calculation can be better explained as follows:
The volume moves through the market in each period
Price movements, no matter how small they are taken into account
The Klinger oscillator uses the lowest, highest, and closing prices
The calculation is based on price and volume and is called volume force (VF).
We then get an oscillator derived from the VF Slow 55 EMA and Fast 34 EMA (plus a 13 EMA signal line).
There are four main ways traders use the BKVO to trade in the markets:
Trend direction
Buy and sell trading signals
Bullish and bearish divergence
Colorful volume bars to indicate trend status
Trend direction
When using the Klinger oscillator for trend, there are two ways to do it. The first method is to wait for the KVO indicator line, not the signal line, to cross the zero line.
Traders can also use an intersection of the signal line with the KVO line as a directional sign. It's a little more aggressive.
Traders would only consider long or short trades depending on the KVO line relationship with the zero line. Aggressive traders can buy or sell when the trend changes, keeping their strategy objective.
Buy and sell trading signals
When we use the actual trading signal indicator we are using the signal line the same way we would trade the moving average convergence divergence (MACD) crosses. If you traded every crossover, you can see that you are in draw down and caught in whipsaw. This is not the way to use the original version of KVO as a strategy. Due to original version may produce too many fake crosses. I prefer to use volume bars to display the trends with proper entry and exit alerts. However, it could be better if you can use your own experience and skills to utilize this indicator subjectively besides inherent alerts provided.
Klinger Divergence Trading
Divergence is essentially technical indicators showing one direction and price doing another. If you see the price chart heading upwards while the Klinger indicator has crossed the signal line and heading towards zero. This would be bearish divergence. Bullish divergence is the opposite. I designed divergence indicator inside. However, they are turned off in default and you have to turn them on by yourself if you think they are helpful.
Colorful volume bars
Volume has to be the most underrated market variable used in technical analysis. But if you know how to analyze and interpret them, you can watch market turning points develop and anticipate setbacks and trend changes. You can find out if the pros are buying or selling by analyzing:
Transaction volume at the bid or ask price
High to lower area of the bar and
Average trade size.
The colorful volume bars improves your typical volume histogram by coloring the bars based on 5 criteria:
Volume Climax Up - high volume, high range, up bar (red)
Volume Climax Down - high volume, high range, down bar (white)
High Volume Churn - bars with high volume and low range (green)
Low Volume - bar for low volume (yellow)
Volume Climax plus High Volume Churn - both of the above conditions (fuchsia)
When there are no volume signals, the default color of the histogram bar is cyan/aqua.
Key Signal
KVO Volume Climax up/ Peak Up (Red Bar)
Volume Climax Up bars are identified by multiplying the buy volume (traded on ask) by the range and then looking for the highest value in the last 8 bars (default setting). Volume Climax Up bars indicate a large volume demand leading to rising prices. By default, the bars are colored red.
Volume climax up bars are typically displayed when:
The starting signal for upward trends
The end of the uptrends and Pullbacks during downtrends.
The beginning of an uptrend is almost always marked by a Volume Climax Up bar.
This shows that buyers like to get in and bring large quantities to market and raise prices quickly. A valid breakout should be followed by further buying, but occasionally it will test the low of the volume climax up bar.
Market highs are also indicated by Volume Climax Up bars, often with high volume and / or low volume test patterns. Trend changes usually take a while to develop, so don't get pulled into it too soon - wait for the market to run out. One useful signal to look out for is the low volume bar - this shows that there is finally no demand and the market is likely to stop moving.
During a downtrend, pullbacks are often indicated by Volume Climax Up bars. These show short covers or traders calling a bottom too quickly. As soon as this Climax volume decreases, the downward trend is likely to continue. The continuation of the downtrend is confirmed when the low of the Volume Climax Up bar is taken out.
KVO volume Climax Down/ Peak Down (White Bar)
Volume Climax Down bars are essentially the opposite of Volume Climax Up bars.
Volume Climax Down bars are identified by multiplying the sales volume (traded at bid) by the range and then finding the highest value in the last 8 bars (default). Volume Climax Down bars indicate a large supply that is pushing prices down. The default setting is the white color of the bars.
Volume climax down bars are usually displayed when:
The beginning of the down trends
The end of the down trends and Pullbacks on uptrends.
The beginning of a downtrend is almost always marked by a Volume Climax Down bar.
This shows that the sellers are happy to join in and that large quantities come onto the market and that prices are quickly depressed. A valid breakdown should be followed by more sales, but occasionally the high of the Volume Climax Down bar is tested.
Market lows are also indicated by Volume Climax Down bars, often with low volume churn and / or test patterns. Trend changes usually take a while to develop, so don't get pulled into it too soon - wait for the market to run out. One useful signal to look out for is the low volume bar - it shows that there is finally no supply and the market is likely to stop falling.
During an uptrend, pullbacks are often indicated by Volume Climax Down bars. These show profit taking or traders calling a top too quickly. As soon as this Climax volume drops, the uptrend will likely resume. The continuation of the uptrend will be confirmed when the high of the Volume Climax Down bar is removed.
KVO High volume churn (Green Bars)
High volume churn bars are identified by dividing the volume by the high to low range of the bar and then looking for the highest value in the last 8 bars (default). High volume churn bars indicate profit taking, new supply at the top, or new demand at the bottom of the market. The standard setting is that the bars of the volume histogram are colored green.
High volume churn bars are typically seen at:
The end of the uptrends
The end of the down trends and Mid-trend profit-taking.
When volume churn is high, it means that demand is being met by new supply on top or supply is being met by new demand on the bottom - the price cannot actually go up when new supply or demand comes into the market. Hence the bar is low from top to bottom.
Occasionally Volume Climax (up or down) and High Volume Churn bars coincide and these bars are magenta in color. Beware of intra-day charts. The high volume churn often occurs on the last bars of the trading day. This does not necessarily represent a possible turning point, but a high volume of day traders closing positions.
KVO Low Volume (Yellow Bar)
Low volume bars are identified by looking for the lowest volume in the last 8 bars (default). Low volume bars indicate a lack of demand at the highs or a lack of supply at the lows. The default setting is to color the bars yellow.
Low volume bars are usually displayed when:
The end of the uptrends
The end of the down trends and Pullbacks right in the middle of the trend.
Low volume bars are important volume indicator signal for trend reversal. They are very useful for confirming indicators of a change in trend direction when the market is testing a high or a low.
KVO High Volume Churn + Climax (Fuchsia Bar)
This is a mixture of KVO High volume churn (Green Bars) and KVO Volume Climax up/ Peak Up (Red Bar) or KVO volume Climax Down/ Peak Down (White Bar).
KVO No Volume Signal (Cyan/Aqua Bar)
There is no volume featured signal produced by the indicator.
Remarks
This is a Level 4 invite-only and closed source indicator.
Redeem rule: constant 350 tradingview coins per month and 350X10 tradingview coins per year.
