Multi Exchange Relative Volume IndicatorThe Multi Exchange Relative Volume indicator is a powerful tool designed to visualize the relative volume across different exchanges. This is particularly useful for decentralized securities like forex and crypto, where volume data is spread across multiple markets. By aggregating volume data from various exchanges, this indicator helps traders identify trends, spot unusual volume spikes, and make informed trading decisions.
Key Features:
Multi-Exchange Volume Aggregation: Collects and sums the volume data from up to five different exchanges, offering a holistic view of the market activity.
Customizable Inputs: Easily select and configure up to five different exchanges of your choice to monitor their volume activity.
Relative Volume Visualization: Compares the aggregated volume against historical averages to highlight periods of high or low volume.
Color-Coded Volume Bars: Volume bars are color-coded based on the relative volume percentage, providing quick visual cues:
- Red for volume 1.0-1.5 times the average
- Orange for volume 1.5-2.0 times the average
- Green for volume 2.0-3.0 times the average
- Yellow for volume greater than 3.0 times the average
- Grey for below average volume
Dynamic Lookback Period: Adjust the lookback period to suit your trading style and timeframe, allowing for flexible analysis.
Exponential Moving Average (EMA): Includes an EMA of volume to smooth out short-term fluctuations and highlight longer-term trends.
Scalable Layout: The scaling factor allows you to zoom in or out, adjusting the visual representation of volume data to better fit your chart.
Usage:
Configure Exchanges: Select up to five exchanges you want to monitor from the input settings.
Set Lookback Period and Bars: Customize the lookback period and the number of bars to consider for calculating average volume.
Adjust Scaling: Use the scaling factor to zoom in or out on the volume data for better visualization.
Interpret Volume Bars: Analyze the color-coded volume bars to identify significant changes in volume and potential trading opportunities.
Monitor EMA: Use the EMA line to understand the trend and smooth out noise from the volume data.
The Multi Exchange Relative Volume indicator is an essential tool for traders who want to gain deeper insights into market activity across multiple exchanges. By visualizing relative volume, it helps in identifying potential breakout or breakdown points, enhancing your trading strategy.
Поиск скриптов по запросу "VOLUME BAR"

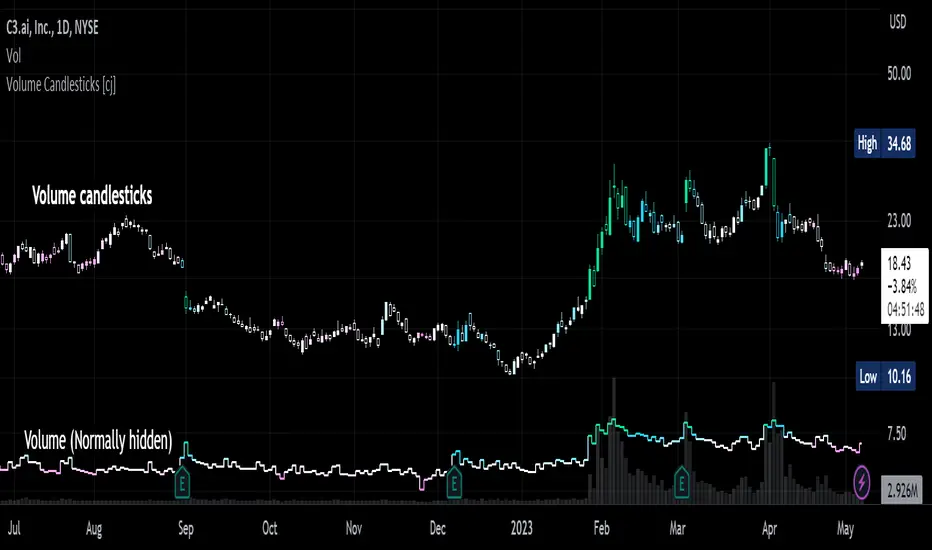
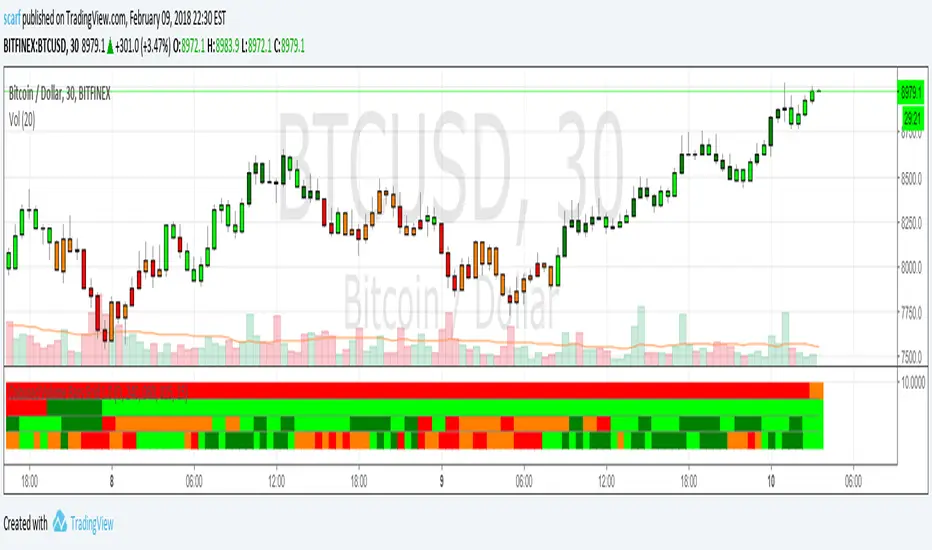
Volume Candlesticks [cajole]
This script lets you create the equivalent of "volume candlesticks" in TradingView.
"Volume candlesticks" normally vary their width according to the bar's volume. This script varies COLOUR instead of WIDTH.
Bar charts are also supported.
Candles/Bars are coloured by their distance from the average volume. You can also add a "huge volume" colour to further highlight the most extremely-high volume bars.
Note that volume is extrapolated for incomplete bars by default. So, if the average volume of the past 10 days is 5M shares, and 5M shares trade in the first 10% of today's session, that bar will be coloured as though 50M shares have traded. Set the "Extrapolate" option to 1.0 to disable this.
For this script to work properly, you should set TradingView's default candle/bar colours to be at least 20% transparent. By default, TradingView tends to overlay its own bars on top of indicators.
Nerdy details:
The script works best on a dark background, because it is easier to change the hue of white bars than of black bars. If you find a set of colours that work for white backgrounds, please comment with them!
The geometric mean is used instead of the arithmetic mean, to keep the 'average' from being strongly influenced by spikes. Bars are
then coloured by assuming a normal probability distribution and highlighting outliers. (This means that the first high-volume bars are coloured differently to later ones.)
TriexDev - SuperBuySellTrend (PLUS+)Minimal but powerful.
Have been using this for myself, so thought it would be nice to share publicly. Of course no script is correct 100% of the time, but this is one of if not the best in my basic tools. (This is the expanded/PLUS version)
Github Link for latest/most detailed + tidier documentation
Base Indicator - Script Link
TriexDev - SuperBuySellTrend (SBST+) TradingView Trend Indicator
---
SBST Plus+
Using the "plus" version is optional, if you only want the buy/sell signals - use the "base" version.
## What are vector candles?
Vector Candles (inspired to add from TradersReality/MT4) are candles that are colour coded to indicate higher volumes, and likely flip points / direction changes, or confirmations.
These are based off of PVSRA (Price, Volume, Support, Resistance Analysis).
You can also override the currency that this runs off of, including multiple ones - however adding more may slow things down.
PVSRA - From MT4 source:
Situation "Climax"
Bars with volume >= 200% of the average volume of the 10 previous chart TFs, and bars
where the product of candle spread x candle volume is >= the highest for the 10 previous
chart time TFs.
Default Colours: Bull bars are green and bear bars are red.
Situation "Volume Rising Above Average"
Bars with volume >= 150% of the average volume of the 10 previous chart TFs.
Default Colours: Bull bars are blue and bear are blue-violet.
A blue or purple bar can mean the chart has reached a top or bottom.
High volume bars during a movement can indicate a big movement is coming - or a top/bottom if bulls/bears are unable to break that point - or the volume direction has flipped.
This can also just be a healthy short term movement in the opposite direction - but at times sets obvious trend shifts.
## Volume Tracking
You can shift-click any candle to get the volume of that candle (in the pair token/stock), if you click and drag - you will see the volume for that range.
## Bollinger Bands
Bollinger Bands can be enabled in the settings via the toggle.
Bollinger Bands are designed to discover opportunities that give investors a higher probability of properly identifying when an asset is oversold (bottom lines) or overbought (top lines).
>There are three lines that compose Bollinger Bands: A simple moving average (middle band) and an upper and lower band.
>The upper and lower bands are typically 2 standard deviations +/- from a 20-day simple moving average, but they can be modified.
---
Base Indicator
## What is ATR?
The average true range (ATR) is a technical analysis indicator, which measures market volatility by decomposing the entire range of an asset price for that period.
The true range indicator is taken as the greatest of the following:
- current high - the current low;
- the absolute value of the current high - the previous close;
- and the absolute value of the current low - the previous close.
The ATR is then a moving average, generally using 10/14 days, of the true ranges.
## What does this indicator do?
Uses the ATR and multipliers to help you predict price volatility, ranges and trend direction.
> The buy and sell signals are generated when the indicator starts
plotting either on top of the closing price or below the closing price. A buy signal is generated when the ‘Supertrend’ closes above the price and a sell signal is generated when it closes below the closing price.
> It also suggests that the trend is shifting from descending mode to ascending mode. Contrary to this, when a ‘Supertrend’ closes above the price, it generates a sell signal as the colour of the indicator changes into red.
> A ‘Supertrend’ indicator can be used on equities, futures or forex, or even crypto markets and also on daily, weekly and hourly charts as well, but generally, it will be less effective in a sideways-moving market.
Thanks to KivancOzbilgic who made the original SuperTrend Indicator this was based off
---
## Usage Notes
Two indicators will appear, the default ATR multipliers are already set for what I believe to be perfect for this particular (double indicator) strategy.
If you want to break it yourself (I couldn't find anything that tested more accurately myself), you can do so in the settings once you have added the indicator.
Basic rundown:
- A single Buy/Sell indicator in the dim colour; may be setting a direction change, or just healthy movement.
- When the brighter Buy/Sell indicator appears; it often means that a change in direction (uptrend or downtrend) is confirmed.
---
You can see here, there was a (brighter) green indicator which flipped down then up into a (brighter) red sell indicator which set the downtrend. At the end it looks like it may be starting to break the downtrend - as the price is hitting the trend line. (Would watch for whether it holds above or drops below at that point)
Another example, showing how sometimes it can still be correct but take some time to play out - with some arrow indicators.
Typically I would also look at oscillators, RSI and other things to confirm - but here it held above the trend lines nicely, so it appeared to be rather obvious.
It's worth paying attention to the trend lines and where the candles are sitting.
Once you understand/get a feel for the basics of how it works - it can become a very useful tool in your trading arsenal.
Also works for traditional markets & commodities etc in the same way / using the same ATR multipliers, however of course crypto generally has bigger moves.
---
You can use this and other indicators to confirm likeliness of a direction change prior to the brighter/confirmation one appearing - but just going by the 2nd(brighter) indicators, I have found it to be surprisingly accurate.
Tends to work well on virtually all timeframes, but personally prefer to use it on 5min,15min,1hr, 4hr, daily, weekly. Will still work for shorter/other timeframes, but may be more accurate on mid ones.
---
This will likely be updated as I go / find useful additions that don't convolute things. The base indicator may be updated with some limited / toggle-able features in future also.

DeltaPulseDeltaPulse: Professional Cumulative Volume Delta Indicator
DeltaPulse is a free cumulative volume delta (CVD) indicator engineered for modern traders who demand precision, adaptability, and visual clarity. Unlike traditional CVD tools that often suffer from scaling issues, excessive noise, or poor responsiveness across timeframes, DeltaPulse delivers a streamlined, professional-grade solution that "just works" – providing actionable insights into buying and selling pressure with minimal setup.
This indicator accumulates the net difference between buying and selling volume (inferred from candle direction), normalizes it intelligently for consistent readability, and applies advanced smoothing to filter out market noise while preserving momentum signals. The result is a clean, momentum-colored line in a dedicated pane, enhanced by subtle visual cues that highlight key market dynamics.
Whether you're a day trader scalping intraday moves, a swing trader analyzing weekly trends, or an institutional analyst reviewing futures contracts, DeltaPulse adapts seamlessly to your workflow. It's designed to be your go-to tool for confirming trends, spotting divergences, and identifying order flow imbalances – all without the bloat of overcomplicated features.
Key Features
Intelligent Normalization for Universal Compatibility
Automatically adjusts scaling based on chart timeframe and symbol volume profile.
Intraday (1-5 min): Uses a 100-period volume average for responsive, lively signals.
Intraday (15+ min): 50-period average for balanced sensitivity.
Daily/Weekly+: 20-period average for clean, long-term perspective.
Ensures the indicator remains visually meaningful and non-flat on any asset – from low-volume penny stocks to high-liquidity indices like ES or NQ.
Advanced Smoothing Options
Six moving averages to match your trading style:
EMA - Quick reactions to recent delta shifts
SMA - Simple Moving Average - Stable, noise-resistant baseline
WMA - Weighted Moving Average - Emphasizes recent data with linear weighting
HMA - Hull Moving Average - Ultra-smooth yet lag-free – ideal for momentum trading
RMA - Running Moving Average (Wilder's) - Trend-following with minimal whipsaws
VWMA - Volume-Weighted Moving Average - Highlights high-volume delta moves
Lower values increase reactivity; higher values enhance smoothness.
Flexible Reset Mechanisms
Session Reset: Clears CVD at the first regular trading bar each day – perfect for intraday analysis.
Weekly Reset: Resets at the start of each new week – suited for swing and position trading.
No manual intervention required; the indicator handles resets reliably across all timeframes.
Background Shading:
Light green tint above zero; light red below.
Extreme highlights when smoothed CVD exceeds 90% of its 80-bar high/low – flags potential exhaustion or absorption zones.
How It Works
DeltaPulse calculates a simple yet effective volume delta on each bar:
Bullish Bar (close ≥ open): Adds full volume as positive delta.
Bearish Bar (close < open): Subtracts full volume as negative delta.
This raw delta accumulates into a running total (CVD), resetting based on your chosen mode. The total is then:
Normalized against a timeframe-adaptive volume average to ensure consistent scaling.
Smoothed using your selected MA type for noise reduction and trend clarity.
Plotted with momentum-based coloring and visual enhancements.
The output is a single, intuitive line that reveals the underlying battle between buyers and sellers – far more reliably than raw volume bars or basic oscillators.
Trading Applications
DeltaPulse shines in revealing order flow dynamics that price action alone often conceals. Here are proven ways to integrate it:
Trend Confirmation & Momentum Trading
Bullish Setup: Rising green line above zero confirms buyer control – enter longs on pullbacks to support.
Bearish Setup: Falling red line below zero signals seller dominance – short on rallies to resistance.
Zero Line Crosses as Reversal Signals
A crossover from negative to positive territory often marks a sentiment shift – use for entry triggers.
Combine with volume spikes or key levels for high-probability setups.
Enhancement: VWMA mode amplifies signals on high-volume breakouts.
Absorption & Exhaustion Zones
Watch for extreme background highlights: A spike to highs followed by reversal suggests large players absorbing supply.
Ideal for fade trades near overextended levels (e.g., after news events).
Avoid low-volume or illiquid symbols, as delta inference relies on reliable candle data.
Timeframe-Agnostic: Solves the common CVD pitfall of being "dead" on intraday charts or erratic on daily ones through smart, automatic normalization.
Lag-Free Responsiveness: The default HMA smoothing strikes a rare balance – smoother than EMA, faster than SMA – without the computational overhead of exotic filters.
Zero Clutter: No histograms, no extraneous plots, no overwhelming alerts. Just pure, distilled order flow intelligence.

BK AK-FVG/SR Institutional⚔️ BK AK-FVG/SR Institutional — Smart Money Gaps. True Support/Resistance. ⚔️
There are already some excellent FVG tools out there—built by traders who’ve put in real work studying imbalance, liquidity, and smart money behavior.
BK AK-FVG/SR Institutional is simply my version of that idea: my attempt to take what I learned from those great frameworks and push it further into volume, structure, lifecycle, and accountability—so every zone is treated as a living, graded object, not just a static box on a chart.
This is my 12th script release—and that number matters to me. Twelve is structure: twelve tribes, twelve months, twelve divisions of ordered space. It’s the number of complete arrangement. So for script twelve, I’m releasing what I consider my institutional map—a tool built specifically around boundaries, alignment, and where real money chooses to defend and attack.
This script is invite-only. Access is controlled. It’s built for traders who actually respect structure, not tourists looking for colors on a chart.
“AK” in the name is not branding—it’s honor. It belongs to my mentor A.K., whose standard of discipline and clarity sits behind every decision in this tool. Above that, all glory and gratitude to Gd—the real source of any wisdom, edge, or endurance we have in this game.
🧠 What BK AK-FVG/SR Institutional Actually Does
This is a full institutional FVG/SR system, not a paintbrush. It:
Detects and manages bullish & bearish FVG zones using ATR/percent filters and aging logic
Assigns a 0–100 institutional strength score and 1–5★ rating to every zone
Builds a per-zone lower-timeframe volume profile with POC, volume delta, and optional volume text
Tracks historical touches, breaks, role reversals, merging, clustering, and divergence at the zone
Runs per-zone backtest stats and feeds that into an adaptive/ML-style confidence weight
Compresses the whole environment into a real-time Info Table: bias, market position, nearest S/R, risk, session
Fires alerts only when something actually matters: strong FVGs, magnetic pull, divergence at a level
If price is the map, this is the layer that tells you which levels are real and which are noise.
🧱 Core Engine — Institutional Zone Logic
Smart FVG Detection
Clean 3-bar gap logic for bullish & bearish FVGs
ATR or % based minimum gap size + optional distance filter from price
Zone aging with max life in bars and optional “reset on touch”
Overlap & proximity control:
Prevent overlapping zones
Enforce minimum bar spacing
Or keep only the strongest zone in a cluster
Institutional Strength & Rating
Each zone gets a score (0–100) + star rating (1–5★) based on:
Volume vs average (with optional lower timeframe split)
Gap size vs ATR
Pivot confluence
Historical meaningful touches
Role reversal (support ↔ resistance)
MTF FVG alignment
Session weighting (Asian / London / NY / overlaps)
Order block overlap & imbalance behavior
VWAP proximity/extremes
Fib level alignment
Delta divergence
Zone clustering & consolidation
Adaptive “performance weight” from historical reactions
Bad zones don’t just look weaker—they literally get filtered out when you enable minimum star / institutional filters.
📊 In-Zone Volume & Profile Intelligence
Each zone can be backed by lower-timeframe volume:
Per-zone volume histogram inside the gap
POC line at the most traded price in that zone
Optional total volume label
POC line color shifts with volume delta (buy vs sell pressure)
Additional bull/bear volume bars alongside the zone and/or numeric volume text inside the box
You’re not just staring at a gap—you’re seeing the liquidity pocket inside the gap.
🎯 Structure, Confluence & Role Reversal
The engine includes deep structural context:
Pivots: stored swing highs/lows for S/R confluence
MTF FVG Confluence: two extra timeframes for higher-timeframe alignment
Fibonacci Levels: auto-mapped 0.236 / 0.382 / 0.5 / 0.618 / 0.786 with optional lines & labels
Order Blocks & Imbalance: engulfing OB detection + volume/imbalance filters
VWAP Intelligence: VWAP proximity/extreme bonuses, optional short-form plotting
Delta Divergence: volume-based confirmation flags for zones under real internal pressure
Smart S/R Positioning & Role Flip
Hide “wrong side” zones or auto-flip roles when broken & retested
Track broken zones for N bars, then retire them
Mark role reversals with badges and strength bonuses
Support/resistance is treated like behavior, not just lines.
🤖 Adaptive Learning & Backtesting
Each zone is monitored when price touches it:
Checks if price respects the zone and moves X points away (success)
Or violates beyond failure threshold (failure)
Tracks successes, failures, and win rate per zone
Feeds a confidence score into an adaptive weight so consistently performing zones matter more
Zones that meet the bar get ML/🤖 marking when enabled
The script doesn’t just say “this looks strong”—it tracks how it actually behaved.
📋 Info Table & Sessions — On-Chart War Room
On the latest bar, an Info Table summarizes:
Zone count (bull vs bear)
Market position (NEAR SUPPORT / NEAR RESISTANCE / ABOVE RESISTANCE / BELOW SUPPORT / NEUTRAL)
Nearest S/R levels
Trade bias (BULLISH / BEARISH / NEUTRAL)
Active session (ASIAN / LONDON / NY / OVERLAP / OFF)
Risk level (LOW / MED / HIGH)
Sessions are coded in EST with multipliers so you can weight London/NY more heavily than Asia if that matches your playbook.
Hover the table for a strategy tooltip: live market posture, suggested behavior near the zones, and context around the current environment.
⚠ Divergence & Alerts
Real-time RSI/OBV/ADX divergence detection at the zone
Flexible visual modes: border, icon, color change, or combinations
Alerts included:
Magnetic Zone Pull (price entering ATR-based “field” of a strong zone)
Strong Bullish FVG
Strong Bearish FVG
Divergence at Zone
Let the chart call you when a real decision point appears, instead of forcing you to stare all day.
🕹 How to Use BK AK-FVG/SR Institutional
1️⃣ Build Bias With Structure
Use the Info Table, star ratings, and where the 4–5★ zones cluster relative to price to decide which side of the tape you’re allowed to trade on.
2️⃣ Only Trade From Strong, Aligned Zones
Focus on 4–5★ zones with confluence (pivots, Fib, OB, VWAP, clustering).
Use the zone body/wick region as your execution area, not some random mid-air candle.
3️⃣ Treat Role Reversal & Clusters as Campaign Nodes
When a strong zone breaks, flips role, and collects touches, that’s campaign territory—not scalp noise.
4️⃣ Use Divergence/Delta as a Brake, Not a Toy
If divergence lights up at your level, respect it: size down, wait for confirmation, or stand down.
5️⃣ Let the Engine Filter Junk For You
Tune volMultiplier, star thresholds, session multipliers, distance filters, and min star rating to match your timeframe and instrument.
This script’s job is to remove your excuse for taking low-quality trades.
📜 Boundaries & Wisdom
King Solomon wrote:
“Do not remove the ancient boundary stone that your fathers have set.”
This tool is built around that idea. It maps where the real boundaries live—where smart money defends, attacks, traps, and reverses.
It will not give you discipline. It will simply remove the illusion that “you didn’t know the level was there.”
🔒 Access & Usage
This is an invite-only TradingView script.
Access is granted at my discretion to traders who take structure, risk, and discipline seriously.
⚔️ BK AK-FVG/SR Institutional — Map the Smart Money Gaps. Trade Only the Real Levels.
May Gd bless your vision, your patience, and every decision you make at the edge. 🙏

Volume SMA (StevenCharts)The Volume SMA (StevenCharts) is a streamlined volume analysis tool designed to help traders instantly identify significant market activity.
Standard volume bars can be noisy and difficult to interpret in isolation. This indicator normalizes volume relative to its recent average, highlighting only the bars that carry statistical significance. It separates "smart money" activity from retail noise by color-coding volume based on a user-defined threshold relative to the Moving Average.
How It Works
The indicator calculates a Simple Moving Average (SMA) of the volume (default 20 periods) and compares the current real-time volume against this baseline.
High Relative Volume: If the current volume exceeds the SMA by your set multiplier (e.g., 1.5x or 2.0x), the bar lights up in Green (for bullish closes) or Red (for bearish closes).
Low/Average Volume: If the volume is below the threshold, the bar remains Gray. This helps you ignore low-conviction price action.
Key Features
Threshold Filtering: Easily adjust the "Volume Multiplier" to define what you consider "high volume." Set it to 1.5 to spot bars with 150% of the average volume, or 2.0 for extreme outliers.
Visual Clarity: Automatically greys out insignificant volume, drawing your eye immediately to institutional activity.
Dual-Plot System: Displays standard volume bars alongside the SMA line for context.
Settings
Show Volume SMA: Toggles the blue SMA line on/off.
Volume SMA Length: The lookback period for the average (Default: 20).
Volume Multiplier Threshold: The factor required to trigger the colored highlight.
Example: Setting this to 1.0 means any volume above the average is colored. Setting it to 2.0 means only double-the-average volume is colored.

RT-Split VolumeSplit Volume is a volume analytics tool that separates estimated buy and sell volume for each bar, highlights abnormal activity, and makes it easier to see when larger participants may be stepping in or out of the market.
Split Volume Introduction
Traditional volume tools only show you the data for the candle that "won". This leaves traders in the dark about the balance between buying and selling behind each bar. Often a candle close is a photo finish between bulls and bears, and other times it is hardly a battle at all.
The Split Volume Indicator looks at both sides of the flow and identifies which volume candles have been flagged as anomalies compared with the surrounding volume bars. It is designed to provide additional context around where and how volume is flowing, rather than only showing total volume per candle.
Traditional Volume vs Split Volume
While volume is one of the most important signals a trader can watch, traditional volume indicators only show a single bar for each candle. Only looking at one side of the story puts the trader at a disadvantage. Sometimes the battle between the bears and the bulls is a photo finish, and sometimes it is hardly a battle at all.
In the comparison chart below, the middle pane shows TradingView's built in Volume indicator, while the lower pane shows Split Volume, so you can compare a single bar view with the split buy and sell view side by side.
Split Volume estimates buy and sell pressure separately and plots them on different halves of the panel. This gives a clearer picture of what is actually happening in the underlying order flow, not just which side closed the bar.
How Split Volume Works
The Split Volume Indicator uses an algorithm to estimate the buy and sell volume for each candle. All of the estimated buy volume is placed on the upper half of the indicator, while all of the estimated sell volume is placed on the lower half of the indicator.
As the bulls and bears trade back and forth on each candle, the algorithm also calculates a baseline average of the volume being traded over a rolling window. This dynamic baseline is shown by the gray Ghost Line.
When either the buy side or the sell side volume spikes well above that Ghost Line, the corresponding bars are flagged as abnormal. These abnormal spikes are color coded so they stand out against normal background activity.
Volume Candle Types
Green volume candles - Normal buying volume above the midline.
Blue volume candles - Abnormal buying volume above the Ghost Line.
Red volume candles - Normal selling volume below the midline.
Yellow volume candles - Abnormal selling volume below the Ghost Line.
Volume Impulses
One key pattern to watch with Split Volume is volume impulses: short bursts of concentrated activity that stand out from the Ghost Line baseline. These can be easy to miss with standard volume bars but become very obvious when normal and abnormal buy and sell flows are separated.
Settings
Volume in USD toggle On/Off - Switch between volume being displayed in USD or in the number of units (stocks or tokens) being traded. This change is reflected on the Y axis of the indicator.
Volume smoother - Changes the smoothness setting of the Ghost Line. Higher values make the baseline slower and smoother, and lower values make it more responsive to recent changes in activity.
Volume displacement shifter - Adjusts the vertical height of the Ghost Line. This lets traders control where they want abnormal blue and yellow volume candles to start triggering.
What Makes This Tool Different
Separates estimated buy and sell volume into their own zones instead of showing a single undifferentiated volume bar.
Uses a dynamic Ghost Line baseline so spikes are judged relative to recent activity, not a fixed threshold.
Highlights abnormal volume with clear color coding, making it easier to see when activity is concentrated on one side of the tape.
Emphasizes volume impulses and clusters that can precede or accompany larger moves, rather than only tracking total daily or session volume.
This indicator is intended to provide additional context around order flow and volume behavior. It is not a standalone signal generator and should always be used together with your own analysis, risk management and trading plan. Historical volume patterns do not guarantee future results.
🐋 Tight lines and happy trading!

SMC - Institutional Confidence Oscillator [PhenLabs]📊 Institutional Confidence Oscillator
Version: PineScript™v6
📌 Description
The Institutional Confidence Oscillator (ICO) revolutionizes market analysis by automatically detecting and evaluating institutional activity at key support and resistance levels using our own in-house detection system. This sophisticated indicator combines volume analysis, volatility measurements, and mathematical confidence algorithms to provide real-time readings of institutional sentiment and zone strength.
Using our advanced thin liquidity detection, the ICO identifies high-volume, narrow-range bars that signal institutional zone formation, then tracks how these zones perform under market pressure. The result is a dual-wave confidence oscillator that shows traders when institutions are actively defending price levels versus when they’re abandoning positions.
The indicator transforms complex institutional behavior patterns into clear, actionable confidence percentiles, helping traders align with smart money movements and avoid common retail trading pitfalls.
🚀 Points of Innovation
Automated thin liquidity zone detection using volume threshold multipliers and zone size filtering
Dual-sided confidence tracking for both support and resistance levels simultaneously
Sigmoid function processing for enhanced mathematical accuracy in confidence calculations
Real-time institutional defense pattern analysis through complete test cycles
Advanced visual smoothing options with multiple algorithmic methods (EMA, SMA, WMA, ALMA)
Integrated momentum indicators and gradient visualization for enhanced signal clarity
🔧 Core Components
Volume Threshold System: Analyzes volume ratios against baseline averages to identify institutional activity spikes
Zone Detection Algorithm: Automatically identifies thin liquidity zones based on customizable volume and size parameters
Confidence Lifecycle Engine: Tracks institutional defense patterns through complete observation windows
Mathematical Processing Core: Uses sigmoid functions to convert raw market data into normalized confidence percentiles
Visual Enhancement Suite: Provides multiple smoothing methods and customizable display options for optimal chart interpretation
🔥 Key Features
Auto-Detection Technology: Automatically scans for institutional zones without manual intervention, saving analysis time
Dual Confidence Tracking: Simultaneously monitors both support and resistance institutional activity for comprehensive market view
Smart Zone Validation: Evaluates zone strength through volume analysis, adverse excursion measurement, and defense success rates
Customizable Parameters: Extensive input options for volume thresholds, observation windows, and visual preferences
Real-Time Updates: Continuously processes market data to provide current institutional confidence readings
Enhanced Visualization: Features gradient fills, momentum indicators, and information panels for clear signal interpretation
🎨 Visualization
Dual Oscillator Lines: Support confidence (cyan) and resistance confidence (red) plotted as percentage values 0-100%
Gradient Fill Areas: Color-coded regions showing confidence dominance and strength levels
Reference Grid Lines: Horizontal markers at 25%, 50%, and 75% levels for easy interpretation
Information Panel: Real-time display of current confidence percentiles with color-coded dominance indicators
Momentum Indicators: Rate of change visualization for confidence trends
Background Highlights: Extreme confidence level alerts when readings exceed 80%
📖 Usage Guidelines
Auto-Detection Settings
Use Auto-Detection
Default: true
Description: Enables automatic thin liquidity zone identification based on volume and size criteria
Volume Threshold Multiplier
Default: 6.0, Range: 1.0+
Description: Controls sensitivity of volume spike detection for zone identification, higher values require more significant volume increases
Volume MA Length
Default: 15, Range: 1+
Description: Period for volume moving average baseline calculation, affects volume spike sensitivity
Max Zone Height %
Default: 0.5%, Range: 0.05%+
Description: Filters out wide price bars, keeping only thin liquidity zones as percentage of current price
Confidence Logic Settings
Test Observation Window
Default: 20 bars, Range: 2+
Description: Number of bars to monitor zone tests for confidence calculation, longer windows provide more stable readings
Clean Break Threshold
Default: 1.5 ATR, Range: 0.1+
Description: ATR multiple required for zone invalidation, higher values make zones more persistent
Visual Settings
Smoothing Method
Default: EMA, Options: SMA/EMA/WMA/ALMA
Description: Algorithm for signal smoothing, EMA responds faster while SMA provides more stability
Smoothing Length
Default: 5, Range: 1-50
Description: Period for smoothing calculation, higher values create smoother lines with more lag
✅ Best Use Cases
Trending market analysis where institutional zones provide reliable support/resistance levels
Breakout confirmation by validating zone strength before position entry
Divergence analysis when confidence shifts between support and resistance levels
Risk management through identification of high-confidence institutional backing
Market structure analysis for understanding institutional sentiment changes
⚠️ Limitations
Performs best in liquid markets with clear institutional participation
May produce false signals during low-volume or holiday trading periods
Requires sufficient price history for accurate confidence calculations
Confidence readings can fluctuate rapidly during high-impact news events
Manual fallback zones may not reflect actual institutional activity
💡 What Makes This Unique
Automated Detection: First Pine Script indicator to automatically identify thin liquidity zones using sophisticated volume analysis
Dual-Sided Analysis: Simultaneously tracks institutional confidence for both support and resistance levels
Mathematical Precision: Uses sigmoid functions for enhanced accuracy in confidence percentage calculations
Real-Time Processing: Continuously evaluates institutional defense patterns as market conditions change
Visual Innovation: Advanced smoothing options and gradient visualization for superior chart clarity
🔬 How It Works
1. Zone Identification Process:
Scans for high-volume bars that exceed the volume threshold multiplier
Filters bars by maximum zone height percentage to identify thin liquidity conditions
Stores qualified zones with proximity threshold filtering for relevance
2. Confidence Calculation Process:
Monitors price interaction with identified zones during observation windows
Measures volume ratios and adverse excursions during zone tests
Applies sigmoid function processing to normalize raw data into confidence percentiles
3. Real-Time Analysis Process:
Continuously updates confidence readings as new market data becomes available
Tracks institutional defense success rates and zone validation patterns
Provides visual and numerical feedback through the oscillator display
💡 Note:
The ICO works best when combined with traditional technical analysis and proper risk management. Higher confidence readings indicate stronger institutional backing but should be confirmed with price action and volume analysis. Consider using multiple timeframes for comprehensive market structure understanding.

Volume Overbought/Oversold Zones📊 What You’ll See on the Chart
Red Background or Red Triangle ABOVE a Candle
🔺 Means: Overbought Volume
→ Volume on that bar is much higher than average (as defined by your settings).
→ Suggests strong activity, possible exhaustion in the trend or an emotional spike.
→ It’s a warning: consider watching for signs of reversal, especially if price is already stretched.
Green Background or Green Triangle BELOW a Candle
🔻 Means: Oversold Volume
→ Volume on that bar is much lower than normal.
→ Suggests the market may be losing momentum, or few sellers are left.
→ Could signal an upcoming reversal or recovery if confirmed by price action.
Orange Line Below the Candles (Volume Moving Average)
📈 Shows the "normal" average volume over the last X candles (default is 20).
→ Helps you visually compare each bar’s volume to the average.
Gray Columns (Actual Volume Bars)
📊 These are your regular volume bars — they rise and fall based on how active each candle is.
🔍 What This Indicator Does (In Simple Words)
This indicator looks at trading volume—which is how many shares/contracts were traded in a given period—and compares it to what's considered "normal" for recent history. When volume is unusually high or low, it highlights those moments on the chart.
It tells you:
• When volume is much higher than normal → market might be overheated or experiencing a buying/selling frenzy.
• When volume is much lower than normal → market might be quiet, potentially indicating lack of interest or indecision.
These conditions are marked visually, so you can instantly spot them.
💡 How It Helps You As a Trader
1. Spotting Exhaustion in Trends (Overbought Signals)
If a market is going up and suddenly volume spikes way above normal, it may mean:
• The move is getting crowded (lots of buyers are already in).
• A reversal or pullback could be near because smart money may be taking profits.
Trading idea: Wait for high-volume up bars, then look for price weakness to consider a short or exit.
2. Identifying Hidden Opportunities (Oversold Signals)
If price is falling but volume drops unusually low, it might mean:
• Panic is fading.
• Sellers are losing energy.
• A bounce or trend reversal could happen soon.
Trading idea: After a volume drop in a downtrend, watch for bullish price patterns or momentum shifts to consider a buy.
3. Confirming or Doubting Breakouts
Volume is critical for confirming breakouts:
• If price breaks a key level with strong volume, it's more likely to continue.
• A breakout without volume could be a fake-out.
This indicator highlights volume surges that can help you confirm such moves.
📈 How to Use It in Practice
• Combine it with candlestick patterns, support/resistance, or momentum indicators.
• Use the background colors or shapes as a visual cue to pause and analyze.
• Adjust the sensitivity to suit fast-moving markets (like crypto) or slow ones (like large-cap stocks).

Capital Flow StrengthCapital Flow Strength Indicator Guide
This is a comprehensive technical indicator that measures capital flow into or out of an asset, combined with volume analysis. Here's how to use it effectively:
Basic Understanding
The indicator shows capital flow strength on a scale from -100 to +100
Positive values (green) indicate money flowing into the asset
Negative values (red) indicate money flowing out
The blue/gray volume bars show relative volume compared to recent average
Key Components
Capital Flow Line
Green line above zero: Buying pressure dominates
Red line below zero: Selling pressure dominates
Crossing zero: Potential shift in market sentiment
Reference Lines
0 line: Neutral balance between buyers and sellers
+50 line: Strong buying pressure
-50 line: Strong selling pressure
Volume Strength Bars
Blue bars: Volume exceeding threshold (currently 1.5x average)
Gray bars: Normal volume levels
Taller bars: Higher relative volume
Trading Applications
Entry Signals
Strong buying setup: Capital flow above +50 with blue volume bars
Strong selling setup: Capital flow below -50 with blue volume bars
Confirmation Tool
Use with price action and other indicators for confirmation
Strong readings are more reliable when volume is higher than average
Divergence Analysis
Bullish divergence: Price making lower lows but capital flow making higher lows
Bearish divergence: Price making higher highs but capital flow making lower highs
Customization Options
Length (14): Adjust the calculation period
Volume Threshold (1.5): Modify sensitivity to volume spikes
Alert Conditions
The indicator has two built-in alerts:
"Strong Capital Inflow" - triggers when flow > 50 with high volume
"Strong Capital Outflow" - triggers when flow < -50 with high volume
These alerts can help you identify significant buying or selling pressure as it emerges.

Relative Volume at TimeThe Relative Volume at Time indicator (RVOL) is a simple modification of the original Relative Volume at Time script available in TradingView’s public library. It doesn’t change how the indicator works but includes two small adjustments:
Added Color Options – The ability to customize the colors of the volume bars, which was important to me as I use this indicator all the time and wanted more visually suitable colors.
Renamed Short Title – The abbreviation "RVOL" replaces "RelVol", as it's a more commonly used term in trading.
Aside from these small tweaks, the indicator retains all of its original functionality, including the ability to set an anchor timeframe, choose between Regular and Cumulative volume calculation modes, and adjust unconfirmed volume for incomplete bars.
This version exists simply because I needed a more personalized display for an indicator that I rely on daily.
How It Works
The Relative Volume at Time indicator compares the current volume to the average volume at the same time in previous sessions. This helps determine if today’s activity is higher or lower than usual.
Examples
On a daily chart (1D timeframe, length = 10), each volume bar compares today's volume to the average volume at the same time over the last 10 days. If today’s volume is higher than usual at this moment, the bar will reflect that.
On an hourly chart (1H timeframe, length = 5), each hourly volume bar compares the current hour’s volume to the same hour in the past 5 days. If the 10 AM bar is high, it means today's 10 AM volume is greater than the average of the past 5 sessions at 10 AM.
On a weekly chart (1W timeframe, length = 8), the indicator compares this week’s volume to the average of the last 8 weeks. A higher bar means this week is seeing significantly more volume than usual.
This logic applies to any timeframe. It always compares the current volume to past volumes at the same point in time.
@Julien_Eche

Bharat Jhunjhunwala v2- Volume Color CodingPurpose of the Script
This script is designed for traders in India to visualize and analyze trading volume in the stock market. It colors the volume bars based on how the current trading volume compares to its average over the past 20 periods. This helps traders quickly identify unusual trading activity.
How It Works Step by Step
Setting Up the Indicator
Name & Display: The script is named "Bharat Jhunjhunwala- Volume Color Coding" and it displays below the main stock chart (overlay=false).
Volume Format: It formats the data specifically for volume (format=format.volume).
User Input
Volume Moving Average Period: Users can set how many periods (e.g., days) to consider for calculating the average volume. By default, it's set to 20 periods, and users can adjust this if needed.
Predefined Volume Ratios
The script uses fixed ratios to categorize the current volume:
Ultra High Volume: 3.0 times the average volume.
High Volume: 1.8 times the average volume.
Ultra Low Volume: Between 0.4 and 0.7 times the average volume.
Note: These ratios are hardcoded, meaning users cannot change them.
Calculating the Average Volume
The script calculates the Simple Moving Average (SMA) of the volume over the specified number of periods (default is 20). This average helps determine what "normal" volume looks like.
Determining Volume Levels
Ultra High Volume: If the current volume is 3 times or more the average, it's flagged as ultra high.
High Volume: If the current volume is 1.8 times or more but less than ultra high, it's flagged as high.
Ultra Low Volume: If the current volume is between 0.4 and 0.7 times the average, it's flagged as ultra low.
Normal Volume: Any volume that doesn't fit the above categories is considered normal.
Color Coding the Volume Bars
Based on the volume level determined:
Red: Ultra High Volume
Orange: High Volume
Blue: Ultra Low Volume
Green: Normal Volume
This color coding makes it easy to spot unusual trading activity at a glance.
Plotting on the Chart
Volume Bars: The script plots the actual trading volume as colored bars according to the categories above.
Volume Moving Average Line: It also plots the 20-period moving average of the volume as a green line. This line serves as a reference to compare current volumes against the average.
Why This is Useful
Quick Identification: Traders can instantly see when there's unusually high or low trading activity, which might indicate significant market moves or investor interest.
Trend Analysis: By comparing current volume to the moving average, traders can assess whether the current market behavior is stronger or weaker than usual.
Decision Making: Colored volume bars can help in making informed trading decisions, such as entering or exiting positions based on volume spikes or drops.
Customization
Adjusting the Moving Average: While the volume ratios are fixed, traders can change the number of periods used to calculate the moving average to better fit different trading strategies or time frames.
Summary
This script enhances the standard volume indicator by adding color-coded signals based on predefined volume thresholds relative to a moving average. It's a helpful tool for Indian stock traders to monitor and react to changes in trading volume effectively.
Volume Surge Momentum Detector [CHE]Volume Surge Momentum Detector – Discover explosive price movements fueled by sudden volume spikes.
Volume Surge Momentum Detector – Capture Key Inflection Points Using Volume Dynamics
Description:
This indicator helps traders identify highprobability entries by focusing on volume dynamics. Significant price movements often occur when interest in a stock rises, and this is reflected in volume spikes. The Volume Analysis Indicator is designed to detect key inflection points such as breakouts and capitulations by analyzing the relationship between volume and price. It enables traders to avoid false breakouts, identify trend exhaustion, and make informed trading decisions.
Key Features:
VolumeBased Inflection Points: The indicator tracks the volume levels to detect when there is significant interest in a stock. High volume signals increased market participation, often preceding large price moves.
Breakout Detection: It identifies breakouts by detecting price moves beyond a key level (the highest price over a certain period) along with a volume spike, indicating strong momentum.
Capitulation Detection: Capitulation is detected when a strong trend weakens and reverses with increased volume, signaling potential trend exhaustion.
Volume Thresholds: By using statistical measures, the indicator identifies unusually high or low volume based on the average volume and standard deviations, helping traders to spot major turning points in the market.
This tool simplifies volume bar analysis by automatically highlighting significant volume events, which often indicate large upcoming price movements.
Detailed Breakdown:
1. Volume as a Catalyst for Price Movements:
Volume is essential for price action. Without sufficient volume, price moves may not be sustained. This indicator highlights moments of increased market interest by tracking significant volume increases, helping traders stay ahead of major price movements.
2. Breakouts and Capitulation Detection:
Breakout: Detected when the volume exceeds an upper threshold (based on two standard deviations above the average volume) and the price breaks above the highest close of the previous period. These moments are marked with green labels on the chart.
Capitulation: Detected when volume increases significantly but the trend cannot sustain itself, and the price reverses below the lowest close of the previous period. These moments are marked with red labels on the chart, indicating potential trend exhaustion.
3. Sentiment and Market Dynamics:
Market sentiment can lead to price inflections when one side of the market becomes overbought or exhausted. Volume spikes in either direction provide clues as to whether a trend will continue or reverse. This indicator helps identify these critical points by monitoring volume patterns.
4. Visual Representation:
Green Bars: High volume indicating strong market interest or momentum.
Red Bars: Low volume, signaling potential lack of interest or exhaustion.
Gray Bars: Normal volume, helping to distinguish significant market events from regular activity.
Breakout and Capitulation Labels: Green labels for breakouts and red labels for capitulation points are shown directly on the chart for easy reference.
5. Alerts for Key Signals:
Breakout Alert: Notifies traders when a breakout occurs with strong volume, indicating a potential for significant price movement.
Capitulation Alert: Alerts traders when a capitulation occurs, suggesting a trend reversal.
High and Low Volume Alerts: Receive notifications when the volume exceeds the upper or lower thresholds, highlighting key moments of market interest or disinterest.
Why This Indicator Matters:
Traders often miss significant price moves or enter too late. This indicator helps traders by identifying highprobability entry points before the stock makes major moves. By focusing on volume spikes, the indicator provides insight into market sentiment and allows traders to act quickly.
How It Works:
1. Calculate Volume Significance: The indicator calculates the average volume over a userdefined period (`length`) and identifies significant deviations using standard deviations.
2. Mark Key Levels: Breakouts are detected when price moves above recent highs with significant volume, while capitulation is flagged when trends show exhaustion with a volume spike and price reversal.
3. Receive Alerts: Traders can set up alerts for key events like breakouts, capitulations, and significant volume changes to stay informed in realtime.
Perfect For:
Active traders looking to spot early market movements driven by volume changes.
Traders who want to avoid false breakouts by confirming price moves with volume spikes.
Swing traders identifying capitulation points to reduce exposure or enter positions on trend reversals.
How to Use:
Customize the "Average Period" to determine how many bars are used to calculate the average volume.
Adjust the "Multiplier for Standard Deviation" to finetune the sensitivity of high and low volume detection.
Enable alerts to receive realtime notifications for breakouts, capitulations, or volume spikes.
Conclusion:
Volume analysis is essential to understanding stock movements. This indicator simplifies the process of identifying breakouts and capitulation points by using volume dynamics. Whether you are a beginner looking for powerful tools or an experienced trader refining your strategy, this indicator offers valuable insights into market behavior driven by volume.
Additional Insights:
1. Statistical Significance: The use of standard deviations to identify high and low volume gives the indicator a statistical basis, helping to reduce noise and false signals.
2. Flexible Alerts: Traders can set up custom alerts based on their trading preferences, whether they focus on volume changes or price breakouts and reversals.
This detailed description now includes all the important aspects of the script without referencing any external sources, focusing solely on the functionality and trading strategy the script provides.
Best regards
Chervolino

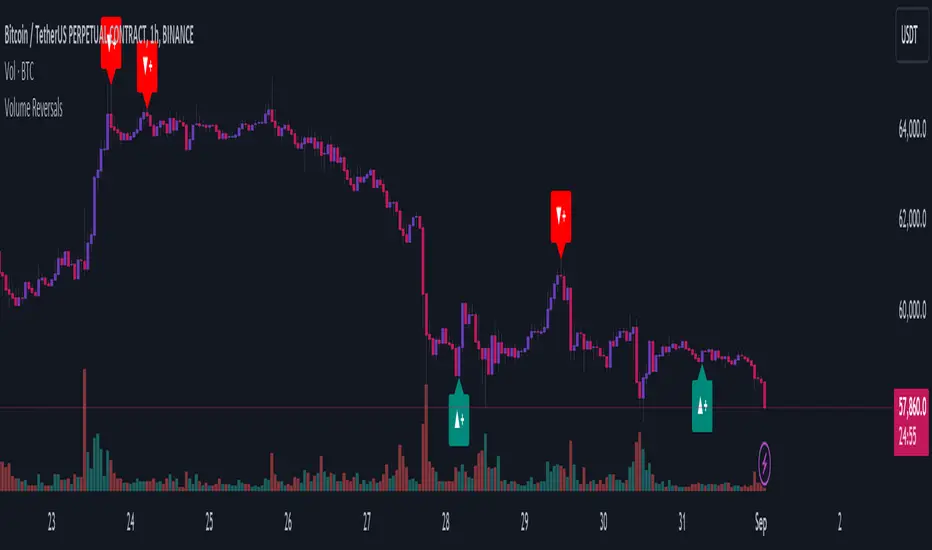
Volume ReversalsThe "Volume Reversals" indicator is a trading tool designed to identify potential buy and sell signals based on volume patterns.
Features
Filter Signals : Traders can enable or disable additional filtering of signals, which refines the conditions under which buy and sell labels are displayed.
Buy and Sell Labels: The indicator dynamically places labels on the chart to signify buy ("▲+") and sell ("▼+") opportunities. Buy labels appear at low points of bars with a green upward-pointing arrow, while sell labels appear at high points with a red downward-pointing arrow.
Customizable Alerts: Users can set alerts for buy and sell signals, receiving notifications when conditions match predefined patterns.
Logic Explained
Volume Comparison: The script examines a sequence of the last five volume bars to detect increasing or decreasing trends.
Price Action Analysis: Each volume bar is paired with a corresponding price action (bullish or bearish) from the same period.
Signal Conditions: A signal is generated under two scenarios:
Normal Conditions: Sequential increase/decrease in volume over three bars accompanied by bearish/bullish price action, followed by a dip in volume with a bullish/bearish bar.
Filtered Conditions (if filter is active): Requires all last four bars to be bearish/bullish, the most recent bar's volume to be less than the immediate previous, and then exceeds the volume two bars prior, closing bullish/bearish.
This indicator is suited for various assets and timeframes, especially in markets where volume plays a significant role in price dynamics.
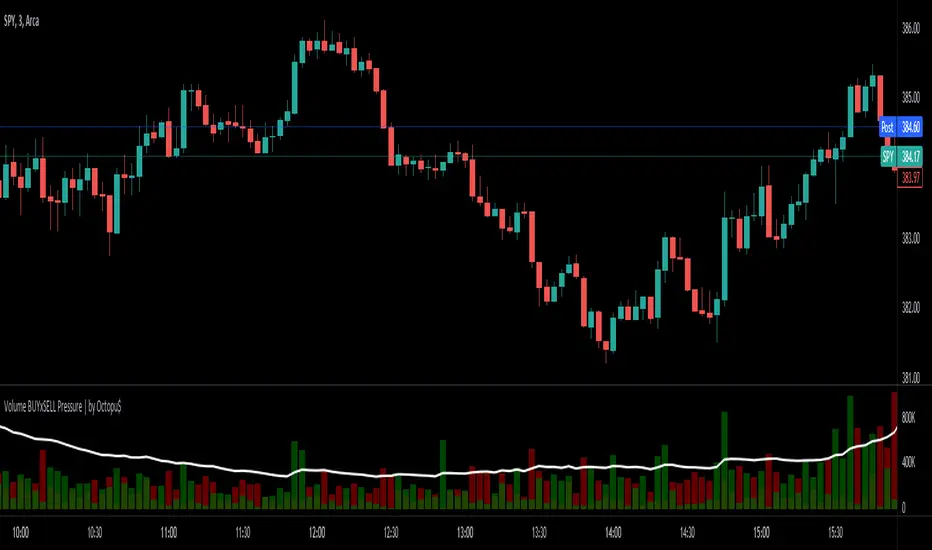
⚖ Volume BUYxSELL Pressure | by Octopu$⚖ Volume BUYxSELL Pressure | by Octopu$
Volume is the number of shares traded in a particular stock, index, or other investment over a specific period of time.
It can indicate market strength, as rising markets on increasing volume are typically viewed as strong and healthy.
In fact, the more, the better. Institutions tend to get more involved in a stock with daily dollar volume in the hundreds of millions or more
But also, when prices fall on increasing volume, the trend is gathering strength to the downside.
That's where BUYxSELL Pressure | by Octopu$ comes in.
Typically, Volume bars follow the candles.
If the Candle is Green (Close > Open), the Volume Bar is also Green.
Now if the Candle is Red (Close < Open) the Volume Bar is also Red.
You never know if it is being Bought or Sold.
This changes the game: along with Price Action, Trend Direction, and other factors. This is possible!
This indicator is composed of:
Volume itself (all of it), displayed by Gray bars;
Identifies Buying Pressure on Green Bars;
And Selling Pressure with Red Bars.
Volume Average as a White Line, for the last "X" Days
Additionally,
It presents a Yellow Triangle as and indication of when the Volume is above the Average in the current TF you are in.
Additionally, this can be set up via an Input: Means if you like to watch it 10% above Average, you got it. 25%? 50%?... You name it.
On top of that,
Includes an indication for Volume Spike as well. So if informs you visually on the Volume Bars of any surges on the TF you are in.
For example: 2x the Volume from the last Candle. Or maybe 3x? 5x... The way you like it the best.
This way, with the combination of your understanding as well as other Indicator and Factor as Confluence, you can improve your analysis and figure out what is going on.
www.tradingview.com
(SPY 5m as an example only)
SPY
Features:
• Total Volume
• Average Volume
• Buying Pressure
• Selling Pressure
• % Above Average
• Volume Spike/Surge (Multiplier)
• Custom Settings
Options:
• Show/Hide Average Line
• Change Length of Average (Days)
• Select/Personalize % of Above Avg
• Add Personalized X Multiplier
• Fully customizable on Style and Colors
• Change shapes and Location
Notes:
v1.0
Indicator release.
Changes and updates can come in the future for additional functionalities or per requests. Follow and Stay Tuned!
Did you like it? Please Support and Shoot me a message! I'd appreciate if you dropped by to say thanks! Thank you.
- Octopu$
🐙
Volume Average % Cross - ChartVolume Average Percentage Cross Indicator - Chart
This version is specialized for notifications on your chart. If you wish to see notifications on your volume bars please choose "Volume Average Percentage Cross Indicator - Default".
What is the Volume Average % Cross - Chart Indicator you might ask yourself - what is it for?
I will tell you!
Use Case:
In my Indicator you have an Input to set the period for the volume average period.
Once the volume average period is calculated it is now necessary to choose the percentage value.
What is the percentage value?
The percentage value multiplies the past volume bar with a positive percentage value and a negative percentage value. I give this calculation the name "VolPercentage".
If the volume average is below the negative VolPercentage Value it means that the last volume bar is stronger than the volume average period by the percentage you set the percentage value input at.
If the volume average is above the positive VolPercentage Value it means that the last volume bar is weaker than the volume average period by the percentage you set the percentage value input at.
That means that if for example the percentage value would be 20 it would require the volume average to be 20% above the past volume bar.
That means that if for example the percentage value would be 20 it would require the volume average to be 20% lower than the past volume bar.
Once I uploaded my 100 Indicators I will accurately describe each indicator with videos, this will be huge!
Interpretation:
Volume is the amount of market participants who bought in a candlestick bar a set amount of shares at varying prices from within the bar itself.
If volume decreases it means that there has been fewer market participants and if it increases it means that there is an increase of market participants.
If this is used with candlestick patterns it helps tremendously to identify strong or weak doji candlesticks.

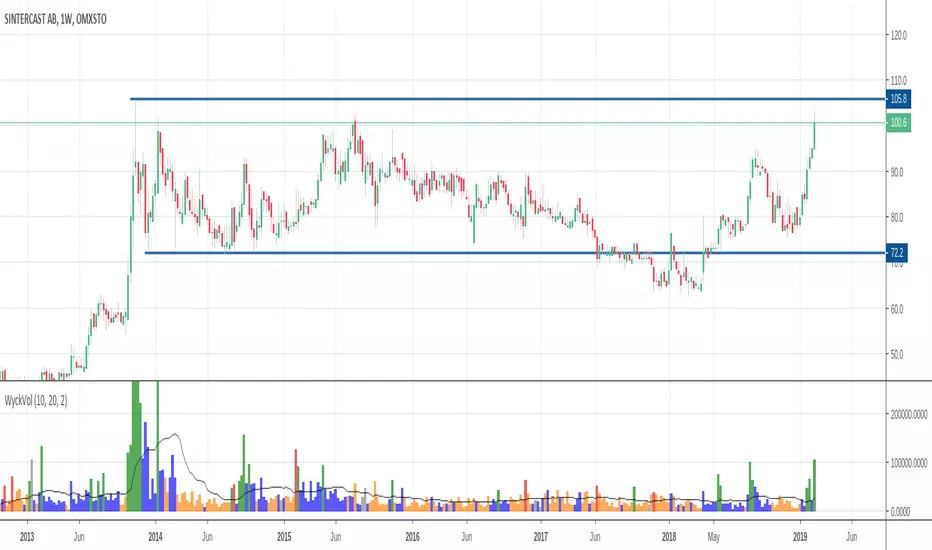
Wyckoff Volume ColorThis volume indicator is intended to be used for the Wyckoff strategy.
Green volume bar indicates last price close above close 10 days ago together with volume larger than 2 * SMA(volume, 20)
Blue volume bar indicates last price close above close 10 days ago together with volume less than 2 * SMA(volume, 20)
Orange volume bar indicates last price close lower than close 10 days ago together with volume less than 2 * SMA(volume, 20)
Red volume bar indicates last price close lower than close 10 days ago together with volume larger than 2 * SMA(volume, 20)
The main purpose is to have green bars with a buying climax and red bars with a selling climax.
Three variables can be changed by simply pressing the settings button.
How many days back the closing price is compared to. Now 10 days.
How many times the SMA(volume) is multiplied by. Now times 2.
How many days the SMA(volume) consists by. Now 20 days.
Coloured Volume Grid 1.0Candles are coloured based on relative price and volume:
- If today’s closing price and volume are greater than (n) bars ago, color today’s volume bar green.
- If today’s closing price is greater than (n) bars ago but volume is not, color today’s volume bar lime.
- Similarly, if today’s closing price and volume is less than (n) bars ago, color today’s volume bar orange.
- If today’s closing price is less than (n) bars ago but volume is not, color today’s volume bar red.
The above logic in itself gives pretty remarkable considering how simple the idea is. I have added a multi-timeframe feature where the same logic is applied to 4 other timeframes. This way you can quickly be aware without having to check. There are four layers and the default settings show (from top to bottom) daily, 4h, 1h and 15m
All timeframes are adjustable in the settings.
VRD-5: Volume Reversal Detector (5 Bars)Overview
This Pine Script indicator detects potential trend reversals based on volume patterns over a 5-bar period. It identifies accumulation (bullish) and distribution (bearish) patterns using volume analysis combined with price action.
Key Features
Volume Analysis:
Compares current volume to a 34-period SMA
Identifies strong/weak volume using configurable thresholds
Calculates volume "energy" as a 5-bar average ratio
Pattern Detection:
Bearish Signal: Looks for decreasing volume after a strong volume bar
Bullish Signal: Looks for increasing volume after weak volume bars
Visualization:
Colored volume histogram (bullish/bearish/neutral)
SMA volume line
Labels for detected signals
Customization Options:
Adjustable lookback period (3-10 bars)
Configurable thresholds for volume strength
Strict mode requiring confirming price action
Suggested Improvements
Performance Optimization:
Reduce the max_labels_count (currently 500) to improve performance
Consider using barstate.isconfirmed for more efficient calculations
Enhanced Visualization:
Add arrows on price chart for better visibility
Include a background color highlight for signal periods
Add option to display the energy level as a separate line
Additional Features:
Incorporate RSI or MACD for confirmation
Add multi-timeframe analysis capability
Include a strategy version for backtesting
Code Structure:
Separate the logic into distinct functions for better readability
Add more detailed comments for complex calculations
Consider using varip for real-time updates if needed
User Experience:
Add input options for label text size/position
Include sound options for alerts
Add a toggle for the information table
This indicator provides a solid foundation for volume-based reversal detection that could be further enhanced with these improvements while maintaining its core functionality.

Enhanced Volume w/ Pocket Pivots, Milestones & LiquiditySure! Here’s a professional and clear **description** you can use when saving or publishing the script on TradingView:
---
## 📄 Script Description: *Enhanced Volume w/ Pocket Pivots, Milestones & Liquidity*
This custom volume indicator enhances the default volume view by combining key institutional-level insights into a single tool. It highlights meaningful volume activity, liquidity conditions, and milestone events to help traders better understand accumulation/distribution and smart money participation.
### 🔍 Features:
* **Color-coded volume bars**:
* 🔵 **Pocket Pivot Volume (PPV)**: Up-day with volume > highest down-day volume of last 10 bars.
* 🟢 **Up Volume**: Up-day with volume > 50-day average.
* 🔴 **Down Volume**: Down-day with volume > 50-day average.
* 🟠 **Dry Volume**: Low-volume bars < 20% of 50-day average.
* ⚫ **Neutral/Other bars**: No significant signal.
* **Volume Milestones**:
* **HVE**: Highest volume ever (20 years lookback).
* **HVY**: Highest volume in the past 1 year (252 bars).
* **HVQ**: Highest volume in the past quarter (63 bars).
* **Projected Volume**:
* Real-time estimate of end-of-day volume based on elapsed session time.
* **Liquidity Metrics**:
* Displays current and 50-day average dollar volume.
* Estimates 1-minute liquidity for large-position feasibility.
* **Relative Volume Label**:
* Displays how today’s volume compares to the 50-day average.
* **Alerts Included**:
* Set alerts for HVE, HVY, and HVQ to catch key breakout or climactic volume events.
---
### 🧠 Ideal For:
* Growth stock traders
* Volume/price analysts
* Intraday & swing traders
* Institutions or prop traders needing liquidity benchmarks
---
Let me know if you'd like a short or promotional version (for sharing with others).

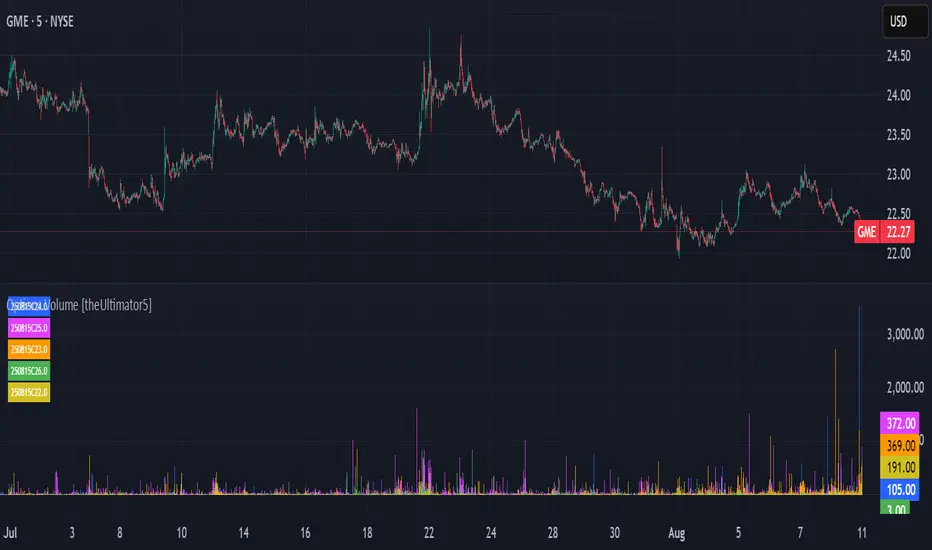
Options Volume [theUltimator5]📊 Option Volume — Multi-Strike Option Flow Visualizer
The Option Volume indicator tracks and visualizes volume activity for up to 10 custom option strike symbols on any ticker. It supports both individual strike analysis and a combined cumulative volume mode, providing an intuitive view of option flow across your selected strikes.
🔧 Features:
Dynamic Strike Control: Select up to 10 strikes and customize each with ticker, expiration date (YYMMDD), and option type (Call or Put).
Volume Display Modes:
🔹 Individual: Shows a separate volume bar for each strike.
🔸 Cumulative: Combines all selected strike volumes into a single bar, colored green for Calls and red for Puts.
Customizable Table Display:
Toggle the option symbol table on/off.
Position the table in any corner of the chart.
Table cell colors match plotted bars in Individual mode, or turn red/green in Cumulative mode based on option type.
Smart Volume Filtering: Only shows volume bars on the bar where volume updates (i.e., no carryover from stale bars).
Input Efficiency: All strike prices are automatically rounded to the nearest 0.5 increment for standardized symbol formatting.
⚙️ How to Use:
Select the ticker you want to analyze.
Input the expiration date and option type (C or P).
Define strike prices (up to 10).
Toggle between Individual or Cumulative volume display.
Adjust the number of visible strikes and table position as needed.
This tool is ideal for traders looking to monitor strike-level option volume behavior, spot flow anomalies, or keep track of high-interest strike activity in real-time.
The indicator currently doesn't support multiple expiration dates or a combination of calls/puts. If you want to view multiple expirations or a both calls and puts at the same time, simply add the indicator multiple times.
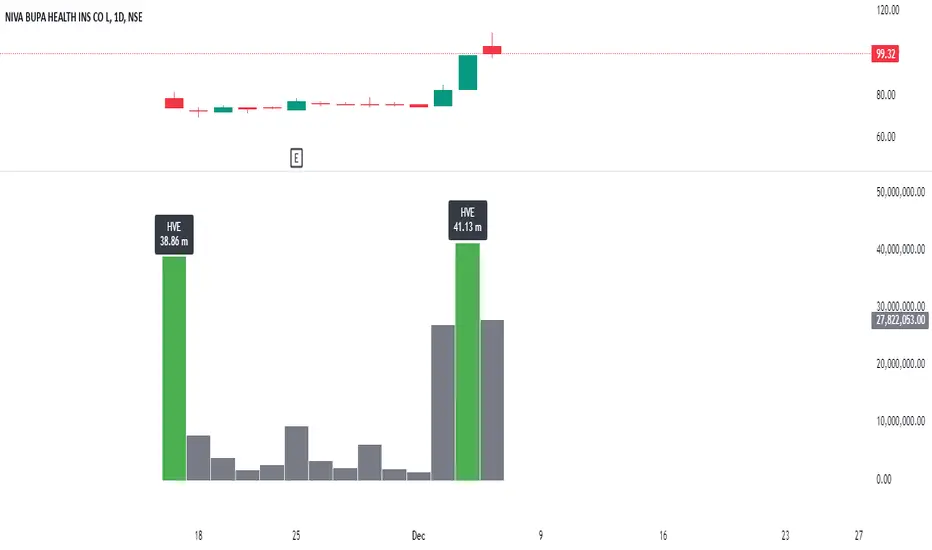
Highest Volume EverOverview:
The Highest Volume Ever (HVE) indicator highlights the highest volume bar in the visible chart history. It visually emphasizes significant volume spikes, helping traders identify key moments of market activity, such as breakout signals or accumulation phases.
Key Features:
Automatic Detection of Highest Volume:
The indicator dynamically scans the entire chart history to identify the bar with the highest trading volume, marking it with a clearly visible label.
Volume in Millions:
The label displays the highest volume in millions, providing a concise and readable format for better interpretation.
Adaptive Positioning:
The label is positioned slightly above the volume bar, ensuring it doesn't obstruct other chart elements while remaining close to the bar for easy reference.
Use Cases:
Identify Significant Market Activity: Detect periods of unusually high volume, often indicating the start of strong trends or the end of consolidations.
Confirm Breakouts: High volume often confirms the strength of breakout moves.
Spot Accumulation or Distribution: Unusually high volume can signal institutional buying or selling.
How to Use:
Add the indicator to your chart on TradingView.
The highest volume bar will be highlighted with a green bar and an "HVE" label above it.
Adjust the chart range to see how the indicator dynamically updates.
Perfect for:
Traders who rely on volume analysis to confirm price movements and detect significant market events.
Advanced Volume-Driven Breakout SignalsThe "Advanced Volume-Driven Breakout Signals" indicator is a cutting-edge tool designed to help traders identify high-potential trading opportunities through sophisticated volume analysis techniques. This indicator integrates volume flow analysis, moving averages, and Relative Volume (RVOL) to provide a comprehensive view of market conditions, going beyond traditional Volume Spread Analysis (VSA) methods.
Key Features:
Volume Flow Analysis: Distinguishes bullish and bearish volume flows with distinct colors, making it easier to visualize market sentiment and potential breakout points.
Volume Flow Moving Averages: Calculates moving averages for volume using various methods (SMA, EMA, WMA, HMA, VWMA), accommodating different trading strategies. This includes settings for adjusting the type of moving average and its period, as well as thresholds for high, medium, and low volume levels.
Volume Spikes Detection: Identifies significant volume spikes based on user-defined multipliers and moving averages, highlighting unusual trading activity.
Volume MA Cloud Settings: Computes general moving averages of volume to track trends and detect deviations. This feature includes options to select different moving average types and adjust thresholds for detecting high volume activity.
Relative Volume (RVOL): Measures current volume relative to historical averages, triggering signals when RVOL exceeds predefined thresholds, indicating notable changes in trading activity.
Entry Conditions: Provides clear long and short entry signals based on combined volume flow conditions and RVOL, offering actionable trading opportunities.
Volume Visualization:
— Bullish Volume Flow: Light and dark green bars indicate bullish volume flow.
— Bearish Volume Flow: Light and dark red bars denote bearish volume flow.
— High Volume Bars: Highlighted in yellow, and extreme volume bars in orange for additional context. These bars are plotted for visual aid and do not directly influence trade signals, focusing instead on the quality and strength of the volume flow.
Alerts: Allows users to create alert notifications for long and short entry signals when the criteria are met, enabling traders to respond promptly to trading opportunities.
Usage:
Overlay: Apply the indicator directly to your price chart to visualise real-time signals and volume conditions.
Customisable: Adjust settings for moving averages, RVOL, and other parameters to match your trading strategy and preferences.
Comparison to VSA Scripts: The "Advanced Volume-Driven Breakout Signals" indicator extends beyond traditional VSA scripts by incorporating a wider range of analytical features. While VSA primarily focuses on volume spread patterns and price action, this indicator offers enhanced functionality with advanced RVOL metrics, customizable moving averages, and detailed volume spike detection, making it a more versatile tool for identifying breakout opportunities and managing trades. It is particularly effective when used alongside key levels and order blocks.
Acknowledgements: Special thanks to @oh92 and @goofoffgoose for their invaluable scripts, which served as inspiration in the development of this advanced trading indicator.
Notes: The script is continually evolving, with ongoing refinements aimed at enhancing accuracy and performance.
