Поиск скриптов по запросу "VWAP"
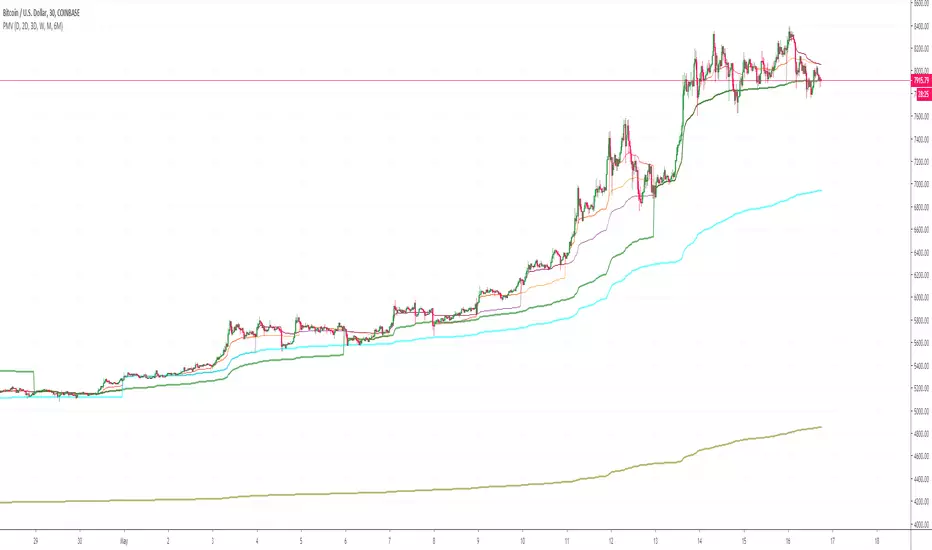
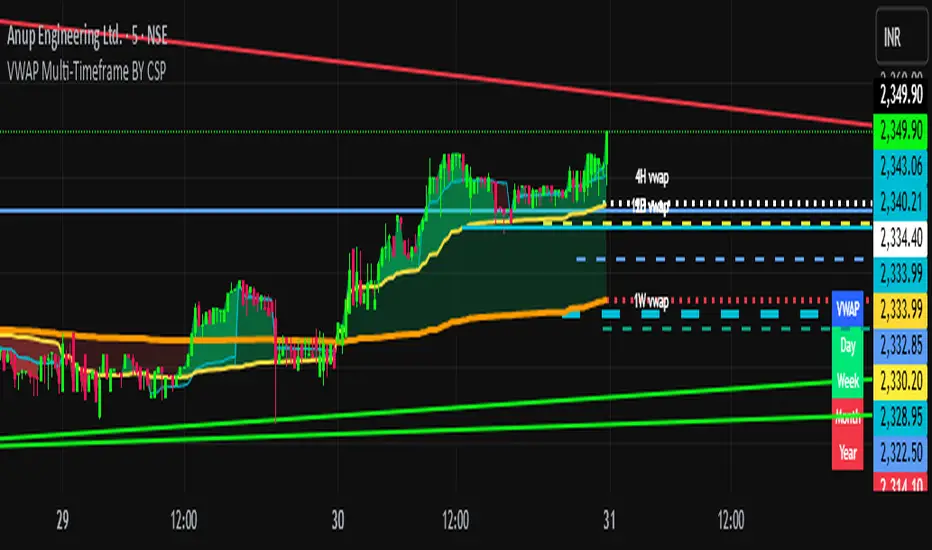
Perigraph's Customizable Multi VWAP LinesCustomizable Multi VWAP Lines
input examples:
30, 60, 120, 180, 240,360,480, 720 = minutes
D = Days
W = Weeks
M = months
12M = 12 Months
Custom Anchored VWAP Offset V2This is the anchored VWAP with offset option which can be used on any timeframe, including intraday.

Volume Trends (VWMA & VWAP)Basic indicator for tracking volume trends. Includes blue SMA and pink VWMA (volume-weighted moving average), to help gauge the strength of price movement -- is it supported by volume, or is there divergence. Intraday charts also have VWAP (volume-weighted average price) as dark purple dots.
Here's a couple of good articles explaining how to use them effectively:
www.tradeciety.com
stockcharts.com

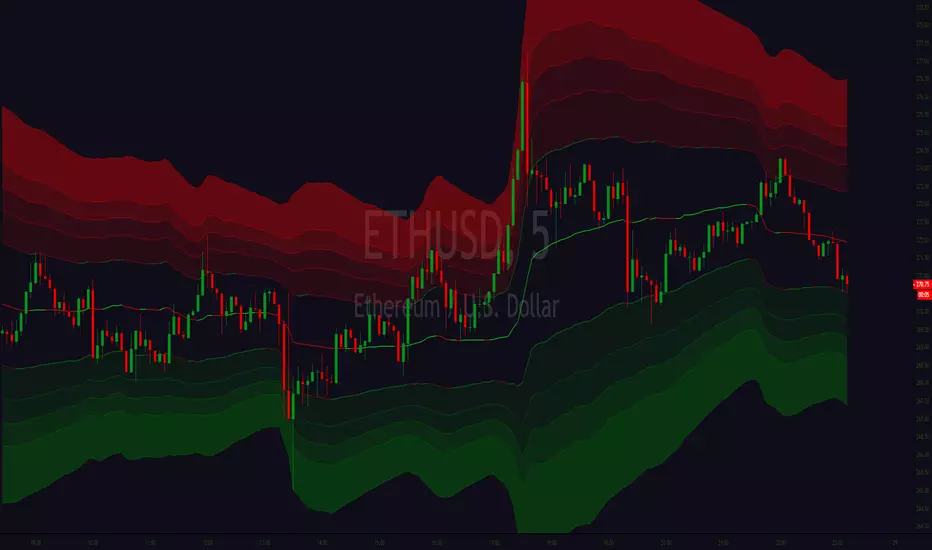
Adjustable Starting VWAPIn this script it's possible adjust the start where the VWAP (technically is a VWMA) starts to calculate.
Use this to try to show where is the suport and resistance.
I coded 6 lines.
Use low sources for suport.
Use high sources for resistance.

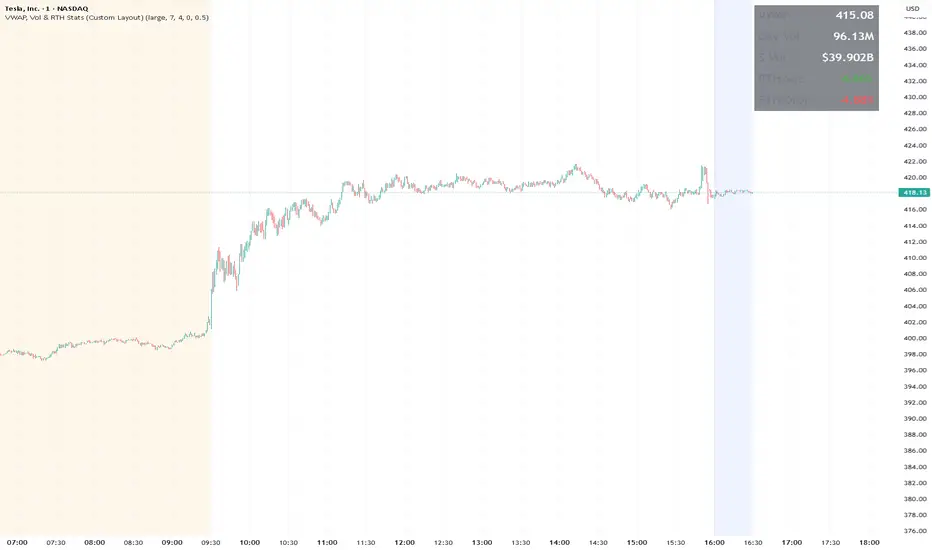
VWAP, Vol & RTH Stats (Custom Layout)VWAP, Volume & RTH Stats Box This indicator displays a data table in the top-right corner of the chart designed for intraday liquidity analysis. It fetches the true "Daily" volume to ensure accuracy regardless of the timeframe used. It specifically isolates Regular Trading Hours (RTH) to calculate the daily range performance (Max Squeeze % and Max Drop %), filtering out pre-market noise to show the true strength of the move. Includes full customization for dimensions, margins, and colors.
VWAP WarriorVWAP warrior provides support and resistasnce flip levels based off of logic with displacement from areas of interest where institutions are filling their orders.
Use these areas and levels of break and retest to ensure maximum efficiency. The lower the period bars, the more levels however the more chance of disrespecting these levels and should be more used for scalping.


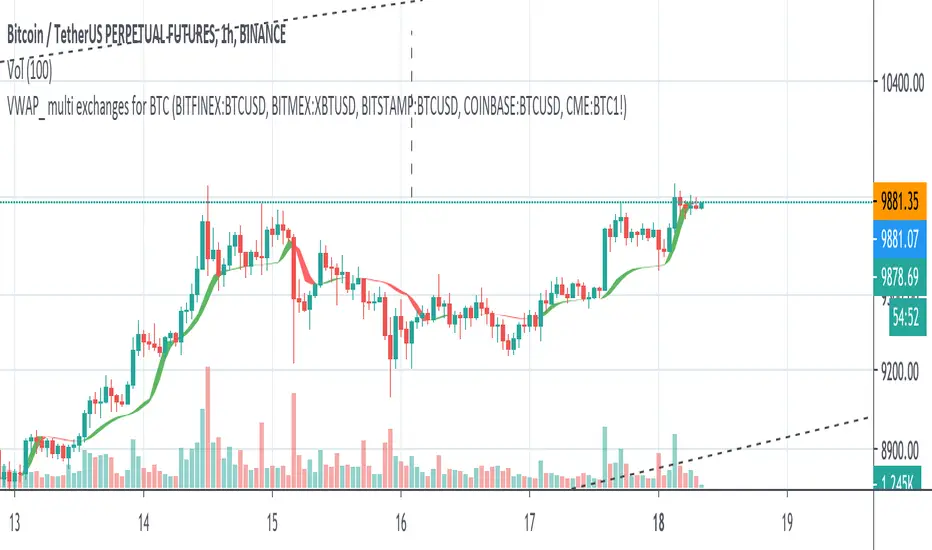
VWAP_ multi exchanges for crypto marketvwap of multiple exchanges to smooth the signal.
above the ribbon long.
under the ribbon short
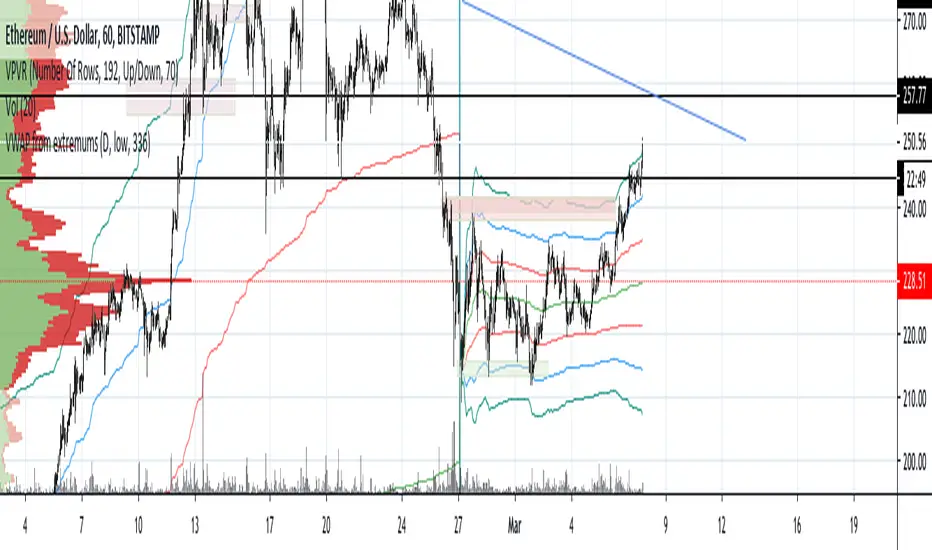
VWAP from extreme pointsVWAP with standard deviations built from extremes at senior timeframes specified to points at lower timeframes.
Recommended settings: D for senior timeframe, 336 bars back if you use 1 hour chart.


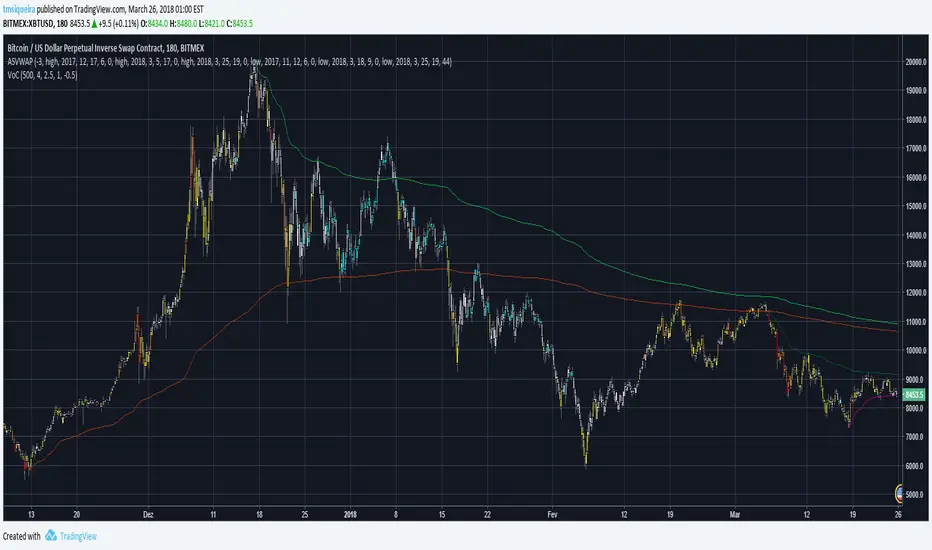
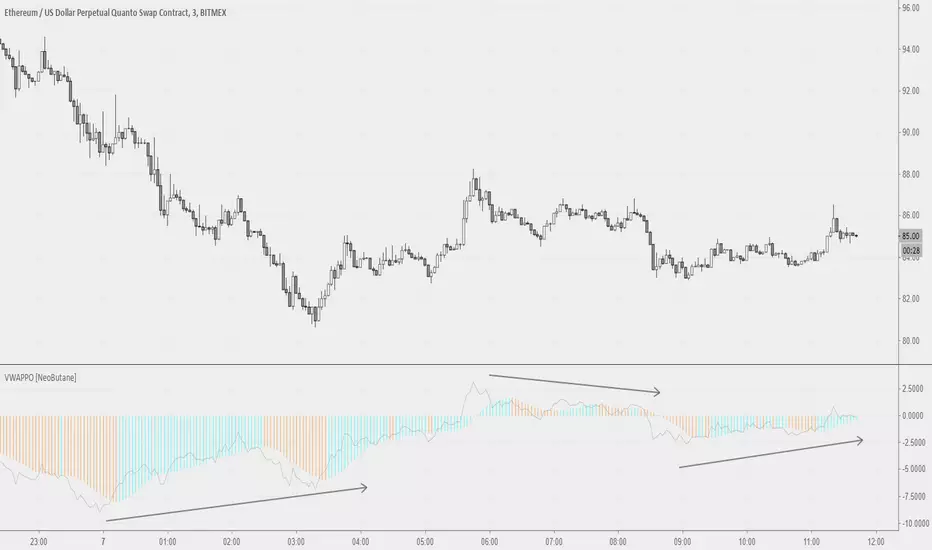
Volume Weighted Average Price Oscillator [NeoButane]VWAP on PPO but not PPO. Two histograms, with the second one being SMAs of the first and signals color/trend change.
1.0 - Release
Framework laid out
Power level readings should be within 9000
JMF_Vwap BLVD w/Dual lookback and Map Zones. This study identifies on the your top 3 highest volume candles and launches independent vwaps from each of those bars within the users given lookback, As well as static closing vwap values of the candle.
User has a "Calendar lookback" input that you can search a number of CALENDAR days back for highest volume bars. On the daily chart this will identify your highest volume DAYS.
On an intraday chart it will identify your highest volume BARS. example= on a 5 min chart, with a calendar look back of "5 days" the BLVD indicator will search back 5 days on the 5min chart and look for the top 3 highest volume CANDLES, and launch continuous and static vwaps from them. Continuous is a vwap that is launched and gives the cumulative average price from launch until a new Top 3 high volume bar is formed, then the vwaps will sequentially re-order themselves in order of highest to lowest volume.
Static Vwaps are the CLOSING vwap value of the launch candle. These levels act as strong support and resistance when launched from the highest volume candles. They represent participants whom have bought or sold that candle, and have yet to average in our out of a position, "buy and hold", or "Bag holders". These levels usually experience a high degree of sell pressure as they are encountered from underneath, vice versa, they can act as strong support when launched from lows, or on the first few encounters of the level when price is coming down to them.
The best way to use and identify relevant Vwap BLVDs is on a split screen chart, a intraday time frame with a short and mid look back, and a longer 4hour or daily chart with a mid to long lookback side by side showing immediate and long term liquidity levels. In route to the daily BLVD levels which hold your highest levels of liquidity/volume you ultimately run into shorter time framed BLVDs that have been launched from smaller time frame candles intraday at high volume events, these levels are massively important for intraday trading and can stop price dead in its tracks, not JUST the daily vwap BLVD value.
That is why this version has a short, and a long term look back, each lookback is accompanied with Standard deviation bands that are color coded and labeled for quick ID. User can turn on or off if they choose.
You can launch a short look back (2-5 day) and use the deviation bands in the same manner as you would the intraday vwap deviation bands and take any of our 4 trade types in the same manner as intraday vwap.
ALSO, you can set it for 2days back and have a previous day vwap BLVD and see the controlling liquidity from the previous days range, or where the "most" participants average price is. You will get vwaps Launching from the most relevant, highest volume bars within the last 48 hours, or do 7 days back for a weekly BLVD, this will show who and where is in control on the weeks range. These two lookbacks are often the most useful for intraday scalping while also targeting the longer range overhead volume on the higher time frame " Daily BLVD ".
This is a User intensive study as far as settings go, I encourage everyone to change settings calendar wise on all time frames to find what suits your style of trading and time frame the best, and to play with the remaining add on's to see what you like, or find value in, or what you dislike, and would want to keep off.
It also includes "Map zones", these are zones associated with the launch candles average price and range. I have witnessed the high and low of these ranges be respected over and over again intraday, User can turn the background cloud off in settings if they prefer or dim the color in settings.
ALL settings and plots can be turned down, adjusted, or turned off If the visual is to impactful for you, take the time to Turn off or change any of the additional features that are included. You can minimize the study all the way down to just one line with the Highest volume vwap BLVD if you prefer or you can have all of it on for a fully immersive experience.
User also has a table on chart that can be hidden that lists the vwaps price, and Candle launch volume. This volume metric comes in handy when approaching a vwap value for the FIRST TIME. after that the supply or demand is or has diminished, but its still good to know how much it launched with so you can compare current candle volume.
Enjoy-
JMF
Color coding=
Gold = highest volume vwap continuous and static.
Red = 2nd highest volume vwaps.
Purple = 3rd highest volume vwaps.
*** ALL USERS ASSUME ALL RESPONSIBILTIY WHILE USING THIS TOOL. THIS IS NOT, NOR SHOULD NOT BE MISCONSTRUED AS FINANCIAL ADVICE. USER ASSUMES ALL RISKS ASSOCIATED WITH THE USE OF THIS TOOL WHILE TRADING,AND FOR ANY AND ALL LOSS THAT MAY OCCUR WHILE USING SAID TOOL. TRADING IS RISKY AND USER COULD STAND TO LOSE ALL CAPITAL INVESTED.
Credit to @RumpyPumpyDumpy for the help on the original logic for Vwap BLVD. Without him this wouldn't have been possible on tradingview.

VWAP_CURRENT_YESTERDAY
The "VWAP CURRENT YESTERDAY" is a Pine Script designed for TradingView that automatically calculates and plots the Volume Weighted Average Price (VWAP) for the current day, the previous day.
Dynamic VWAP Calculation:
Automatically generates VWAPs for 1 day and 2 day.
User-Friendly Customization:
Through input options, users can easily toggle the visibility of each VWAP line, adjust colors, and set line thicknesses to their preference.
Configuration Options
1. VWAP Source:
Choose the price source for VWAP calculation. Default is the typical price (`hlc3` - the average of high, low, and close).
2. VWAP Lines:
Toggle the display for Today's VWAP, Yesterday's VWAP, and the VWAP from 2 days ago.
Customize colors and thickness for each VWAP line for clear visual distinction.
3. VWAP Labels:
Configure label sizes and positions to ensure that VWAP values are easily identifiable on the chart.
How It Works:
- The script calculates the sum of price multiplied by volume (`vwapsum`) and the sum of volumes (`volumesum`) for the specified periods.
- It utilizes an impulse function to reset calculations at the start of each new session or custom date, ensuring accurate and relevant VWAP values .
- Final VWAP values are plotted as lines on the chart, with optional labels for current and 2-day VWAPs for quick reference.
Customization Guide:
- To activate or deactivate specific VWAP lines, navigate to the 'VWAP Lines' section in the script's settings and toggle the respective options.
- Adjust the color and thickness of each VWAP line under the same section to match your charting preferences.
- Label settings, including size and offset, can be customized in the 'VWAP Labels' section, allowing for personalized label positioning and readability.

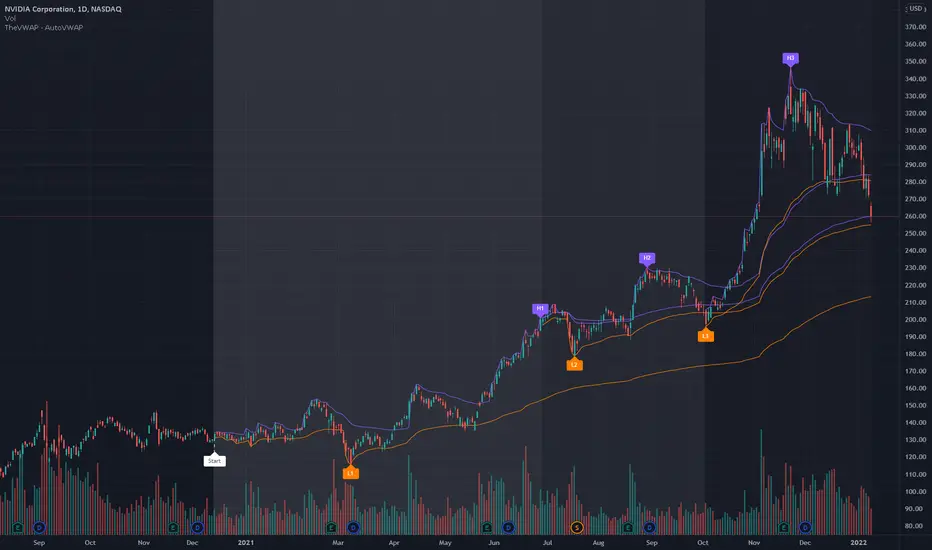
TheVWAP - AutoVWAPAutoVWAP 'slices' the chart into three search zones, from within which it IDs the High and Low of each period. Custom VWAPs are then auto-anchored to each High and Low, sparing the user significant time vs. constructing anchored VWAPs manually.
Designed to be utilized as a starting point for chart evaluation and time-saver rather than a perfectly tailored, unique series of custom VWAPs.
Start date and custom colorization is user-defined.
Use the link below to obtain access to this indicator and to learn more.
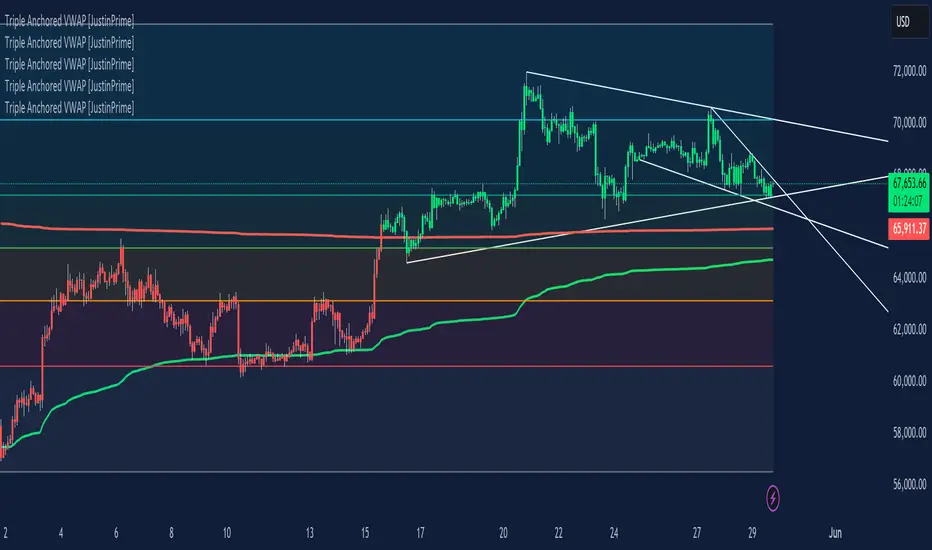
Triple Anchored Volume Weighted Average Price [JustinPrime]This indicator provides three separate Volume Weighted Average Price (VWAP) calculations, each anchored from different key points on the chart:
High Anchored VWAP: Resets from the highest price reached since the start date.
Low Anchored VWAP: Resets from the lowest price since the start date.
Start Date VWAP: Calculated from the trading data beginning at the user-defined start date.
Features:
Selectable Timeframe: Choose from timeframes like 1 minute, 5 minutes, 15 minutes, 1 hour, daily, and weekly.
Custom Start Date: Set a specific start date for the VWAP calculations.
Source Data: Uses high, low, and close prices (HLC3) for calculations.
How to Use:
Adjust the start date to focus on significant market periods or events.
Differentiate each VWAP with unique colors for clarity.
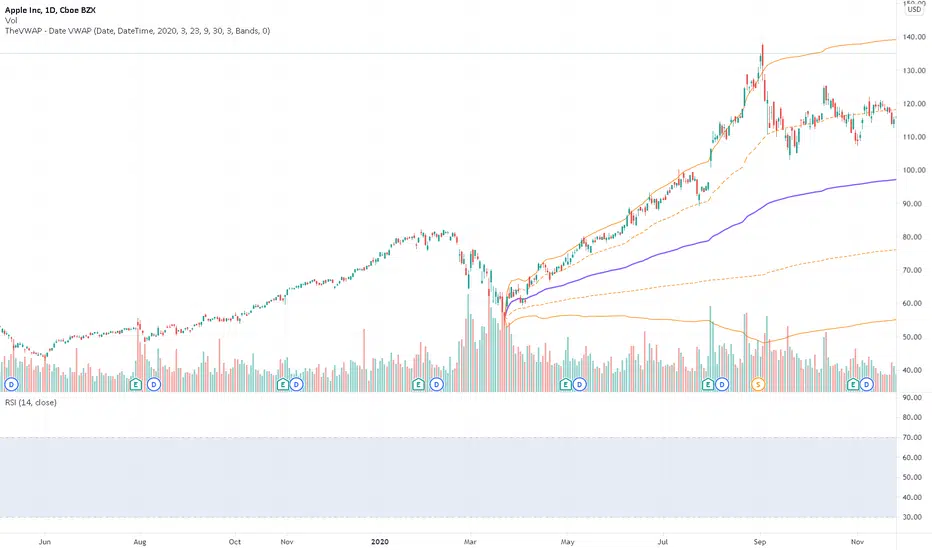
TheVWAP - DateVWAPDateVWAP gives traders the power to launch a volume-weighted average price and standard deviation bands from any user-input date. Anchor VWAPs to specific fixed dates and times (YYYYMMDD HHMM format) or, with the ‘DaysAgo’ setting, enable a recurring/rolling average that updates as new days elapse — for example, VWAP over the last five trading days.
This study allows traders to quickly gauge the average price since any date visible on the current chart, whether daily or intraday, with additional options to automatically identify — and launch VWAPs from — daily highs or lows. As such, multiple copies of this indicator can be layered on the same chart with distinct colorization for clarity.
Inputs include Date Method, VWAP Type, Start year/month/day/hour/minute, and whether or not to show deviation bands.
Use the link below to obtain access to this indicator.
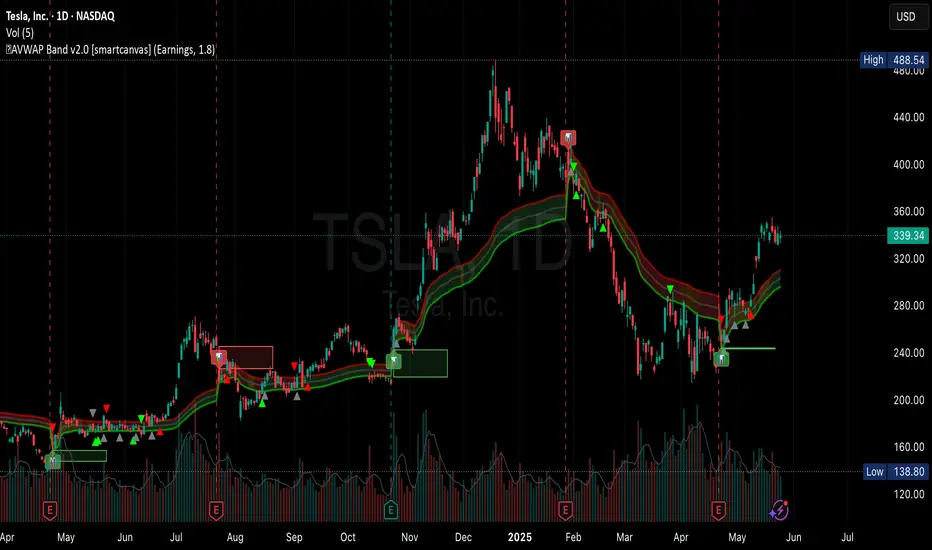
AVWAP Band✨ AVWAP Band by Mars ✨
The AVWAP Band indicator eliminates the guesswork of selecting multipliers for your VWAP analysis. Instead of using arbitrary deviations, this indicator provides three distinct VWAP lines calculated from different price points - giving you a complete VWAP band with just one tool.
What Makes This Different From Standard VWAP
Traditional VWAP indicators use multipliers (1.0, 2.0, 3.0) which require constant adjustment across different markets and timeframes. The AVWAP Band simplifies this by using natural price points:
Low-based VWAP (green) - acts as support
High-based VWAP (red) - acts as resistance
HL2-based VWAP (gray) - acts as the centerline
Key Features
Reduces cognitive load - no more guessing which multiplier to use
User-selected anchor point (click to set date)
Customizable colors and line styles
Built-in alerts for all crossover/crossunder events
Visual anchor point marker
How To Use It
After adding the indicator to your chart, you have to click on your anchor point
Watch for price reactions at each VWAP line
Look for crossovers between price and the different VWAPs
Use the HL2 VWAP as a centerline to determine overall bias
Trading Applications
Support/Resistance levels for intraday trading
Mean-reversion signals when price touches band extremes
Trend confirmation when price holds above/below centerline
Range identification between upper and lower bands
Volatility assessment based on band width
Customization Options
Toggle each VWAP line individually
Adjust line colors to match your chart theme
Control line width and transparency
Enable/disable anchor point label
This indicator simplifies VWAP analysis by giving you natural price-based bands without the need to adjust multipliers across different markets. The high, low, and HL2 sources create a complete VWAP picture with just one tool.
VIDEO
Feedback and suggestions welcome!
Miyagi (10 in 1) + AlertsMiyagi: The attempt at mastering something for the best results.
Miyagi indicators combine multiple trigger conditions and place them in one toolbox for traders to easily use, produce alerts, backtest, reduce risk and increase profitability.
VWAP has been the main condition for entry for our trading community for quite some time now, however using VWAP alone can lead to poor entries and bags.
Miyagi adds filtering conditions which can then be used to improve entries as opposed to simply using VWAP alone.
Miyagi (10-in-1) + Alerts combines multiple trigger conditions in an easy to use format.
Each trigger or filtering condition is selectable and able to be combined using the selector checkboxes.
Trigger or filter conditions can be used on a different timeframe chart than the current user selected chart.
For instance, the user's chart can be set to a 15M for entry however using filtering from a 30 minute RSI.
It is recommended to not use a lower timeframe chart setting than the current chart timeframe.
The following trigger and filter conditions are present in the 10-in-1:
EMA: Takes two "Exponential Moving Averages" into effect for filtering with user selectable chart timeframe, length and sources.
EMA Trend Type is user selectable for Trend-following or Counter-trend which allows you to counter-trade the markets.
Beside the "Simple Moving Average" the EMA has a multiplier.
Calculation is SMAxMultipier / SMAxMultiplier of the previous candle.
MACD: Takes the "Moving Average Convergence Divergence" into effect for trigger condition or filtering with user selectable chart timeframe,
source, fast & slow length and signal smoothing. MACD is a trend-following momentum indicator that shows the relationship between two moving averages of a price.
The MACD is calculated by subtracting the EMA 26 period from the EMA 12. Long alert is triggered on crossing the MACD zero line upwards and short alert vise versa.
RSI: Takes the "Relative Stregth Index" into effect for trigger condition or filtering with user selectable chart timeframe, length, source, and oversold and overbought values.
The RSI is a technical oscillator that uses price and volume data for identifying overbought or oversold signals in an asset.
It can also be used to spot divergences which warn of a trend change in price. This oscillator moves between 0 and 100.
RSI > 80 is considered overbought and an RSI < 20 is considered oversold.
Stochastic RSI: oscillator version of RSI.
Takes the stochRSI into effect for trigger condition or filtering with user selectable chart timeframe, K D, length, upper and lower length.
stochRSI = (actual RSI - lowest RSI) / (highest RSI - lowest RSI)
VWAP: Takes the "Volume Weighted Average Price" into effect for trigger condition with user selectable chart timeframe, period, and VWAP lower line (long),
or VWAP Upper line (Short) values. VWAP is calculated by totaling the money traded for every transaction (price x volume) and then dividing by the total shares traded.
The VWAP appears as a single line on charts. It looks similar to a moving average line, but smoother. In general it is a intraday/week anchored indicator that resets,
but we are using a steady version over a selectable period of candles.
TTM: Takes the TTM squeeze indicator into effect for trigger condition with user selectable chart timeframe, length, multiplier, smoothing and trend direction.
The TTM is used to identify when to enter or exit a market for the best chance of profitability. It squeezes pairs well with other indicators, such as the ADX indicator.
For Multiplicator you can use Keltner and Boilinger Bands.
ADX: Takes the "Average Directional Movement Index" into effect for trigger condition with user selectable chart timeframe, smoothing, DI-length, a long and a short setting.
The ADX is used to detect trend direction with a positive and a negative direction indicator (+DI & -DI). The factor of those is a value between 0 and 100.
A low value can be a week trend or consolidation. A value > 25 is considered as a positive trend, >50 is a strong long trend >75 extremely strong trend.
Beside timeframe, you can choose smoothing and DI length.
SuperTrend: Takes the SuperTrend into effect for filtering with user selectable chart timeframe, ATR length and factor.
As an alternative to moving averages you can keep a fix distance to determine long or short trend.
That way you can avoid a lot of switching during a consolidation phase. Once crossed it switches trend direction.
The "Average True Rage" is used for calculation of the SuperTrend distance, it measures the volatility of the coin.
MFI: Takes the "Money Flow Index" into effect for filtering with user selectable chart timeframe, length, source, long and short settings.
The MFI is a technical oscillator that uses price and volume data for identifying overbought or oversold signals in an asset.
It can also be used to spot divergences which warn of a trend change in price. Like RSI this oscillator moves between 0 and 100.
MFI > 80 is considered overbought and an MFI < 20 is considered oversold.
W-Divergence: Takes the "Wolfpack Divergence" into effect for trigger condition with user selectable chart timeframe, length, lookback, divergence and ranges.
W-Divergence is MACD 3-8 setting with added divergence hunter.
How to use: Select the VWAP, and set the VWAP up as you would normally trade with your selected timeframe, period, and VWAP settings (long and short).
All entries will be shown, based on the VWAP settings.
From here, filtering can be implemented to produce better entries, ie using EMA/MACD/RSI/SuperTrend/MFI filtering.
Happy Trading!
