True Volatility IndicatorThis indicator measures non-directional volatility. Hope somebody will find use in this true volatility indicator.
Feel free to change and use it.
Shout out to ALT PACINO (@BitBayCoin on Twitter) & @philipvdlinde for inspiring me
**Chart irrelevant**
Поиск скриптов по запросу "Volatility"

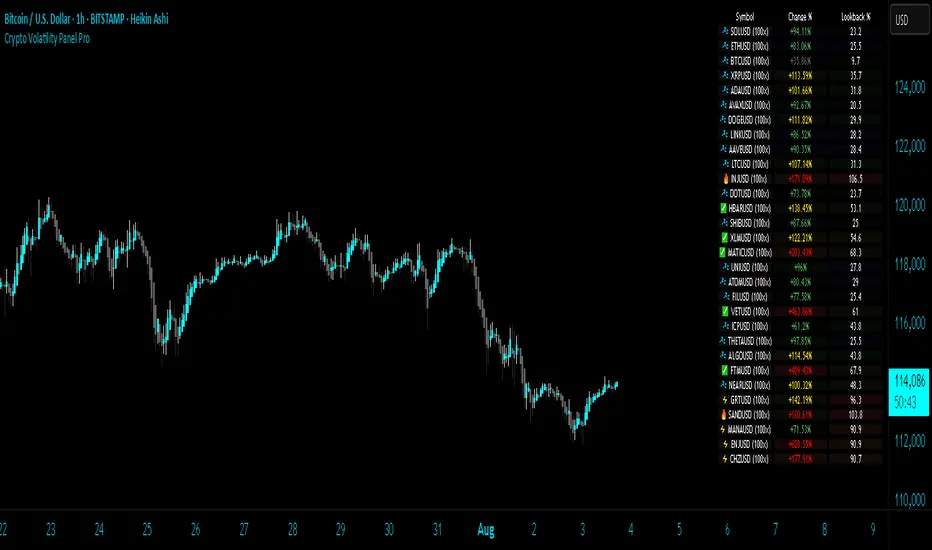
Crypto Volatility Panel ProCrypto Volatility Panel Pro
This advanced indicator creates a comprehensive volatility monitoring dashboard that displays real-time volatility metrics for up to 30 cryptocurrency pairs simultaneously. The tool combines sophisticated volatility assessment techniques with leverage-adjusted analysis and heat map visualization to provide enhanced market insights in an organized table format.
Proprietary Methodology
This indicator utilizes a proprietary dual-metric volatility assessment system developed specifically for cryptocurrency market analysis. The methodology combines advanced technical analysis components including price volatility measurements, range position analysis, and leverage scaling algorithms optimized through extensive market testing.
The unique approach enables more accurate volatility assessments across diverse cryptocurrency price ranges and market conditions compared to standard volatility indicators. Specific calculation methods and optimization parameters remain proprietary to maintain competitive advantages.
Core Functionality and Innovation
Unlike standard volatility indicators that focus on single instruments, this tool provides simultaneous multi-asset monitoring with proprietary volatility calculations specifically optimized for cryptocurrency markets. The innovation lies in combining multiple volatility assessment techniques with enhanced leverage scaling algorithms, heat map ranking system, and comprehensive multi-asset dashboard presentation.
The indicator processes data from up to 30 different cryptocurrency pairs, each with independent leverage settings ranging from 0.1x to 10,000x. Users can apply universal leverage across all pairs for consistent analysis scenarios, or customize individual leverage ratios for specific trading strategies.
Visual Organization and Heat Map System
The table displays three primary columns with an advanced heat map ranking system:
Symbol Column: Shows cryptocurrency pair names with dynamic visual indicators (🔥, ⚡, ✅, 💤) representing volatility intensity levels. Each symbol includes its current leverage setting in parentheses for reference. Invalid or unavailable symbols display error indicators (❌) with appropriate error messaging.
Change Percentage Column: Displays leverage-adjusted volatility measurements with both color-coded text and heat map background ranking. Text colors indicate volatility levels (Red for extreme, Yellow for high, Green for moderate, Gray for low), while background heat map colors rank performance relative to all monitored pairs.
Lookback Percentage Column: Shows leverage-adjusted position analysis within recent price ranges with heat map background ranking, indicating market positioning relative to recent highs and lows across all monitored instruments.
Advanced Heat Map Ranking
The proprietary heat map system ranks all enabled pairs in real-time based on their volatility metrics, providing instant visual identification of the most and least volatile instruments:
Hottest (Top 10%): Deep red background indicating highest volatility
Warm (10-20%): Orange-red background for elevated volatility
Medium (20-40%): Yellow background for moderate-high volatility
Cool (40-60%): Green background for moderate volatility
Cold (60-80%): Blue background for low volatility
Sleepy (Bottom 20%): Dark background for minimal volatility
Heat map opacity is fully customizable, and the system can be disabled for users preferring traditional static backgrounds.
Configuration Options
Expanded Pair Selection: Monitor up to 30 cryptocurrency pairs across major exchanges including Bitstamp and Binance. Default selections include established cryptocurrencies (BTC, ETH, SOL) and emerging assets (INJ, NEAR, FTM), with full customization available.
Table Positioning: Nine position options including top/middle/bottom combinations with left/center/right alignment, allowing optimal placement on any chart layout without interfering with price action or other indicators.
Visual Customization: Comprehensive control over table dimensions, frame width, font size, background colors, frame colors, header styling, text colors, and heat map color schemes to match user preferences and chart themes.
Leverage Management: Individual leverage settings for each of the 30 pairs, with optional universal leverage mode that applies consistent multipliers across all enabled pairs. Supports extreme leverage ranges up to 10,000x for advanced risk modelling.
Error Handling: Robust symbol validation with clear error indicators for invalid, unavailable, or misconfigured trading pairs, ensuring reliable operation across different market conditions.
Practical Trading Applications
Multi-Asset Volatility Screening: Identify the most and least volatile cryptocurrency markets in real-time using the heat map ranking system, enabling quick allocation of attention to instruments with the highest potential for profitable moves.
Leverage Risk Assessment: Visualize how different leverage ratios amplify volatility metrics across multiple markets simultaneously, supporting informed position sizing decisions before entering leveraged trades.
Market Timing and Rotation: Use the combination of volatility measurements and heat map rankings to identify optimal entry/exit timing across cryptocurrency markets, facilitating effective portfolio rotation strategies.
Portfolio Diversification: Compare volatility levels and rankings across 30 cryptocurrencies to construct portfolios with desired risk characteristics, balancing high-volatility growth opportunities with stable store-of-value positions.
Risk Management Dashboard: Monitor real-time volatility changes and relative rankings to adjust position sizes, implement protective measures, or reallocate capital when market conditions change significantly.
Technical Implementation
Built using Pine Script v5 with optimized security request handling to minimize performance impact while accessing 30 external data sources simultaneously. The indicator uses efficient array-based data collection, real-time ranking algorithms, and conditional table updates to maintain smooth chart operation.
The heat map system employs dynamic ranking calculations that process all enabled pairs in real-time, sorting values and applying percentile-based color mapping for instant visual feedback. Error handling includes invalid symbol detection and graceful fallback display for unavailable data feeds.
Usage Instructions
Configure Pair Selection: Enable desired cryptocurrency pairs from the 30 available options, organized across three input groups for easy navigation. Set individual leverage values or activate universal leverage mode for consistent multipliers.
Customize Heat Map: Adjust heat map colors and opacity to match your visual preferences and chart theme. The system can be disabled for users preferring static backgrounds.
Position and Style Table: Select optimal table position from nine available options and customize appearance including colors, sizing, and text elements to integrate seamlessly with your trading setup.
Interpret Rankings: Monitor both absolute values and heat map rankings to identify relative performance.
Hottest colors indicate pairs experiencing the highest volatility relative to the monitored universe.
Apply Leverage Context: Use leverage-adjusted values to understand how volatility would affect leveraged positions, remembering these are mathematical projections designed for risk assessment rather than trading signals.
Advanced Features
Dynamic Symbol Processing: The indicator automatically handles symbol validation, displaying clear error messages for invalid or unavailable trading pairs while maintaining operation for valid symbols.
Real-Time Ranking: Heat map colors update dynamically as market conditions change, providing instant visual feedback on shifting volatility patterns across the cryptocurrency universe.
Scalable Monitoring: Users can monitor anywhere from a few key pairs to the full 30-pair universe, with the ranking system automatically adjusting to the number of enabled instruments.
Cross-Exchange Support: Incorporates data from multiple cryptocurrency exchanges to provide comprehensive market coverage and reduce single-source dependency risks.
Limitations and Important Considerations
Proprietary Algorithm: The specific calculation methods are proprietary and not disclosed. Users should evaluate the indicator's output through their own analysis and testing before incorporating it into trading decisions.
Complex Volatility Model: While the proprietary methodology is sophisticated, it represents one approach to volatility assessment and may not capture all forms of market volatility such as gap movements, flash crashes, or news-driven events.
Performance Considerations: Processing data from up to 30 external securities may impact chart loading speed or cause timeouts during periods of high TradingView server load. Users experiencing performance issues should consider reducing the number of enabled pairs.
Leverage Calculations: Leverage adjustments are mathematical projections that assume linear scaling, which may not reflect actual leveraged trading mechanics including margin requirements, funding costs, liquidation risks, and exchange-specific policies.
Market Data Dependencies: Cryptocurrency prices and volatility can vary significantly between exchanges. The indicator's data sources may not represent the specific exchange or trading pair you use, and some feeds may experience gaps or delays during maintenance periods.
Ranking Relativity: Heat map rankings are relative to the enabled pair universe. Rankings will change based on which pairs are monitored and their current market conditions, making absolute interpretations less meaningful than relative comparisons.
Educational Value
This indicator helps traders develop understanding of relative volatility patterns across cryptocurrency markets and the mathematical impact of leverage on risk metrics. The heat map system provides intuitive visualization of market dynamics, helping users identify which assets are experiencing unusual activity relative to their peers.
The tool serves as an educational platform for understanding advanced volatility measurement techniques, relative ranking systems, and multi-asset risk assessment concepts that are crucial for professional cryptocurrency trading and portfolio management.
Performance and Compatibility
The indicator is optimized for cryptocurrency markets but can be adapted to other volatile asset classes by modifying the symbol inputs. Security request limits may occasionally affect data availability, particularly when multiple indicators requesting external data are used simultaneously on the same chart.
The heat map rendering system is designed for efficiency, updating color mappings only when ranking changes occur rather than on every price tick, ensuring smooth chart performance even when monitoring the full 30-pair universe.
Risk Disclaimer: This indicator is designed for educational and analytical purposes only. Volatility calculations are estimates based on historical price data and proprietary mathematical models that are not disclosed. Results do not constitute trading advice or predictions of future price movements. Users should conduct independent analysis to evaluate the indicator's effectiveness before making trading decisions.
Leveraged trading involves substantial risk of loss and may not be suitable for all investors. Always conduct thorough research and consider consulting with qualified financial professionals before making leveraged trading decisions. Cryptocurrency markets are highly volatile and can result in significant losses. Past volatility patterns do not guarantee future market behavior.
This indicator is compatible with all TradingView chart types and timeframes. It is specifically designed for cryptocurrency markets using proprietary algorithms optimized for digital asset volatility characteristics.
TSIM Volatility Weather ModelThe Volatility Weather Model is an indicator that delivers a unified "weather report" on market volatility by averaging 10 specialized estimators into actionable insights. It helps traders gauge price swing intensity, anticipate regime shifts, and align strategies with current market conditions—turning volatile environments into opportunities rather than hazards.
How Traders Can Use This Indicator
Focus on volatility as a leading signal for risk and opportunity:
- Spotting Expansions and Compressions: High readings (>70% or Z>1) indicate expanding volatility—ideal for breakouts or trend-following in active regimes, but scale back positions to avoid whipsaws in ranging ones. Low readings (<30% or Z<-1) signal compression; accumulate positions gradually, as these often precede explosive moves (e.g., enter calls/puts pre-earnings when the dashboard predicts "major breakout setup").
- Risk Management: Rely on the risk filter and behavioral alerts to adjust sizing—cut leverage in "high risk" phases (e.g., implement trailing stops at 1-2% risk per trade) and increase it in "low risk" for higher conviction setups. The cycle behavior helps time cycles: "Late expansion" warns of reversals, prompting profit-taking.
- Regime-Based Strategies: In trending regimes (fast EMA > slow), use high volatility for momentum trades (e.g., buy dips on pullbacks with tight stops). In cash regimes, exploit mean reversion—short extremes when the expected behavior flags "volatility mean reversion likely imminent."
- Multi-Timeframe Application: Day traders: Short lookbacks (20-40 bars) for intraday swings, watching bar colors for quick entries/exits. Swing traders: Longer periods (50-200) to filter noise, combining with support/resistance. For portfolios, scan multiple assets; if averages cluster high, hedge overall exposure.
- Scenario Examples:
- Bull Market Rally: If structure behavior shows "Trending with expanding volatility," add to winners but watch for "extreme" statuses signaling pullback risks.
- Sideways Consolidation: Low volatility + ranging regime = patience mode; use "deep compression" alerts to position for volatility spikes.
- News/Event Trading: Pre-event, low readings build setups; post-event, monitor averages—if Z>1.5, fade overreactions per the predictive insights.
Key Features for Practical Use
- Dual Display Modes (Normalized or Z-Score): Switch between percentile rankings (0-100%) for quick intensity checks or standard deviation scores for spotting statistical extremes. Use Normalized for broad overviews (e.g., 80% signals "hot" markets) and Z-Score for precise deviation alerts (e.g., +2σ warns of overextension).
- Average Line and Regime Filters: The core trend line shows consensus volatility; overlay fast/slow EMAs to identify "ACTIVE" (trending, above slow EMA) vs. "CASH" (ranging, below). Risk flags color bars/backgrounds (purple for high risk, aqua for low) to signal when to dial up or down exposure.
- Dashboard Table: A customizable table (position/size adjustable) lists individual estimators with statuses (e.g., "Extreme," "Low") and five behavioral summaries: Volatility Phase, Structure, Risk, Cycle, and Expected Behavior. These narratives provide instant guidance, like "High risk phase—reduce exposure" or "Breakout setup developing."
- Visual Alerts: Gradient fills, reference lines (e.g., 50% midline, ±1σ), and optional plots highlight thresholds. Toggle smoothing and line widths for cleaner charts in real-time trading.

Mutant Cycle - Volatility DriverMutant Cycle – Volatility Driver
The Mutant Cycle Volatility Driver is a custom market analysis tool designed to map out key volatility levels for the trading week using a Fibonacci-based logic. By applying a cyclical approach, it highlights potential zones where significant price reactions may occur, helping traders anticipate market rhythm and volatility spikes.
While the indicator already provides accurate weekly volatility zones, the detection of strong swing highs and lows is still under refinement. In its current form, it works best as a volatility map and context filter — guiding entries, exits, and risk management in alignment with the week’s expected market dynamics.

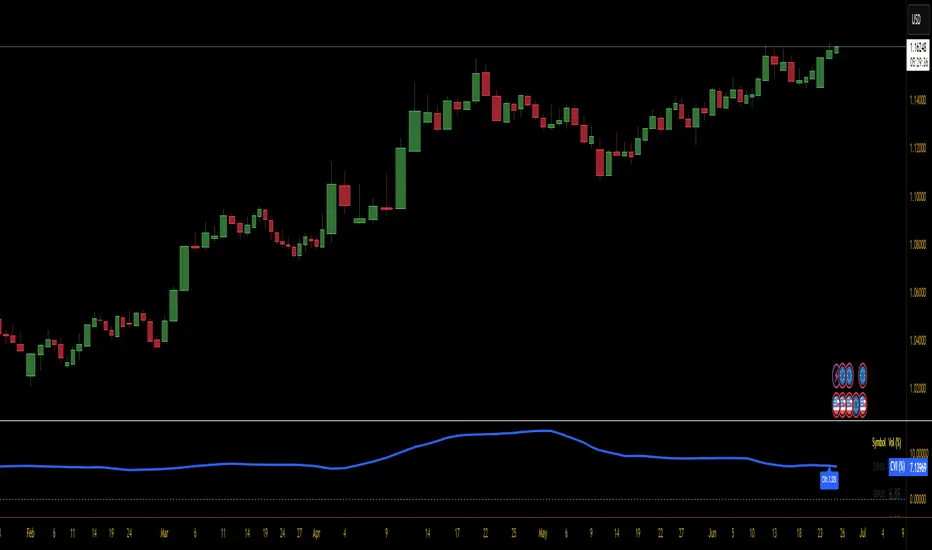
Currency Volatility Index (CVI)This Currency Volatility Index (CVI) indicator aggregates the realized volatility of the eight “major” FX pairs into a single, tradable series—much like an FX-version of the VIX. Here’s what it does step by step:
Inputs & Settings
• Volatility Length (default 20 days): the lookback over which daily log-returns’ standard deviation is computed.
• Data Timeframe (default Daily): the resolution at which price data is fetched for each pair.
• Smoothing Length (default 5): the period of a simple moving average applied to the raw, averaged volatility (in %).
Pair-by-Pair Volatility Calculation
For each hard-coded symbol (EURUSD, GBPUSD, USDJPY, USDCHF, AUDUSD, USDCAD, NZDUSD, EURGBP):
Pull the series of daily closes.
Compute the series of log-returns: ln(today’s close / yesterday’s close).
Calculate the standard deviation of those log-returns over your lookback.
Annualize it (×√252) to convert daily volatility into an annualized figure.
Aggregation
The eight annualized volatilities are averaged (equal weights).
The resulting number is then multiplied by 100 to express it as a percentage.
Smoothing & Plotting
A simple moving average over the aggregated volatility smooths out spikes.
The smoothed CVI (%) is plotted as a standalone line below price charts.
Visualization Aids
A small table in the top-right corner shows each pair’s current volatility in percent.
A dynamic label on the final bar prints the latest CVI value directly on the chart.
Why use it?
Gives a one-stop measure of overall FX market turbulence.
Helps you compare “quiet” vs. “volatile” regimes across currencies.
Dynamic Volatility Heatmap (ATR)How the Script Works
Dynamic Thresholds:
atrLow and atrHigh are calculated as percentiles (20% and 80% by default) of ATR values over the last double the ATR period (28 days if ATR is 14).
This creates thresholds that adapt to recent market conditions.
Background Heatmap:
Green: ATR is below the low threshold, indicating calm markets (options are cheap).
Red: ATR is above the high threshold, signaling elevated volatility (options are expensive).
Yellow: ATR is within the normal range, showing neutral market conditions.
Overlay Lines:
]Dynamic lines for atrLow and atrHigh help visualize thresholds on the chart.
Interpretation for Trading
Green Zone (Low ATR):
Interpretation: The market is calm, and options are likely underpriced.
Trade Setup: Favor buying options (e.g., long straddles or long calls/puts) to profit from potential volatility increases.
Red Zone (High ATR):
Interpretation: The market is volatile, and options are likely overpriced.
Trade Setup: Favor selling options (e.g., credit spreads or iron condors) to benefit from volatility decay.
Yellow Zone (Neutral ATR):
Interpretation: Volatility is within typical levels, offering no strong signal.
Trade Setup: Combine with other indicators, such as gamma levels or Bollinger Bands, for confirmation.
5. Enhancing with Other Indicators
Combine with Bollinger Bands:
Overlay Bollinger Bands to identify price extremes and align them with volatility heatmap signals.

Weighted VolatilityIntroducing the "Weighted Volatility" indicator, a powerful tool that incorporates the PeacefulIndicators library to measure the price volatility and volume in the market. This indicator is designed to help you detect potential opportunities and enhance your trading analysis.
The Weighted Volatility indicator offers the following features:
Adjustable input parameters, allowing you to modify the source (close by default) and the length parameter to suit your trading style and preferences.
A visually clear display, with the Weighted Volatility line in blue and a horizontal line at zero, making it easy to interpret the indicator's signals.
The core functionality of the Weighted Volatility indicator is powered by the weighted_volatility_oscillator function from the PeacefulIndicators library, ensuring accurate and reliable results.
To start using the Weighted Volatility indicator in your trading analysis, simply add the script to your chart and customize the input parameters as needed. We hope this script, built upon the PeacefulIndicators library, proves to be a valuable addition to your trading strategy.

[A618] Historical Volatility Bands
Historical Volatility Bands
To be used over 5 mins for best results
HVB is a standard deviation measure for Historical Volatility Percentile,
It helps you figure out the next level of Support and Resistances
> If the HVB width is narrow, its an indication for a Trending market day
> Price crossing the highest green band line symbolises a nice upmove
> Price crossing the lowest red band line symbolises a nice downmove
> Green and Red lines are levels of Support and Resistances with respect to Historical Volatility
Credits
Historical Volatility Percentile calculation part : @cheatcountry
Link to cheatcountry idea
Hope this Helps!

Relative Percentile Volatility by UnelmaThe indicator estimates a smoothed volatility and plot it against volatility from the lookback period. This results in a relative volatility measures.
Readings above 50 indicate high volatility with respect to lookback period, viceversa below 50.
It may be very useful in a trading system to spot high/low volatility periods.
The signal is smoothed using Sine/Cosine waving method, it s not a sma.
The comparison is done using a quantile approach.
UnCheck the percentile option to have a percentage volatility measure. I suggest a look-back of 60 days.

[FRK] Volatility-Adjusted Mean Reversion 🎯 What It Does :
- Spots when price has moved "too far" from average
- Adjusts for how jumpy/calm the market is right now
- Gives you better signals than simple oscillators
⚙️ Every Setting Explained:
- MA Length (9): How many bars for the "center line"
- Volatility Length (20): How many bars to measure "jumpiness"
- Threshold (0.04): When to actually signal you
- Price Input (Close): Which price to use
- MA Type (SMA): How to calculate the average
- Vol Multiplier (10.0): Just visual scaling
📊 Visual Guide:
- Blue line above red dotted = Price too high, expect drop
- Blue line below green dotted = Price too low, expect bounce
- Background colors = Active signals
- Table = Current stats and history
🧮 Simple Formula:
Signal = (Price - Average) ÷ Average ÷ (Volatility × 10)
When Signal > 0.04 or < -0.04 → Trade signal!
// ⚠️ IMPORTANT TRADING WARNING:
// DO NOT TRADE ON THIS SIGNAL ALONE! This is a confluence tool that helps you:
// • Understand current volatility vs historical levels
// • Get a "feel" for how extended current price moves are
// • Confirm other trading setups with volatility context
// • See when market is unusually calm or wild

High Volatility and Big Price Change ScannerThis Pine Script scans for high volatility and significant price changes on the chart. It uses Average True Range (ATR) to measure volatility and calculates the percentage change in price over a specified lookback period. When both conditions—high volatility (ATR above a threshold) and a significant price change (greater than the set percentage threshold)—are met, a signal is plotted below the bar. Additionally, an alert condition is included for notifications when these conditions are satisfied.
This script is useful for identifying stocks with large price movements and increased volatility, which may indicate potential trading opportunities.
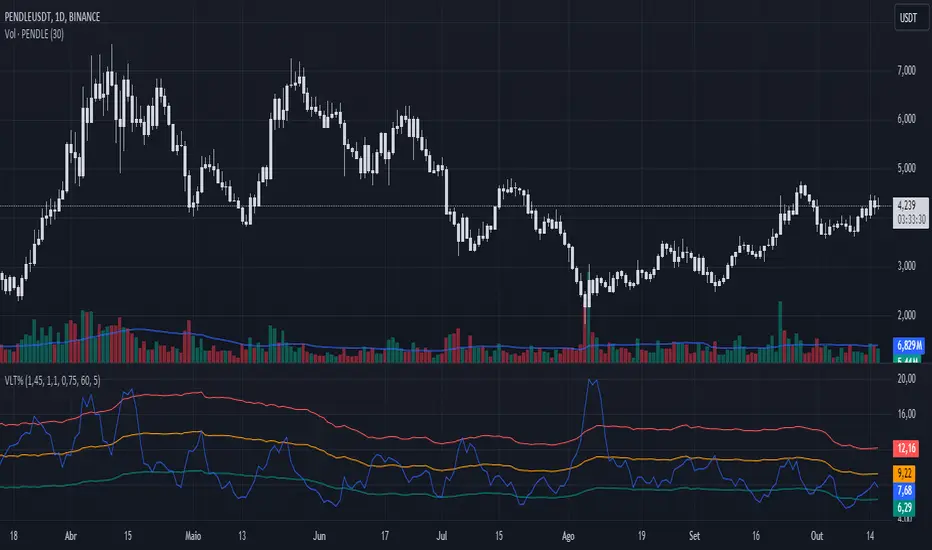
Volatility %This indicator compares the average range of candles over a long period with the average range of a short period (which can be defined according to whether the strategy is more long-term or short-term), thus allowing the measurement of the asset's volatility or the strength of the movement. It was also created to be used on the 1D time frame with Swing Trading.
This indicator does not aim to predict the direction or strength of the next movement, but seeks to indicate whether the asset's value is moving more or less than the average. Based on the principle of alternation, after a large movement, there will likely be a short movement, and after a short movement, there will likely be a long one. Therefore, phases with less movement can be a good time to position oneself, and if volatility starts to decrease and the target has not been reached, closing the position can be considered.
This indicator also comes with three bands of percentage volatility averages altered by a multiplier, allowing for a dynamic reading of how volatile the market is. These should be adapted according to the asset.
This indicator is not meant to be used alone but as an auxiliary indicator.
Local VolatilityThe traditional calculation of volatility involves computing the standard deviation of returns,
which is based on the mean return. However, when the asset price exhibits a trending behavior,
the mean return could be significantly different from zero, and changing the length of the time
window used for the calculation could result in artificially high volatility values. This is because
more returns would be further away from the mean, leading to a larger sum of squared deviations.
To address this issue, our Local Volatility measure computes the standard deviation of the
differences between consecutive asset prices, rather than their returns. This provides a measure of
how much the price changes from one tick to the next, irrespective of the overall trend.
~ arxiv.org

MAX4 Ord. Volatility Market ScannerScan volatility of for NEW 15 coin listed on binance futures , print result in label ordered form higher or lower volatility Use it in combination with MAX2 Ord. Volatility Market and MAX1 Ord. Volatility Market Scanner to have all binance futures coin scan

MAX3 Ord. Volatility Market ScannerScan volatility of for last 29 coin on binance futures, print result in label ordered form higher or lower volatility Use it in combination with MAX2 Ord. Volatility Market and MAX1 Ord. Volatility Market Scanner to have all binance futures coin scan

MAX2 Ord. Volatility Market ScannerScan volatility of 40 pair, print result in label ordered form higher or lower volatility
Use it in combination with MAX1 Ord. Volatility Market Scanner for have 80 coin scan

MAX1 Ord. Volatility Market ScannerScan volatility of 40 pair, print result in label ordered form higher or lower volatility
Use it in combination with MAX2 Ord. Volatility Market Scanner for have 80 coin scan

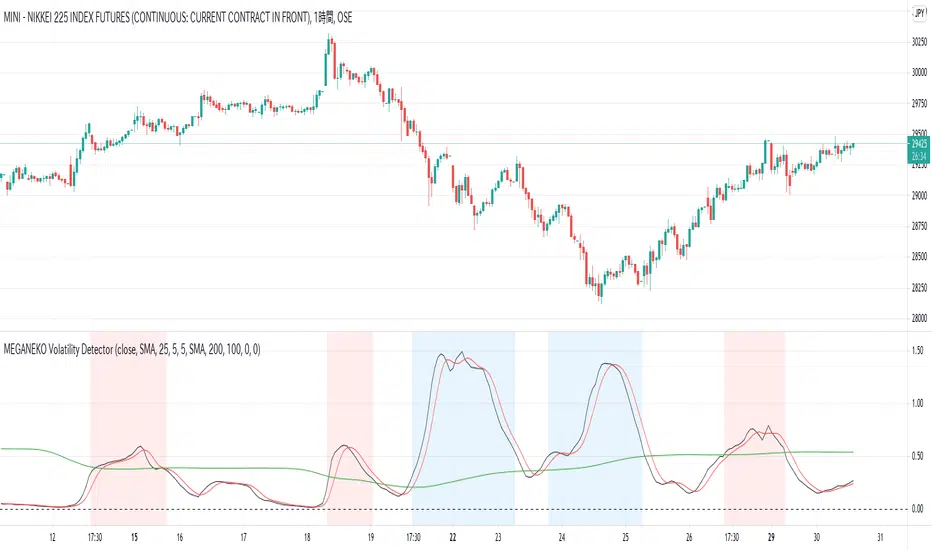
MEGANEKO Volatility DetectorThis Indicator immediately shows you the Volatility Rising and Declining.
It is configured of:
-Volatility line ( made of dmi, adx, standard-deviation, ,any type of ma, and others )
-Smoothing line (sma of Volatility Line, assuming the crossing signal)
-Basement line (any type of ma of Volatility Line, assuming using very-long-period)
also added alerts.
this is INVITATIONAL~ONLY.
Annual VolatilityScript measuring realized annual volatility based on month window.
White line - annual realized volatility based in 21 days ( classic month window )
Green peak - annual realized volatility for number of days in previous month
You can chose your target volatility and script will show you a required weight
for risk assets in your portfolio.

Exponential Volatility IndexA volatility indicator with respect to a period of the past. A value of 50.0 indicates average volatility with respect to the period. A falling/increasing EVI (Exponential Volatility Index) indicates that the volatility is falling/increasing respectively to the period.

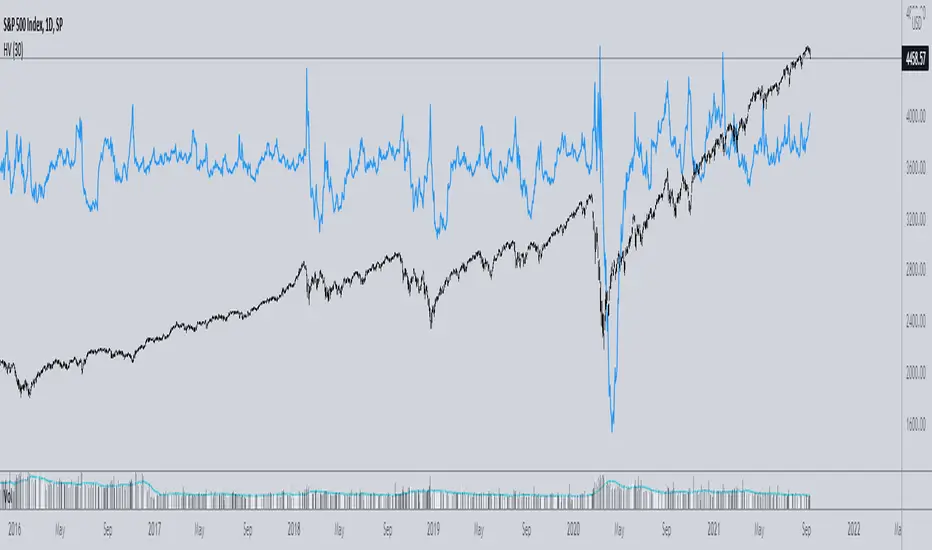
Implied minus Historical VolatilityJust a simple comparison of 30 day historical volatility versus 30 day implied volatility(VIX). In general, when VIX is way above realized or historical Vol, in general that is quite bullish. Backtest will be available soon.
Historical Volatility %Historical Volatility in % on 1 minute close of Deribit exchange candles.
Ability to set an alert for a given level of volatility .
PA Researcher Volatility for XBTUSDThis is PA Researcher Volatility Indicator for XBTUSD 1H Chart
Based on Volume Information
Appear Silver signal when volatility goes down
Ability to change color
Ability to change value of lowest line
It can also use on other altcoins
