Поиск скриптов по запросу "Volume"

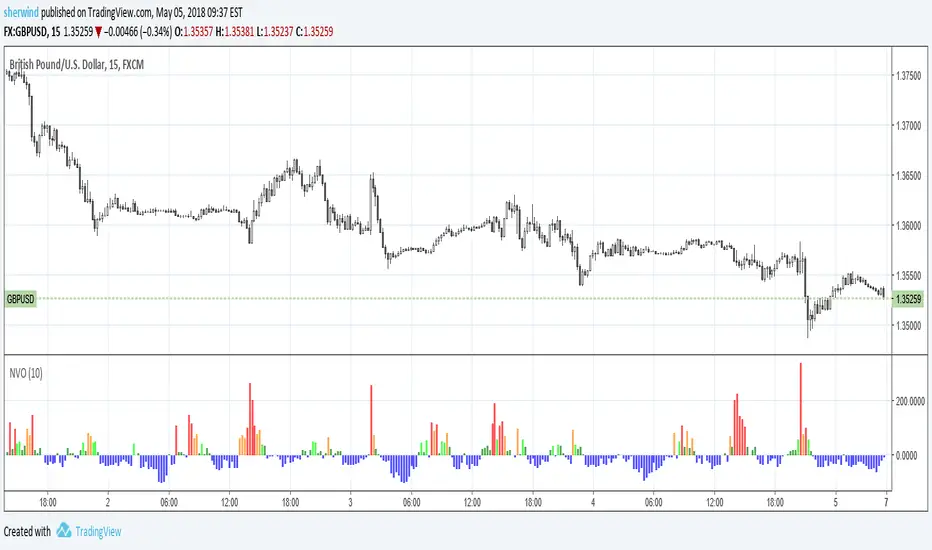
Normalized Volume OscillatorThis volume indicator works best on comparatively small timeframes (15 minutes, for example).
Based on:
- Normalized Volume Oscillator - indicator for MetaTrader 4
- Using Tick Volume in Forex: A Clear NVO Based Example
See also:
- Are price updates a good proxy for actual traded volume in FX?


Aggregated BTC Exchange VolumeAggregated raw volume from 7 exchanges:
Bitfinex
Binance
Bitstamp
Kraken
Coinbase
bitFlyer
Bithumb

Aggregate BTC Volume for VSAIt adds volume from most popular BTC/USD exchanges to reduce the noise in data.

BTC Volume IndexBTC volume index for all BFX, GDAX, Stamp, Kraken, and Bitflyer. Also includes an overlay of the volume of the underlying asset (assumed to be BTC at whichever exchange you're viewing.
Happii Trades


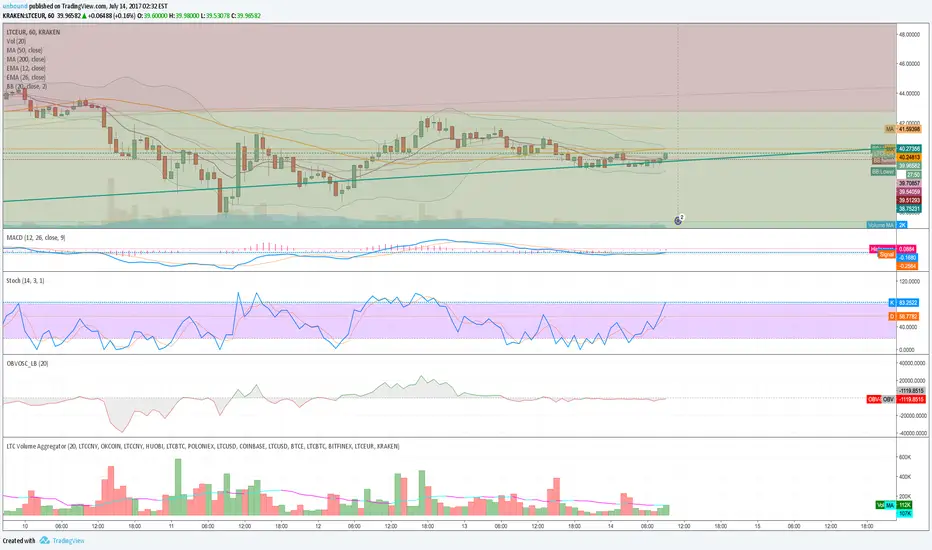
LTC Volume AggregatorThis script aggregates LTC volume from 7 major (with highest trading volume) LTC tickers available on tradingview.
Normalized Volume by MQNupe3This script adds a volume indicator that's normalized by SMA (10) by default. This will help you easily see whether the volume is actually high or not. It also highlights through volume is exceeding the average by making them column a brighter color.
This script was derived from Tradingview user: Vosechu . The original script came from the following: Normalized Volume by Vosechu. I just tweaked ths script so the volume bars do not float and I flipped the colors. He did all the hard work.

NIFTY IT volumeKEY TAKEAWAYS
-Uses NIFTY IT Index Stocks Volume .
-NIFTY IT Volume Indicator is created by adding all 10 NIFTY IT Stocks Volume together.
-NIFTY IT Volume will be an important indicator in NIFTY IT Index technical analysis because it is used to measure the relative significance of a market move.
-The higher the volume during a NIFTY IT index price move, the more significant the move and the lower the volume during a NIFTY IT index price move, the less significant the move.
-Moving Average is also added.

Average Volume at Time (AVAT)Calculation of average volume at current time for a number of previous sessions, known as Average Volume at Time (AVAT).
Inputs:
* period to use for accumulation. "D" is the default value, useful to view data for each session.
* number of previous sessions to average
TODO: more intelligent accumulation of number of bars in a session, since there may be sessions with different values
TODO: interpolate volume according to current time, inside of the last bar

Cumulative Volume v3The script, for Pine Script version 3, shows how to accumulate volume values during a defined session/period.
The input is the period to use for accumulation. "D" is the default value, useful to view data for each session.
This is slower than version 4 because there is no "var" and you need to use a loop. Also, you can't use "sum( volume , cnt_new_day)" with a variable length argument instead of "for".

Cumulative VolumeThe script shows how to accumulate volume values during a defined session/period.
The input is the period to use for accumulation. "D" is the default value, useful to view data for each session.

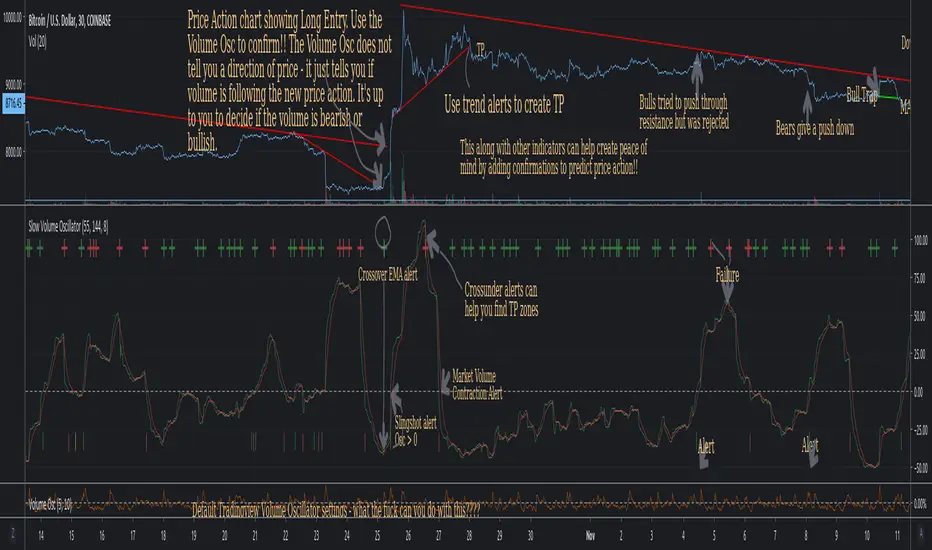
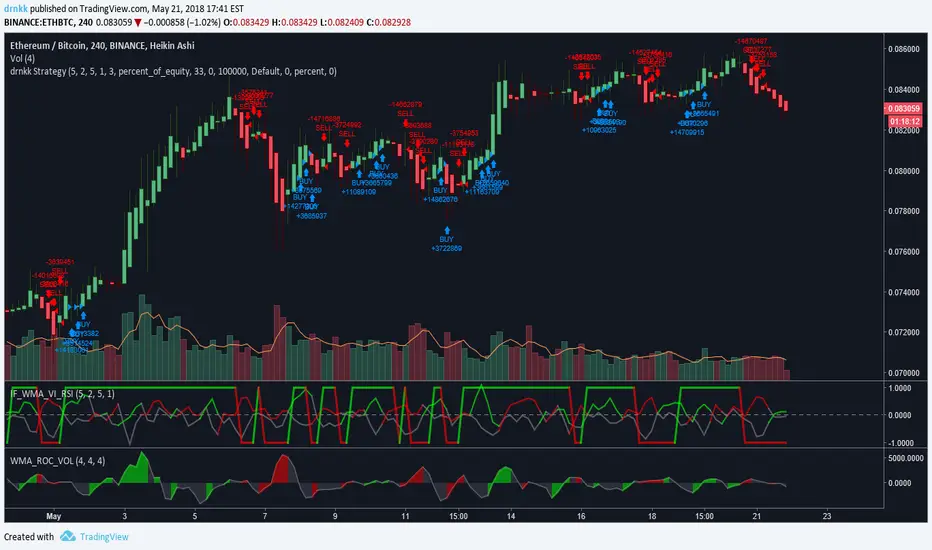
Slow Volume Oscillator Indicator - Just a Better Way To TradeThis script is nothing new. However, I feel that traders do not know the full potential it can provide if they just increase the lookback periods.
Tradingview's default Vol Osc uses a fast setting of 5 and a slow setting of 10. It just paints pointless scribbling. Slow all your indicators down and wake up to a whole new world of Technical Analysis.
To create consistency with variables I typically use Fib numbers for lookback periods. (3,5,8,13,21,34,55,89,144,233,377,610,987)
As noted in chart. An increase in volume can be either bullish or bearish. It's up to you to decide which way price action will move.
If you use with other indicators you can create more confirmations.
More confirmations = peace of mind
My favorite indicators are (Detrended Price Oscillator, Momentum, MACD, Chaikin Money Flow, Ultimate Oscillator, and this Volume Oscillator)
Here is just one example of MACD strategy indicator that can be used with this Vol Oscillator
[ST] BTC Volume Flow v4Update to volume flow script
optional colored candles, volume oscillator, strategy shapes

[ST] BTC Volume FlowEstimates volume up and down, colors separately. Units are in whatever price is in. I made it so I can get volume in btc for all pairs with btc.

SVA - Simple Volume Analyzer, by BlueJayBird [bjb] ENGLISH & SPANISH
------------------------------------- ENSLIGH
The idea was initially inspired in the concepts shared by @LazyBear on his indicator "Better Volume Indicator" (). But I found it somewhat complicated and dull. So I came up with this.
Concept:
It changes the color of volume bars based on surrounding volume changes.
Volume changes are plotted as volume MAs lines in the volume pane.
Whenever the volume is higher than these MAs, the bar changes color.
For this reason, the bar color change is RELATIVE TO the surroundings, because the color change depends on how far the MA has been extended due to sudden (or not) changes in the volume.
BAR COLORS:
Weak Green and Red: Low volume. The calm before or after the storm.
Normal Green and Red: Mid volume. Still low volume, you may get bored.
Yellow: High volume. Players are playing hard and harder.
White: Ultra-High Volume. The elephants stepped in.
NOTES:
SVA works better at lower timeframes. Though as far as I can tell, it works pretty well as far as 1D timeframe.
------------------------------------- SPANISH
La idea estuvo inicialmente inspirada en los conceptos expuestos por @LazyBear en su indicador "Better Volume Indicator" (). Pero lo encontré un poco complicado y falto de claridad. Así que me inventé este.
Conceptp:
Cambia el color de las barras basándose en los últimos cambios de volumen.
Los cambios de volumen son ploteados como lineas de medias móviles (MAs, es decir "Moving Averages") en la sección del volumen (chart pane).
En cualquier momento que el volumen es mayor que estos MAs, el color de las barras cambia.
Por esta razon, el cambio de color de las barras es RELATIVO a lo que está sucediendo alrededor, ya que el cambio de color depende de qué tan lejos el MA se haya extendido por causa de los últimos cambios (o no) de volumen.
BAR COLORS:
Verde y rojo apagados: Volumen bajo (Low Volume). La calma antes de la tormenta.
Verde y rojo normales: Volumen medio (Mid volume). Volumen todavía bajo. Es posible que te aburras.
Amarillo: Volumen alto (High Volume). Los jugadores están jugando duro.
Blanco: Volumen ultra-alto (Ultra-High Volume). Los elefantes entran a la cancha.
NOTAS:
SVA funciona mejor en temporalidades menores. Pero por lo que he visto, funciona bien hasta la temporalidad de 1D.

Multi-Layer Volume Profile [BigBeluga]A powerful multi-resolution volume analysis tool that stacks multiple profiles of historical trading activity to reveal true market structure.
This indicator breaks down total and delta volume distribution across time at four adjustable depths — enabling traders to spot major POCs, volume shelves, and zones of price acceptance or rejection with unmatched clarity.
🔵 KEY FEATURES
Multi-Layer Volume Profiles:
Up to 4 separate volume profiles are stacked on the chart:
- Profile 1: Full period
- Profile 2: Half-length
- Profile 3: Quarter-length
- Profile 4: One-eighth-length
This layering helps traders assess confluence across different time horizons.
Custom Bin Resolution:
Each profile uses a customizable number of bins to control visual precision.
More bins = higher granularity, fewer bins = smoother profile.
Precise POC Highlighting:
The price level with the maximum traded volume in each profile is highlighted with a thick blue POC line.
This key level shows the most accepted price for each period.
Total and Delta Volume Labels:
- Total Volume: Displays cumulative volume over the profile period at the top of the profile box.
- Delta Volume: The difference between bullish and bearish volume is labeled at the base, showing directional pressure.
Positive delta = buyer dominance, negative delta = seller dominance.
Range Levels:
Each profile includes horizontal reference lines showing its high, low, bounds.
These edges often align with price reaction zones and become future resistance/support.
🔵 HOW IT WORKS
For each active profile, the indicator:
- Collects price range (highs/lows) across the selected `length`
- Divides this range into equal bins
- Assigns volume into bins based on candle close location
- Aggregates volume per bin to form the profile (polylines)
Separately tracks:
- Total volume (sum of all candles in range)
- Delta volume (sum of candle volumes: positive for bullish, negative for bearish closes)
Highlights the bin with maximum volume (POC)
and marks it with a thick blue line.
Adds auxiliary lines for high/low of each profile box
and total/delta volume tags with tooltips.
🔵 USAGE
Spot Acceptance Zones:
Thick, flat areas on the profile show where price stayed longest — ideal for building positions.
Identify Rejection Zones:
Thin volume areas signal price rejection and are often used for stop placement or entries.
Delta Confirmation:
Use strong positive/negative delta readings as directional bias confirmation for breakout trades.
Confluence Detection:
Watch for overlapping POCs between layers to identify extremely strong support/resistance zones.
🔵 CONCLUSION
Multi-Layer Volume Profile equips traders with a deeply layered market structure view.
Whether you're scalping intraday levels or analyzing macro support zones, the ability to stack volume perspectives, visualize directional delta, and anchor POCs provides an edge in anticipating market moves.
Use this tool to validate entries, confirm structure, and make more informed, volume-aware trading decisions.

Multi-TF Volume & Price Analysis[BullByte]This indicator offers a comprehensive view of market dynamics by combining volume and price analysis across multiple timeframes. It calculates key metrics—such as bullish/bearish volume percentages, relative volume (RVol), cumulative volume delta (CVD), and price change percentages—for each timeframe that you choose (for example, 1, 3, 5, and 15 minutes). Here are the main features in simple terms:
- Multi-Timeframe Analysis:
The tool analyzes volume and price action from four different timeframes simultaneously. This means you get insights from short-term and slightly longer-term trends in one view.
- Volume Breakdown:
It splits the volume into bullish and bearish parts by comparing closing and opening prices. This helps you see how much of the trading volume is driving the market upward versus downward.
- Relative Volume & Spike Detection:
It calculates relative volume (current volume compared to a moving average) and flags any significant volume spikes based on a customizable multiplier. This feature helps identify unusual trading activity.
- Volume Smoothing Option:
For a cleaner signal, you can enable a smoothing option (using an exponential moving average) to reduce noise in the volume data.
- Advanced Summary:
The indicator combines volume data, price changes, and volume spikes to produce an overall market summary for each timeframe—labeling conditions as “Bullish Strong,” “Bullish Moderate,” “Bearish Strong,” “Bearish Moderate,” or “Neutral.”
- Cumulative Overview:
In addition to individual timeframe analysis, it aggregates the data to offer a cumulative view. This includes a collective bullish/bearish percentage, overall CVD, and even a simplified volume level (Low, Normal, or High).
- Customizable Dashboard:
All these metrics are neatly displayed in a dashboard on the chart. You can customize its position and text size. The dashboard uses dynamic, color-coded cells to instantly convey the market sentiment—making it easy to spot trends at a glance.
- VWAP Integration:
Finally, the dashboard includes VWAP information, providing an additional layer of context to the price action.
Overall, this indicator is designed to provide a quick yet thorough snapshot of market conditions, enabling traders to make more informed decisions with a clear visual representation of volume and price activity across different timeframes.
