Поиск скриптов по запросу "alert"

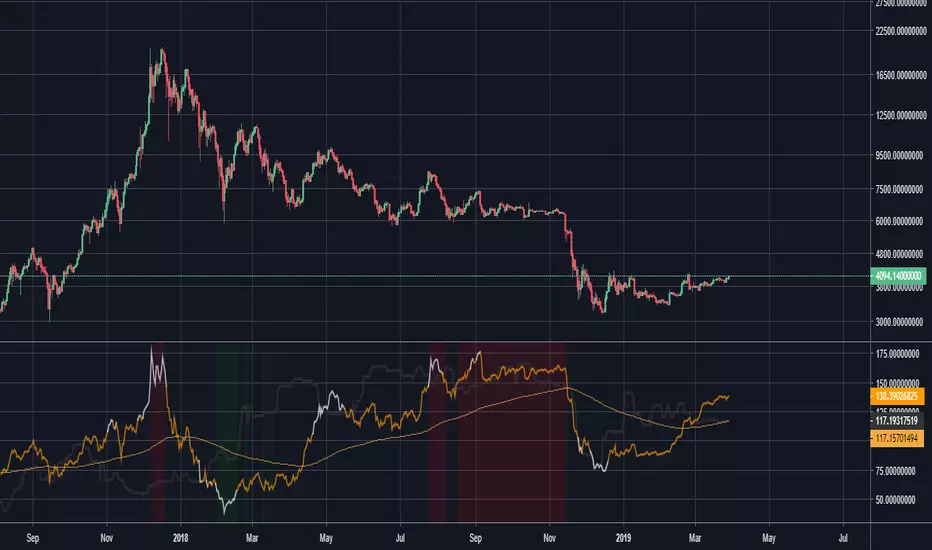
NVT Signal with RMA and thresholds [alertable]NVT Signal, or NVTS, is an indicator that compares the market cap of Bitcoin to the aggregate USD value of daily transactions on the Bitcoin blockchain. It is a value indicator that shows a multiple of Bitcoin price against the actual usage of its blockchain. When the NVTS is low, it suggests Bitcoin price is low relative to the amount of utility the network provides, and vice versa.
For more information on NVTS, visit medium.com
This indicator aims to provide the following:
1. An open-source implementation of NVTS on Tradingview, as the most popular one currently is closed-source.
2. To provide two simple ways to define and visualize "overbought" or "oversold" conditions using the NVTS. Here, we have absolute value of NVTS & deviation from a long-term moving average.
3. Crude integration into Tradingview's alert system.
What this indicator CANNOT do:
1. Timeframes below 1d.
2. Signals based on statistical analyses, such as seen in Bollinger Bands et al. (However, with the appropriate type of account, you can add BBands on top of this indicator.)
I would like to express my gratitude to Willy Woo, Chris Burniske and Dimitry Kalichkin for their work on NVT Ratio and NVT Signal, without which my indicator would not have been created.
Feel free to fork & improve, or experiment with settings. I hope this indicator will be useful to someone.
Divergences for many indicators v2.0A gift from me to all.
This script is developed to find Divergences for many indicators. it analyses divergences and then draws line on the graph. red for negatif, lime for positive divergences.
Currently script checks divergence for RSI, MACD, MACD Histogram, Stochastic, CCI, Momentum, OBV, Diosc, VWMACD and CMF indicators. You can use some or all of these indicators to check divergences as you wish by choosing them on the menu. Also you can add/remove many other indicators to the script to check if there is divergence.
The script first calculates tops/bottoms by using higher time frame zig zag and then finds divergences.
Higher Time Frames are
if currend period 1 min => HTF = 5 mins
if currend period 3 mins => HTF = 15 mins
if currend period 5 mins => HTF = 15 mins
if currend period 15 mins => HTF = 1 hour
if currend period 30 mins => HTF = 1 hour
if currend period 45 mins => HTF = 1 hour
if currend period 1 hour => HTF = 4 hours
if currend period 2 hours => HTF = 4 hours
if currend period 3 hours => HTF = 4 hours
if currend period 4 hours => HTF = 1 day
if currend period 1 day => HTF = 1 week
if currend period 1 week => HTF = 1 week
future plan : script finds regular divergences, soon I will add hidden divergences and also I plan to add alert ;)

Simple Moving Averages Alert Scriptcan set alerts on 3 moving averages (crossovers) , experiment with different moving average lengths in the input settings menu, there is also a toggle switch which turns off the 3rd moving average being used as a stop.
will add a backtesting version at some point
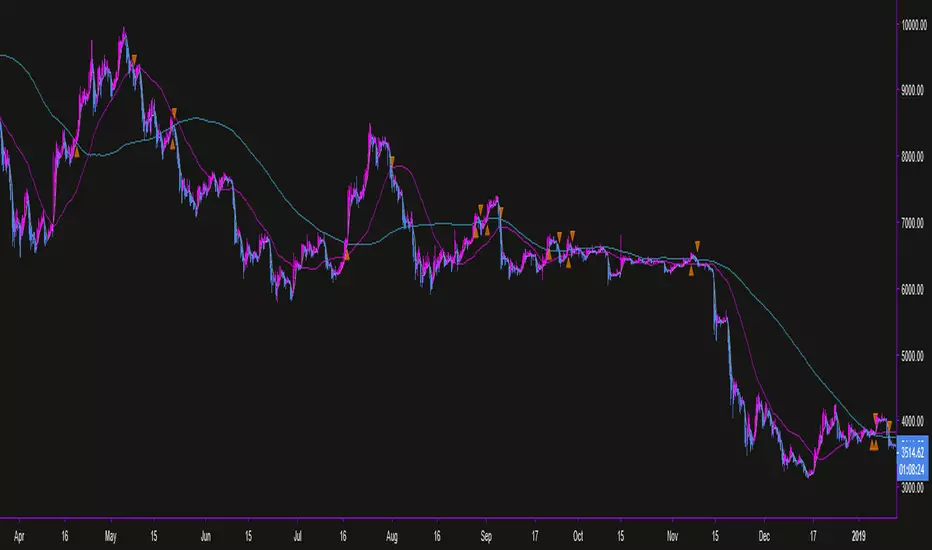
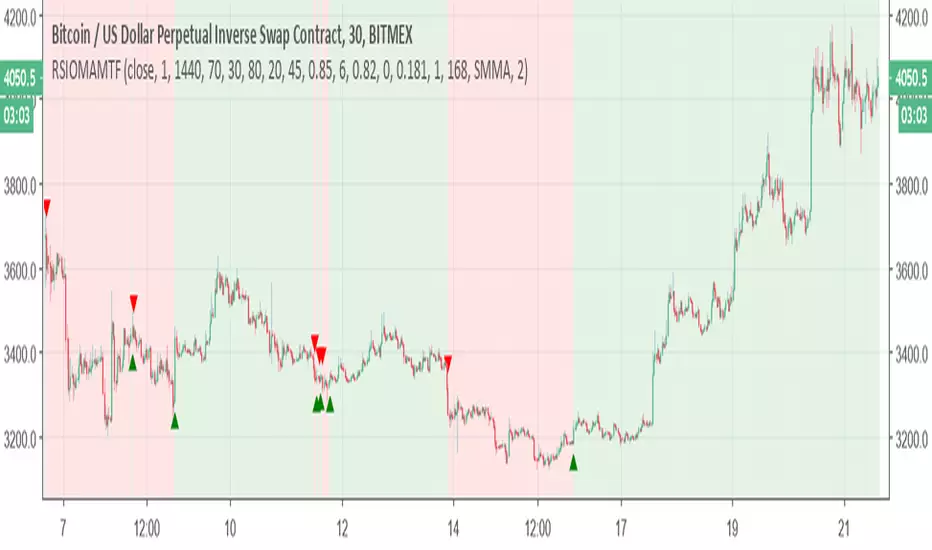
Relative Strength Index of Moving Average MTF alertsAll credit to this study is for chris jhoncic , this is MTF version with alert of his study
basic idea is hybrid of RSI and different MA
You can choose which MA from the following list:
Tillson Moving Average (T3)
Double Exponential Moving Average ( DEMA )
Arnaud Legoux Moving Average ( ALMA )
Least Squares Moving Average ( LSMA )
Simple Moving Average ( SMA )
Exponential Moving Average ( EMA )
Weighted Moving Average ( WMA )
Smoothed Moving Average ( SMMA )
Triple Exponential Moving Average ( TEMA )
Hull Moving Average ( HMA )
Adaptive moving average (AMA)
Fractal Adaptive Moving Average (FAMA)
Variable Index Dynamic Average ( VIDYA )
Triangular Moving Average (TRIMA)
to change the time frame change int2 to what you desire
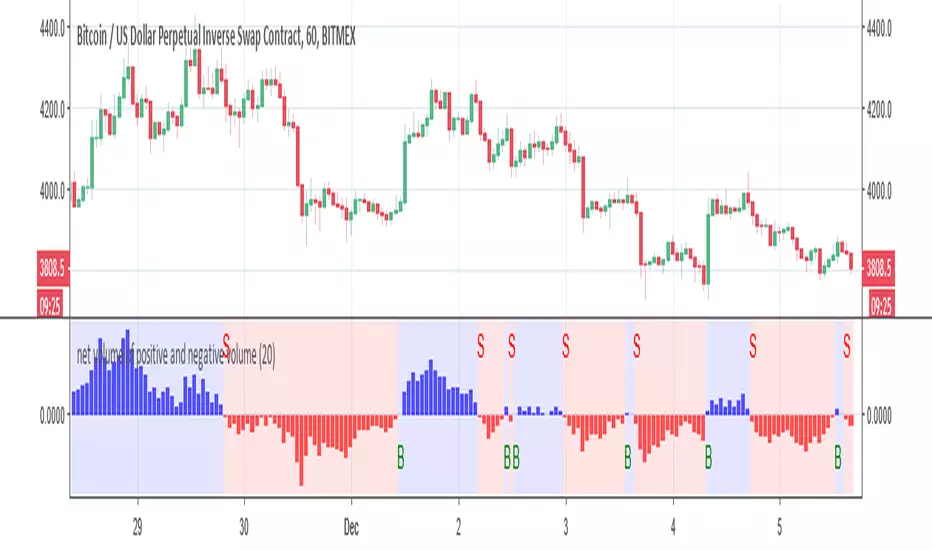
net volume of positive and negative volume buy and sell alertThis indicator try to give the mean number of bars in regarding to net volumes
This signal is produce by either cross up the 0 =buy or crossdown the 0 =sell
alerts inside
you can play with length to make optimization
[STRATEGY] MA Cross ElevenThis script is a crossing of eleven different MA, with alerts and SL and TP.
The simplest is what works best...
SMA --> Simple
EMA --> Exponential
WMA --> Weighted
VWMA --> Volume Weighted
SMMA --> Smoothed
DEMA --> Double Exponential
TEMA --> Triple Exponential
HMA --> Hull
TMA --> Triangular
SSMA --> SuperSmoother filter
ZEMA --> Zero Lag Exponential
Using "once per bar close" repaint is 0%, but if you like risk can choose "once per bar", better profit.
Thanks to JustUncleL and his amazing sripts.
Enjoy!
www.tradingview.com
"Note: When using non-standard (Renko, Kagi, Line Break, Point and Figure, Heikin Ashi, Spread Charts) types of chart as a basis for strategy, you need to realize that the result will be different. The orders will be executed at the prices of this chart (e.g.for Heikin Ashi it’ll take Heikin Ashi prices (the average ones) not the real market prices). Therefore we highly recommend you to use standard chart type for strategies."

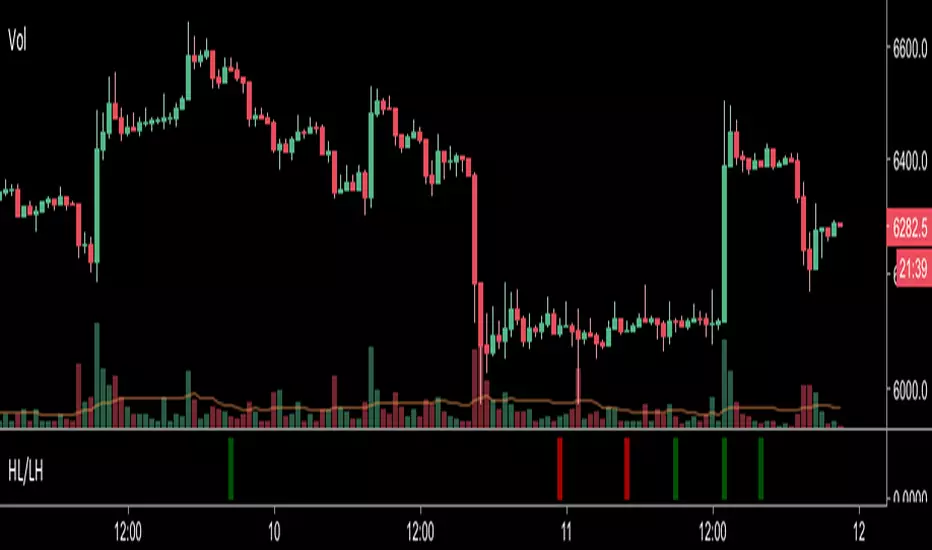
Higher Lows / Lower Highs AlertsSet an alert with this indicator for greater than 0.99 which will notify you of when a higher low or lower high is printed on the chart
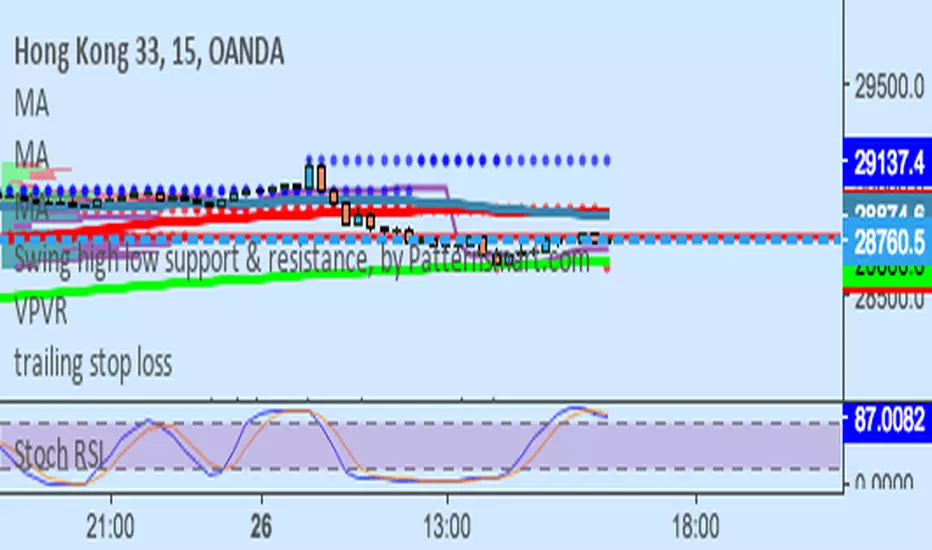
Stochastic RSI Alertscreate alert based on Stochastic RSI when k is greater than 80 or less than 20.

PIP COLLECTOR - REPAINT FIX w/ ALERTSThis fixes the repaint issue in LazyBear's Pip collector and adds alert capability. This strips away much of the original indicator, but it is a clear signal for longing and shorting, good to base off for live trading. As always, find a good entry and have an exit plan.

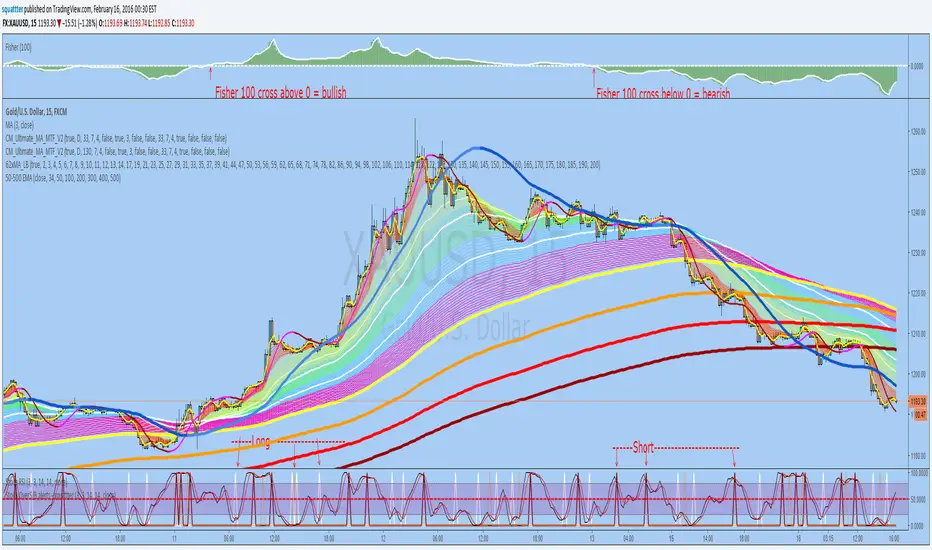
StochRSI overSold/Bought alerts - by squattterDepending on the new trend - Fisher 100 crossing 0;
Set an alert on each Long/Short "crossing down", 0.8 (or anything below 0.99), "on condition"
4All-Alerts Script for an easier setupThis is the alert script for
People have requested this so they can simply favorite and add it to a chart rather then cut and paste. That plus some of the code got converted to ticker data due to simply being in the description.
Happy Trading :)

teril Second Candle Cross Alert (Intrabar)teril Second Candle Cross Alert
teril Second Candle Cross Alert teril Second Candle Cross Alert teril Second Candle Cross Alert
teril Second Candle Cross Alert

Teril Second Candle Cross Alert (Intrabar)Teril Second Candle Cross Alert
Teril Second Candle Cross Alert
Teril Second Candle Cross Alert
Teril Second Candle Cross Alert

teril final Second Candle Cross Alert (Intrabar) before closeteril final Second Candle Cross Alert (Intrabar) before close
teril final Second Candle Cross Alert (Intrabar) before close
teril final Second Candle Cross Alert (Intrabar) before close
teril final Second Candle Cross Alert (Intrabar) before close

Terilsss Second Same Color Candle Break AlertSecond Same Color Candle Break Alert
Second Same Color Candle Break AlertSecond Same Color Candle Break Alert
Second Same Color Candle Break Alert
Second Same Color Candle Break Alert
Second Same Color Candle Break Alert

Baby ICT Simple Asia H/L + Sweeps + FVG + Alerts + Do-NothingBaby ICT Simple+ is a lightweight, rules-based TradingView indicator designed to help traders visualize key ICT-style concepts without complexity or signal-chasing. It focuses on Asia session liquidity, after, and fair value gapsto su
This tool is intentionally simple and is meant to be used alongside session timing, price action, and risk management — not as a buy/sell signal generator.
🔍 What This Indicator Displays
But
Automatically tracks and plots the Asia session high and low
Fully customizable line colors and width
These levels often act as liquidity pools before London and New York sessions
Liquidity Sweeps (Post-Asia)
Identifies the first time price takes liquidity above or below the Asia range
Sweep detection can be based on wicks or closes
Optional sweep labels help highlight potential stop-run behavior
Asia Break & Sweep Alerts
Alerts when price breaks the Asia high or low after the Asia session ends
Optional alerts for the first sweep only, helping traders focus on high-quality context
Fair Value Gaps (FVGs)
Detects classic 3-candle price imbalances on the active timeframe
Optional filter to show only FVGs that form after a liquidity sweep
Bullish and bearish FVGs are fully customizable with separate fill and border colors
“Do Nothing” Discipline Labels
Optional warning labels during a user-defined kill zone
Designed to discourage over-trading when:
No liquidity has been taken
Price is stuck mid-range
A sweep occurred but no clean displacement or fresh FVG followed
🧠 Intended Use
This indicator supports a “Baby ICT” approach, emphasizing:
Waiting for liquidity to be taken before looking for entries
Using Fair Value Gaps as entry zones, not signals
Avoiding mid-range and low-probability environments
Trading primarily during active sessions (London / New York)
Best used on:
5-minute charts
Index futures (ES, NQ) or liquid FX pairs
With session-based execution and strict risk control
🚫 What This Indicator Is NOT
❌ Not a buy/sell signal tool
❌ Not an automated trading strategy
❌ Not predictive or guaranteed
All trade decisions remain the responsibility of the trader.
⚠️ Risk Disclaimer
Trading involves risk. This indicator is provided for educational and informational purposes only and does not constitute financial advice. Always manage risk responsibly and test any tool thoroughly before using it in live markets.
✨ Final Notes
If you are looking for a clean, non-hype way to visualize:
Where liquidity is likely taken
Where price may rebalance
When it’s best to stand aside
Baby ICT Simple+ was built for that purpose.

FractalMod for TV with breakout alertsFractalsMod (MT4 → Pine) is a TradingView indicator converted from a custom MT4 (MQL4) fractal indicator.
This script replicates the behavior of the original MT4 version as closely as possible, including:
Confirmation-based fractals using left/right bar logic
Persistent horizontal levels derived from confirmed fractals
MT4-style “buffer-like” behavior using segmented horizontal lines
Key Features
MT4-compatible fractal logic
Uses leftbars and rightbars to confirm fractal highs/lows, equivalent to MT4 custom fractal indicators.
Segmented horizontal lines (MT4 buffer style)
Each confirmed fractal starts a new horizontal line segment from the original pivot bar.
When a new fractal is confirmed, the previous segment is stopped at the new pivot point, closely mimicking MT4 indicator buffers.
Latest fractal tracking
The most recently confirmed Up/Down fractal levels are tracked internally and used for breakout detection.
Breakout alerts (not confirmation alerts)
Alerts are triggered when the current price breaks above the latest Up fractal or below the latest Down fractal.
Breakout detection can be configured to use:
Close price only (confirmation-based), or
High/Low including wicks.
Clean visual control
Single arrow per confirmed fractal (no duplicate markers)
Optional display of fractal markers and horizontal lines
Custom colors and line width for Up/Down fractals
Typical Use Cases
Fractal-based support / resistance visualization
Breakout trading using the most recent confirmed fractal levels
MT4 → TradingView workflow migration while preserving indicator behavior
This script is designed for traders familiar with MT4 fractal indicators who want a faithful and practical TradingView equivalent without repainting on confirmed signals.
FractalsMod (MT4 → Pine) は、
MT4(MQL4)で使用されていた カスタム Fractal インジケーターを TradingView(Pine Script)へ移植したものです。
元の MT4 インジケーターの挙動を可能な限り忠実に再現することを目的としており、以下の特徴を持ちます。
主な特徴
MT4互換のフラクタル判定ロジック
leftbars / rightbars を用いたフラクタル確定方式で、
MT4 のカスタム Fractal インジケーターと同等の確定条件を再現しています。
MT4のバッファ挙動を再現した水平ライン
フラクタルが確定すると、その ピボット位置から水平ラインを開始します。
新しいフラクタルが確定した場合、それまでのラインは新しいピボット位置で停止し、
区間ごとのライン構造で MT4 のバッファ表示に近い見た目を実現しています。
最新フラクタル価格の内部保持
直近で確定した Up / Down フラクタル価格を保持し、
ブレイク判定やアラートに利用します。
ブレイク専用アラート(確定時アラートなし)
フラクタル確定時ではなく、
価格が最新の Up フラクタルを上抜けたとき
価格が最新の Down フラクタルを下抜けたとき
にアラートを出す設計です。
ブレイク判定は
終値ベース(ダマシを減らす)
ヒゲ込み(高値 / 安値)
を設定で切り替えられます。
視認性と制御性を重視した設計
フラクタル矢印は 確定時に1本のみ表示(重複なし)
Up / Down で色分けされたラインと矢印
ライン表示・矢印表示の ON / OFF 切り替え可能
想定される用途
フラクタルを用いた サポート / レジスタンスの可視化
直近フラクタルを基準とした ブレイクアウト戦略
MT4 から TradingView への移行時に、
ロジックと見た目をできるだけ変えずに使いたい場合
本スクリプトは、
MT4のフラクタル系インジケーターに慣れたトレーダーが、
TradingViewでも違和感なく使えることを重視して設計されています。

Hedge Mini Calculator (Avg Long/Short + Alerts) with dca
Hedge Mini Calculator is a position-management indicator for traders who use long & short hedging.
It plots:
Long average price
Short average price
Optional hedge close level (+% above hedge average)
The indicator also provides alerts when price reaches the long or short average, helping you manage hedge exits and directional bias with precision.
Designed for risk control, not signals.
🔹 How to Use (Simple & Clear)
1. Enter Your Positions
In the indicator settings:
Add the dollar amount and entry price for each long leg
Add the dollar amount and entry price for each short leg
Set your leverage (default x4)
The indicator does not connect to your exchange.
All values are entered manually.
2. Read the Lines
Avg Long line → average entry of all long positions
Avg Short line → average entry of all short positions
Hedge Close line (optional) → price level where you may close shorts and stay long
3. Use Alerts
You can create alerts for:
Price reaching Avg Long
Price reaching Avg Short
Alerts trigger when the candle touches the average price (high–low range).
4. Manage the Hedge
Typical workflow:
Keep both long & short active while price is inside the range
When price moves favorably and reaches your target level:
Close the hedge leg (usually shorts)
Keep the directional position (longs)
5. PnL Awareness
The info table shows:
Estimated Long PnL
Estimated Short PnL
Net PnL (based on margin & leverage)
These values are approximations for decision support.
⚠️ Disclaimer
This indicator is not a trading signal.
It is a position management tool for hedging, scaling, and risk control.

CVD Flow Dashboard [AMT Edition] + Unified AlertsCVD Flow Dashboard – Live Bar Alerts
1️⃣ Purpose of the Tool
The CVD Flow Dashboard is a reaction-based tool. It does not predict the market; it reacts to real-time order flow imbalances:
Detects strong buying/selling pressure (Delta)
Confirms trend alignment (CVD)
Detects absorption and continuation signals
It is designed to show micro (bar-level) and macro (trend) context simultaneously, allowing you to enter trades after a real market reaction occurs, rather than preempting it.
2️⃣ When to Use It
Use this dashboard in real-time trading for reaction trades:
After an attempted market move is absorbed
Market tests a level (high or low of prior bar) but fails — this is absorption.
Example: buyers push price down but sellers absorb → bullish absorption.
Minimum alignment required:
Delta: strong buy/sell delta
CVD: confirms trend direction
Acceptance: continuation candle breaks prior high/low in alignment with delta/CVD
Optional: Sequence (SEQ) — if the next bar continues the acceptance pattern, confidence rises.
Key point: only act after absorption and alignment, never before.
Recommended Integrations for Best Quality Use:
Auction Session Ranges (AMT Edition) – provides session extremes for context and levels.
CVD Flow Labels for Session Ranges – shows delta alignment across session levels.
All-in-One CVD: Failed Auction + Trap + Flow Classifications – adds absorption, trap, and flow classification confluence.
Using these together provides full micro + macro context, improving trade quality and confidence.
3️⃣ Step-by-Step Usage
Step 1: Monitor the Dashboard
Watch Delta, CVD, Acceptance, and Sequence.
Absorption often occurs without immediate alignment — this is the setup stage.
Step 2: Wait for Absorption
Bullish absorption: strong buy delta, failed auction low, price starting upward reaction
Bearish absorption: strong sell delta, failed auction high, price starting downward reaction
Step 3: Confirm the 3 Minimum Boxes
Delta → strong and aligned with absorption
CVD → trend confirmation
Acceptance → bar closes beyond prior high/low
Proceed only if all three align
Step 4: Check for Sequence (Optional)
Next bar continues pattern → higher-confidence setup
Not required, but reinforces trade quality
4️⃣ Entering Trades
Reaction trade: enter immediately once 3 minimum boxes align after absorption / absorption area re-test.
LONG = Bull absorption + CVD bullish + Acceptance
SHORT = Bear absorption + CVD bearish + Acceptance
Sequence bonus: can add to position or widen stop for confidence
5️⃣ Risk Management / Protecting Positions
Initial Stop-Loss: just beyond failed auction extreme (low for bullish, high for bearish)
Trailing Stop / Sequence Protection: trail below prior bar lows/highs if sequence occurs
Avoid Over-Exposure: multiple trades can occur, but only if alignment is verified
Time Sensitivity: reaction trades are intraday/high-frequency — avoid holding overnight without macro confirmation
6️⃣ Practical Tips
Do not trade solely on absorption — wait for minimum 3-box alignment
Use Sequence only as reinforcement
Watch volume spikes and strong delta — often precede absorption/continuation
Best used on 15-minute timeframe ✅ ✅ or higher for swing intraday confirmation; lower timeframes (5 min) for live reaction trades
Combine with Auction Session Ranges, CVD Flow Labels, and All-in-One CVD tools for best quality trade context
✅ Live Bar Alerts
Alerts trigger on the current live bar best, not just at close make sure it continues if you choose to use at close of candle, when:
Bull alignment: Delta + CVD + Acceptance align (Sequence optional)
Bear alignment: Delta + CVD + Acceptance align (Sequence optional)
Alerts continue after bar close if conditions persist, allowing both immediate reaction entries or confirmation at bar close.
✅ Summary Workflow (Reaction Trade Flow)
Market attempts a move → Absorption occurs
Check 3 minimum boxes: Delta + CVD + Acceptance
Optional: Sequence confirms continuation
Enter trade immediately
Place stop-loss just beyond absorption extreme
Use Sequence for trailing stop or scaling confidence
“Let the market react first, then follow the confirmed flow” — this is why it’s a reaction tool, not predictive.
