Algorithmic Signal AnalyzerMeet Algorithmic Signal Analyzer (ASA) v1: A revolutionary tool that ushers in a new era of clarity and precision for both short-term and long-term market analysis, elevating your strategies to the next level.
ASA is an advanced TradingView indicator designed to filter out noise and enhance signal detection using mathematical models. By processing price movements within defined standard deviation ranges, ASA produces a smoothed analysis based on a Weighted Moving Average (WMA). The Volatility Filter ensures that only relevant price data is retained, removing outliers and improving analytical accuracy.
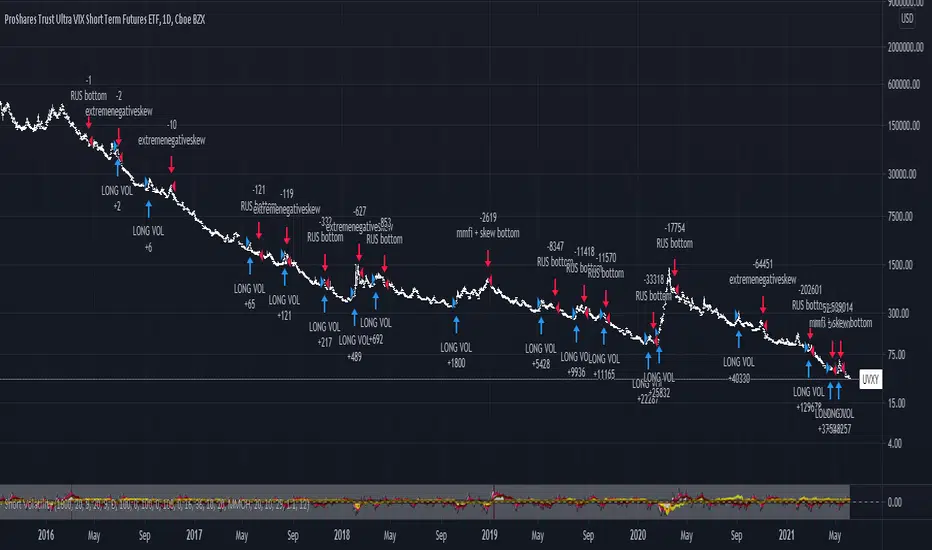
While ASA provides significant analytical advantages, it’s essential to understand its capabilities in both short-term and long-term use cases. For short-term trading, ASA excels at capturing swift opportunities by highlighting immediate trend changes. Conversely, in long-term trading, it reveals the overall direction of market trends, enabling traders to align their strategies with prevailing conditions.
Despite these benefits, traders must remember that ASA is not designed for precise trade execution systems where accuracy in timing and price levels is critical. Its focus is on analysis rather than order management. The distinction is crucial: ASA helps interpret price action effectively but may not account for real-time market factors such as slippage or execution delays.
Features and Functionality
ASA integrates multiple tools to enhance its analytical capabilities:
Customizable Moving Averages: SMA, EMA, and WMA options allow users to tailor the indicator to their trading style.
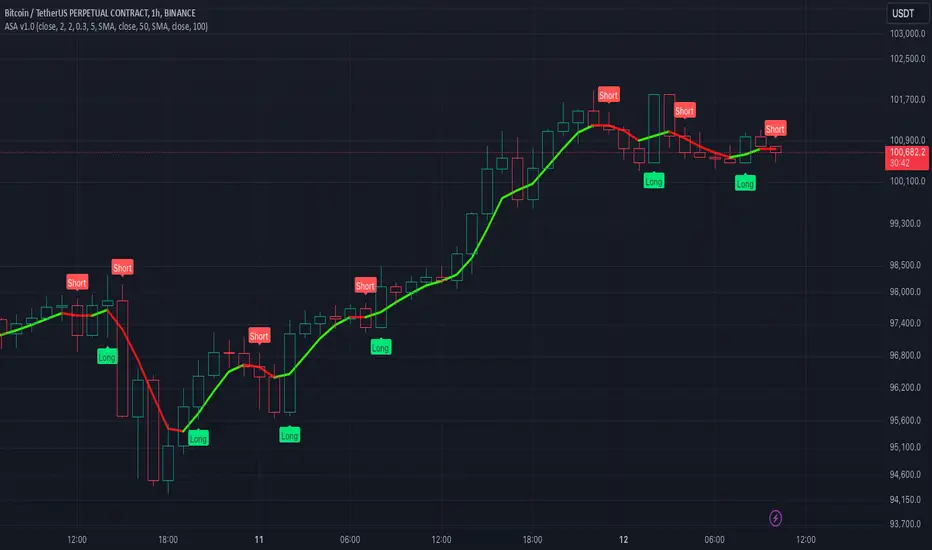
Signal Detection: Identifies bullish and bearish trends using the Relative Exponential Moving Average (REMA) and marks potential buy/sell opportunities.
Visual Aids: Color-coded trend lines (green for upward, red for downward) simplify interpretation.
Alert System: Notifications for trend swings and reversals enable timely decision-making.
Notes on Usage
ASA’s effectiveness depends on the context in which it is applied. Traders should carefully consider the trade-offs between analysis and execution.
Results may vary depending on market conditions and chart types. Backtesting with ASA on standard charts provides more reliable insights compared to non-standard chart types.
Short-term use focuses on rapid trend recognition, while long-term application emphasizes understanding broader market movements.
Takeaways
ASA is not a tool for precise trade execution but a powerful aid for interpreting price trends.
For short-term trading, ASA identifies quick opportunities, while for long-term strategies, it highlights trend directions.
Understanding ASA’s limitations and strengths is key to maximizing its utility.
ASA is a robust solution for traders seeking to filter noise, enhance analytical clarity, and align their strategies with market movements, whether for short bursts of activity or sustained trading goals.
Индикатор Pine Script®