ATR Levels - Previous Candle Open1 of 3 scripts I use all 3 together to "tell the story" specifically designed for NQ to watch 4H timeframe. code is generated by Claude AI so thats why it is free. Индикатор Pine Script®от timkamazik2
ATR Table (Top Right) - Multi Rangejust your friendly atr table to multiple ranges and for the sense of what is brewing Индикатор Pine Script®от faderrr9
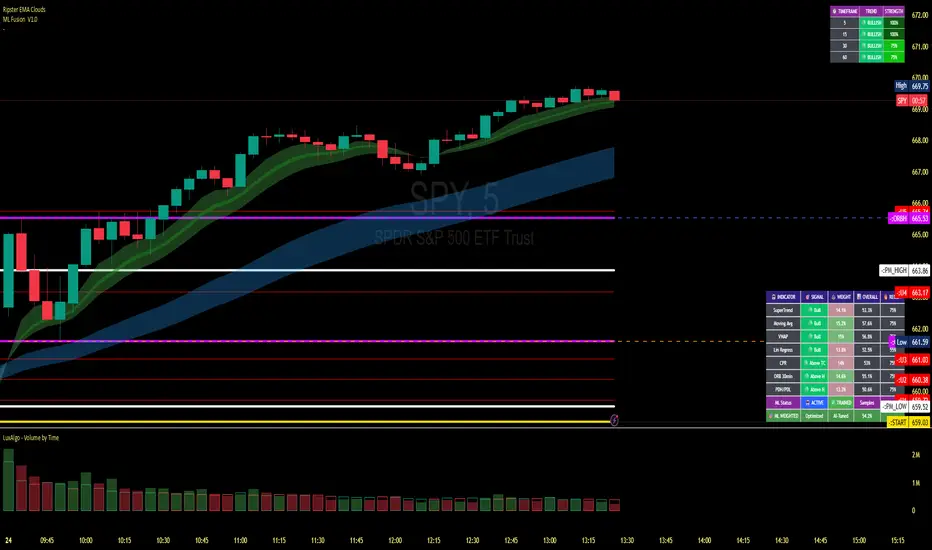
ATR Volatility Impulse Candles (Bull & Bear)This indicator highlights unusually strong momentum candles using ATR as a volatility filter. Treyding Stocks was the inspiration behind this powerful swing indicator! A candle is marked only when its body is larger than the Average True Range, meaning price moved farther than normal for that timeframe. This filters out noise and focuses attention on candles that often matter most. Lime green candles represent strong bullish impulse. They occur when price closes above the open and the candle body is larger than ATR. These candles often show aggressive buying, late-stage momentum, or exhaustion before a reversal. Blue candles represent strong bearish impulse. They occur when price closes below the open and the candle body is larger than ATR. These candles often signal aggressive selling, liquidation, stop runs, or breakdown confirmation. The indicator includes alerts for both bullish and bearish impulse candles, allowing traders to monitor multiple charts without watching them constantly. Traders commonly use this tool to identify momentum exhaustion, reversal zones, and high-impact candles near VWAP, key moving averages, or important price levels. It works on any timeframe, does not repaint, and is designed to keep the chart clean while highlighting only the most meaningful price moves. The Red (Blue) candle is very useful for swings especially on the Daily chart *When the Blue (RED) candle appears, mark the high/low, and enter when the next candle breaks /closes above it. Индикатор Pine Script®от TheTradingGoddess13
ATR High and Low Offset from PriceAverage True Range based on last X time periods. Learned this from the master Trader Dante, but wanted to code my own ATR indicator for practice and I noticed his keeps moving throughout the day on BTC, so testing my own. Индикатор Pine Script®от DegenWiz20
ATR Daily & Weekly With Stop Buffer this script shows Daily & Weekly ATR and also add 10% Stop buffer calculation so you can add stop loss.Индикатор Pine Script®от writetoinvest23
ATR + True RangeOne indicator for ATR & TR its a common indictor which can be used as one instead of 2 different its is trial mode only not to be used with out other references Индикатор Pine Script®от GOGOSCALPER5
ATR Risk Manager v5.2 [Auto-Extrapolate]If you ever had problems knowing how much contracts to use for a particular timeframe to keep your risk within acceptable levels, then this indicator should help. You just have to define your accepted risk based on ATR and also percetage of your drawdown, then the indicator will tell you how many contracts you should use. If the risk is too high, it will also tell you not to trade. This is only for futures NQ MNQ ES MES GC MGC CL MCL MYM and M2K. Индикатор Pine Script®от jebkermanspaceОбновлено 15
ATR STRUCTURESTATIC LINES SET BY ATR VALUES AND MULTIPLED OBSE$RVED EPERCENTAGES more of a tool I use for me then it is for anyone else. Индикатор Pine Script®от TuskenDayTrade1124
ATR Trailing Stop + HL2 VWAP + EMAsmain atr/ema script use this to guage immediate trend on the 2m use this to guage long term trend on thr 6h and one day charts. Typicallly most accurate with futures.Индикатор Pine Script®от smalltilt14
ATR x4 (Compact Table)Multi-ATR - 4 overlapped. Works with any timeframe! -StockFoxxИндикатор Pine Script®от StockFox_9
ATR BoxIt shows the ATR(Average True Range) on selected time frame. Simple and compact view.Индикатор Pine Script®от deivisdeivisОбновлено 14
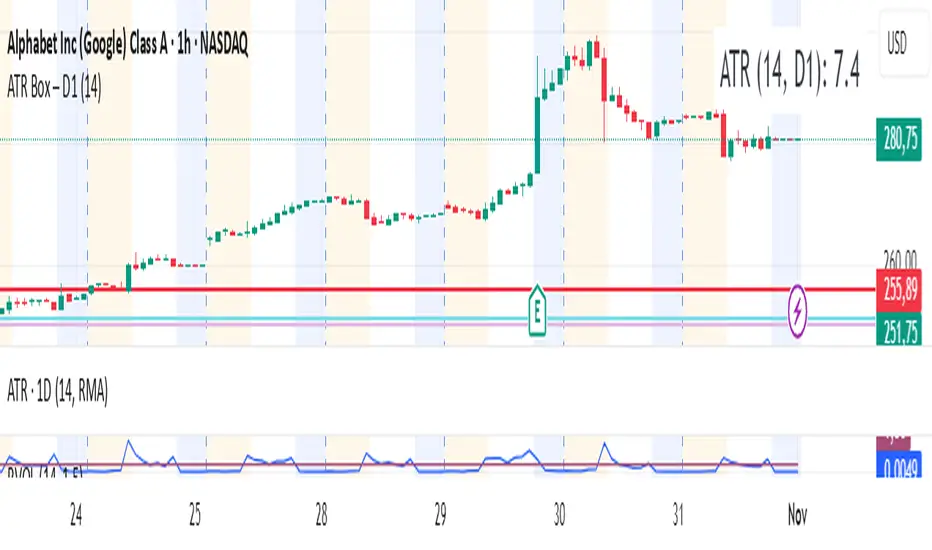
ATR Box – D1 (14)Kleiner Indikator der den ATR D1 in einer kleinen Box anzeigt.Индикатор Pine Script®от c_slw12
ATR-BHEEM-NOCHANGE-CANDLESCandles remain normal — removed barcolor(barCol) ATR trailing stop line still shows trend direction (green/red) Optional buy/sell labels added only when trend flips Clean and ready for intraday 1-min chartsИндикатор Pine Script®от Bheemesh1325
ATR Trailing Stop Without tradepanel Open✅ Only plots ATR trailing stop line ✅ Only colors candles ✅ No trades / entries ✅ No “Strategy Tester” panel ✅ No arrows, markers, or trade listsИндикатор Pine Script®от Bheemesh1310
ATR Bands over 50D SMA (% method)Indicator that shows multiples of ATR% above the 50d SMA as bands on a chart, building off of Jeff Sun 's methodology. You should tinker with the settings to chose your multiples, colors and which multiple lines to show. I don't know if the negative multiple lines have any use, so I turn mine off. Offered as is. I am not a programmer. Note the other indicators shown on the print screen are not mine.Индикатор Pine Script®от Cotton_Dog232
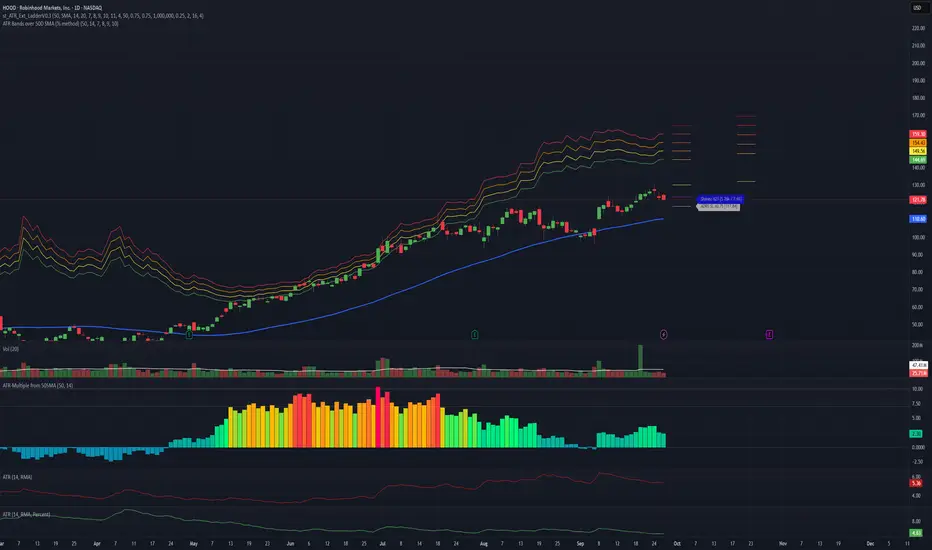
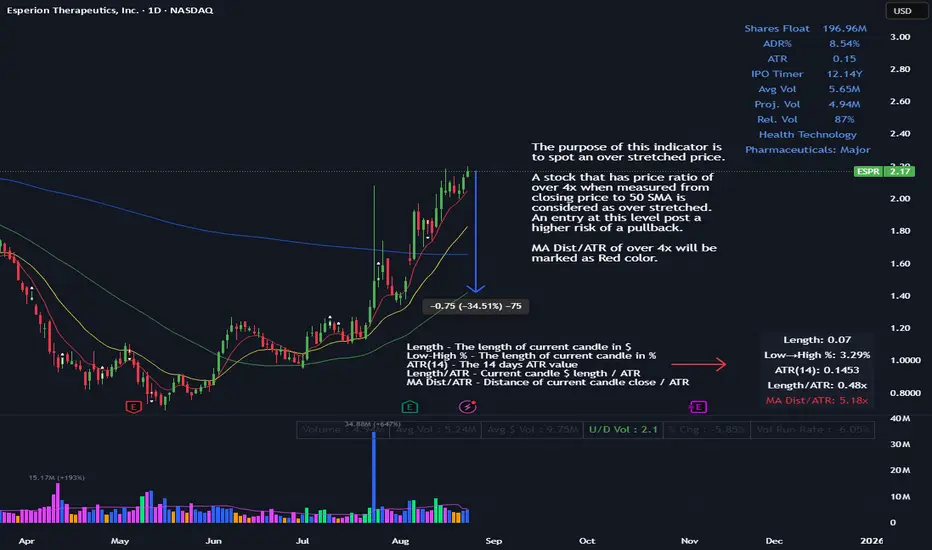
ATR Multiple from MAThe purpose of this indicator is to spot an over stretched price. A stock that has price ratio of over 4x when measured from closing price to 50 SMA is considered as over stretched. An entry at this level post a higher risk of a pullback. MA Dist/ATR of over 4x will be marked as Red color.Индикатор Pine Script®от desmond55294
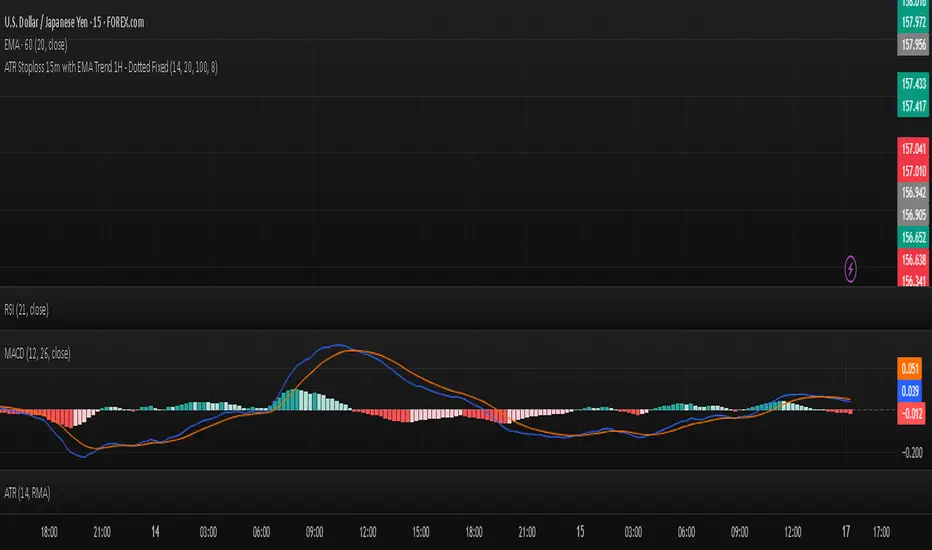
ATR Stoploss 15m with EMA Trend 1H - Dotted Fixeduse this as a basic ATR stoploss. It uses 100 and 20 EMA on 1hr to determine trend.Индикатор Pine Script®от huntgun58Обновлено 9
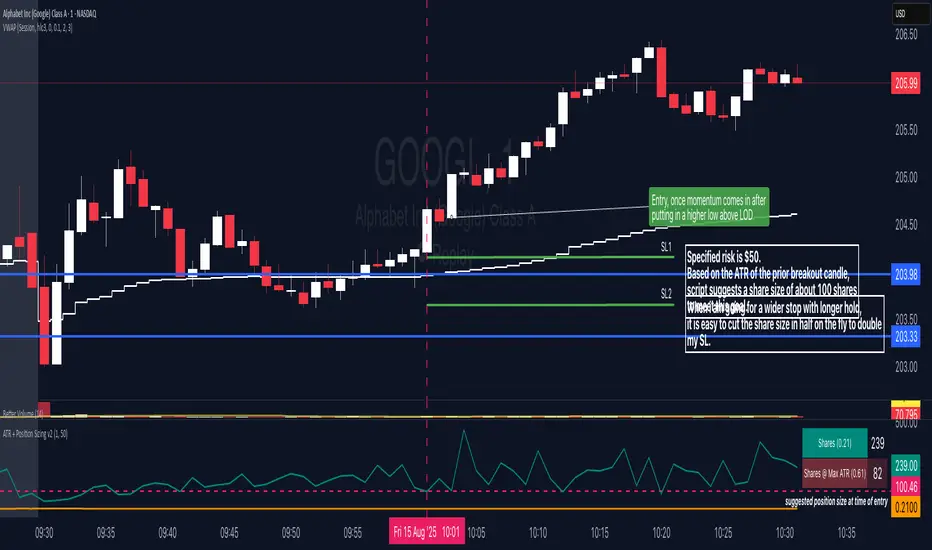
ATR + Position SizingThis is an equalized risk calculation for easy position sizing when trading multiple instruments at the open. The formula is simple: Position Size = $ Risk / X-period ATRИндикатор Pine Script®от nikita_castle00Обновлено 2
ATR Volatility Breakout - Daily (Minimal) - SyTheInvestorGuycolor-coded TradingView Pine Script that highlights the background green/red on days when these ATR breakout conditions Индикатор Pine Script®от SimonWerner10
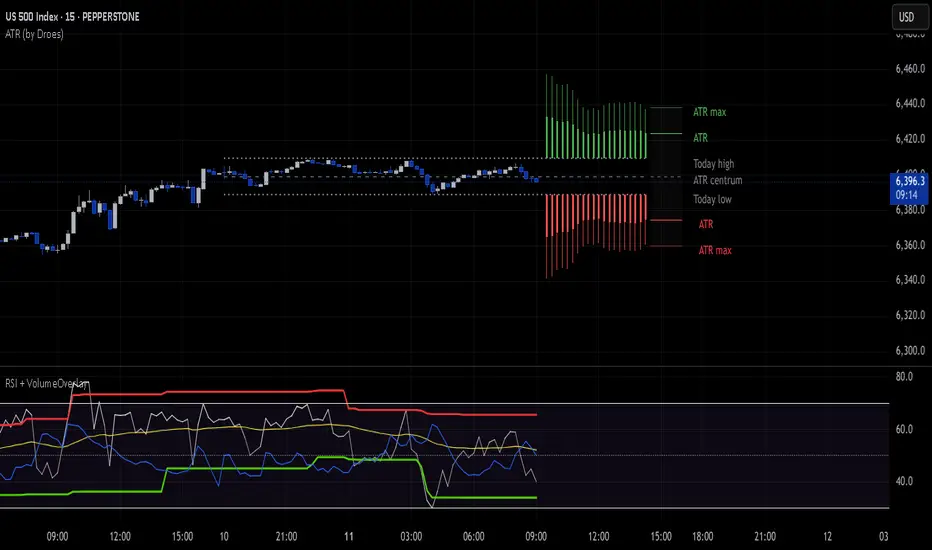
ATR Dynamische Candles 1.2 (by Droes)This script visualizes ATR values as candles to the right of the last candle at today's high and today's low.Индикатор Pine Script®от cryptovisjeОбновлено 35
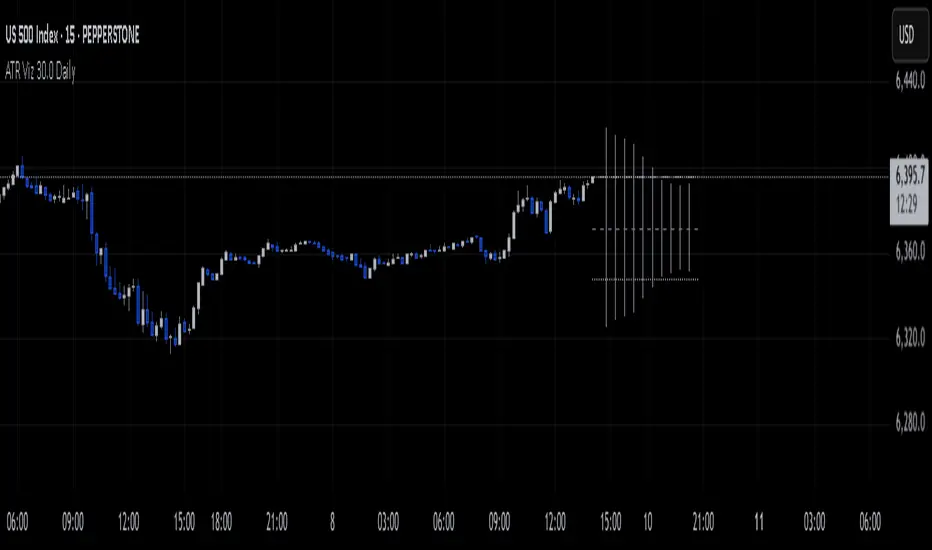
ATR Daily Viz V30.0This script visualizes ATR values as candles to the right of the last candle at today's high and low. This is the first version.Индикатор Pine Script®от cryptovisje8
ATR Daily Viz V30.0This script visualizes ATR values as candles to the right of the last candle at today's high and low. This is the first version.Индикатор Pine Script®от cryptovisje7
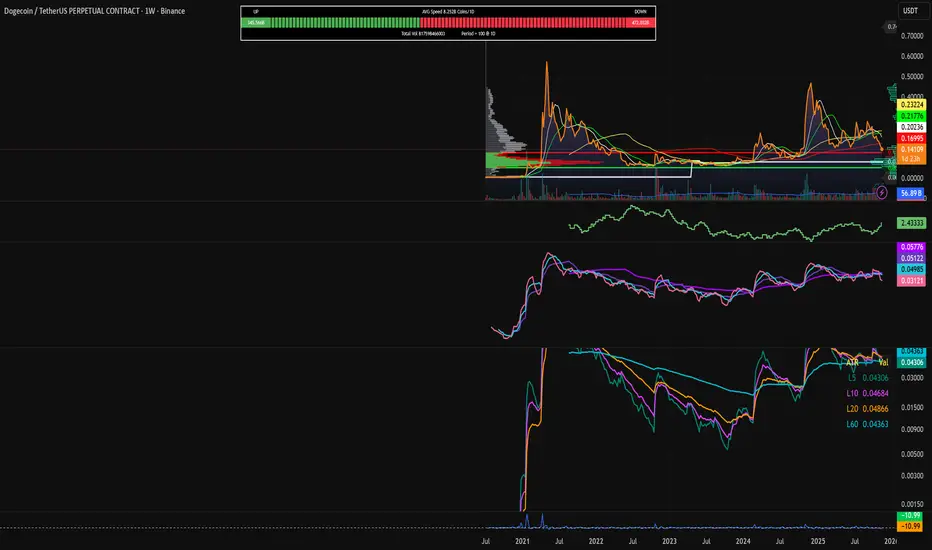
ATR % Oscillator - DolphinTradeBot1️⃣ Overview 🔸 This is a simplified version of ATR and TR that shows volatility as percentage changes , making it easier to compare two symbols. 🔸 The indicator compares the volatility of two different assets by calculating the percentage-based price ranges and their moving averages . 📌 This is especially useful for pair traders, as it helps identify which symbol is more volatile, allowing for strategic decisions based on relative movement rather than overall market direction. 2️⃣ How Is It Work? 🔸 For each symbol, it calculates the absolute percentage difference between either: • Close and Open (net price change), or • High and Low (daily price range). 🔸 The results are visualized as column bars — the taller the bar, the higher the volatility. 🔸 It also plots a moving average line (SMA) based on the selected range length. 📌 These calculations are independent of the chart you're on — they work purely based on the two selected symbols. If no symbols are selected, it defaults to using the current chart's symbol. 3️⃣ How to Use It? With this indicator, you can: 🔸 Compare the volatility between two assets. 🔸 Detect sudden volatility spikes that may signal upcoming momentum. 🔸 Support spread, arbitrage, or correlation-based strategies . 🔸 See which symbol is gaining market attention (a larger difference = more activity). Example: Compare BTC vs ETH to see which one is dominating in terms of price action or volatility. 4️⃣⚙️ Settings 🔸 Symbol Settings • Symbol-1 / Symbol-2: Choose the two assets to compare. • Checkboxes: Enable/disable visibility for each symbol's data. 🔸 Calculation Settings • Range Average: The number of bars used for the moving average. • Calculation Source: - Close-Open: Measures net price movement. - High-Low: Measures total price range.Индикатор Pine Script®от DolphinTradeBot16