IPO Lifecycle Sell Strategy [JARUTIR]IPO Lifecycle Sell Strategy with Dynamic Buy Date and Multiple Sell Rules
This custom TradingView script is designed for traders looking to capitalize on dynamic strategies for IPOs and growth stocks, by implementing several sell rules based on price action and technical indicators. It provides a set of sell rules that are applied dynamically depending on the stock's lifecycle and price action, allowing users to lock in profits and minimize drawdowns based on key technical thresholds.
The four sell strategies incorporated into this script are inspired by the book "The Lifecycle Trade", a resource that focuses on capturing profits while managing risk in different phases of a stock's lifecycle, from IPO to high-growth stages.
Key Features:
Buy Price and Buy Date: You can either manually input your buy price and date or let the script automatically detect the buy date based on the specified buy price.
Multiple Sell Strategies: Choose from 4 predefined sell strategies:
Ascender Rule : Captures strong momentum from IPO stocks by selling portions at specific price levels or technical conditions.
Midterm Rule : Focuses on holding for longer periods, with defensive sell signals triggered when the stock deviates significantly from peak price or key moving averages.
40 Week Rule : Designed for long-term holds, this rule triggers a sell when the stock closes below the 40-week moving average.
Everest Rule : Aggressive strategy for selling into strength based on parabolic moves or gap downs, ideal for high momentum stocks.
Interactive Features:
Horizontal Green Line showing the buy price level from the buy date.
Visual Sell Signals appear only after the buy date to ensure that your analysis is relevant to the stock lifecycle.
Customizable settings, allowing you to choose your preferred sell rule strategy and automate buy date detection.
This script is perfect for traders using a strategic, systematic approach to IPOs and high-growth stocks, whether you're looking for quick exits during momentum phases or holding for longer-term growth.
Usage:
Input your Buy Price and Buy Date, or allow the script to automate the buy date detection.
Select a Sell Rule strategy based on your risk profile and trading style.
View visual signals for selling when specific conditions are met.
Frequently Asked Questions (FAQs):
Q1: How do I input my Buy Price and Buy Date?
The script allows you to either manually input the Buy Price and Buy Date or use the automated detection. If you choose automated detection, the script will automatically assign the buy date when the price crosses above your set Buy Price.
Q2: What is the purpose of the "Sell Rules"?
The script offers four sell strategies to help manage different types of stocks in varying phases of their lifecycle:
Ascender Rule: Targets IPO stocks showing positive momentum.
Midterm Rule: A defensive strategy for stocks in a steady uptrend.
40 Week Rule: Long-term hold strategy designed to ride stocks through extended growth.
Everest Rule: Aggressive strategy to capture profits during parabolic price moves.
Q3: What is the significance of the Green Line at Buy Price?
The Green Line represents your entry point (Buy Price) on the chart. It will appear from the buy date onwards, helping you track the performance of your stock relative to your entry.
Q4: Can I customize the Sell Strategy?
Yes! You can choose from the available Sell Rules (Ascender Rule, Midterm Rule, 40 Week Rule, Everest Rule) via an input option in the script. Each strategy has its own unique triggers based on price action, moving averages, and time-based conditions.
Q5: Does this script work for stocks and crypto?
Yes, this script is designed for both stocks and cryptocurrencies. It works on any asset where price data and timeframes are available.
Q6: How do the Weekly Moving Averages (WSMA) work in this strategy?
The script uses weekly moving averages (WSMA) to track longer-term trends. These are essential for some of the sell rules, such as the Midterm Rule and 40 Week Rule, which rely on the stock's movement relative to the 40-week moving average.
Q7: Will the script plot a Sell Signal immediately after the Buy Date?
No, sell signals will only be plotted after the Buy Date. This ensures that the sell strategy is relevant to your actual holding period and avoids premature triggers.
Q8: How do I interpret the Sell Signal?
The script will plot a Red Sell Signal above the bar when the sell conditions are met, based on the selected strategy. This indicates that it may be a good time to exit the position according to your chosen rule.
Q9: Can I use this strategy on different timeframes?
Yes, you can apply the script to any timeframe. However, some sell strategies, like the Midterm Rule and 40 Week Rule, are designed to work best with weekly data, so it's recommended to use these strategies with longer timeframes.
Q10: Does this script have any alerts?
Yes! The script supports alert conditions that will notify you when the sell conditions are met according to your selected rule. You can set up alerts to stay informed without needing to watch the chart constantly.
Q11: What if I want to disable some of the sell rules?
You can select your preferred sell rule using the "Select Sell Rule" dropdown. If you don’t want to use a particular rule, simply choose a different strategy or leave it inactive.
------------------------------
Disclaimer:
This strategy is intended for educational purposes only. It should not be considered financial advice. Always perform your own research and consult with a professional before making any trading decisions. Trading involves significant risk, and you should never trade with money you cannot afford to lose.
Поиск скриптов по запросу "averages"

True Range Trend StrengthThis script is designed to analyze trend strength using True Range calculations alongside Donchian Channels and smoothed moving averages. It provides a dynamic way to interpret market momentum, trend reversals, and anticipate potential entry points for trades.
Key Functionalities:
Trend Strength Oscillator:
Calculates trend strength based on the difference between long and short momentum derived from ATR (Average True Range) adjusted stop levels.
Smooths the trend strength using a simple moving average for better readability.
Donchian Channels on Trend Strength Oscillator:
Plots upper and lower Donchian Channels on the smoothed trend strength oscillator.
Traders can use these levels to anticipate breakout points and determine the strength of a trend.
Zero-Cross Shading:
Highlights bullish and bearish zones with shaded backgrounds:
Green for bullish zones where smoothed trend strength is above zero.
Red for bearish zones where smoothed trend strength is below zero.
Moving Averages for Oscillator:
Overlays fast and slow moving averages on the oscillator to provide crossover signals:
Fast MA Cross Above Slow MA: Indicates bullish momentum.
Fast MA Cross Below Slow MA: Indicates bearish momentum.
Alerts:
Alerts are available for MA crossovers, allowing traders to receive timely notifications about potential trend reversals or continuation signals.
Anticipating Entries with Donchian Channels:
The integration of Donchian Channels offers an edge in anticipating excellent trade entries.
Traders can use the oscillator's position relative to the channels to gauge oversold/overbought conditions or potential breakouts.
Use Case:
This script is particularly useful for traders looking to:
Identify the strength and direction of market trends.
Time entries and exits based on dynamic Donchian Channel levels and trend strength analysis.
Incorporate moving averages and visual cues for better decision-making.

Power Core MAThe Power Core MA indicator is a powerful tool designed to identify the most significant moving average (MA) in a given price chart. This indicator analyzes a wide range of moving averages, from 50 to 400 periods, to determine which one has the strongest influence on the current price action.
The blue line plotted on the chart represents the "Current Core MA," which is the moving average that is most closely aligned with other nearby moving averages. This line indicates the current trend and potential support or resistance levels.
The table displayed on the chart provides two important pieces of information. The "Current Core MA" value shows the length of the moving average that is currently most influential. The "Historical Core MA" value represents the average length of the most influential moving averages over time.
This indicator is particularly useful for traders and analysts who want to identify the most relevant moving average for their analysis. By focusing on the moving average that has the strongest historical significance, users can make more informed decisions about trend direction, support and resistance levels, and potential entry or exit points.
The Power Core MA is an excellent tool for those interested in finding the strongest moving average in the price history. It simplifies the process of analyzing multiple moving averages by automatically identifying the most influential one, saving time and providing valuable insights into market dynamics.
By combining current and historical data, this indicator offers a comprehensive view of the market's behavior, helping traders to adapt their strategies to the most relevant timeframes and trend strengths.

Volumatic Variable Index Dynamic Average [BigBeluga]The Volumatic VIDYA (Variable Index Dynamic Average) indicator is a trend-following tool that calculates and visualizes both the current trend and the corresponding buy and sell pressure within each trend phase. Using the Variable Index Dynamic Average as the core smoothing technique, this indicator also plots volume levels of lows and highs based on market structure pivot points, providing traders with key insights into price and volume dynamics.
Additionally, it generates delta volume values to help traders evaluate buy-sell pressure balance during each trend, making it a powerful tool for understanding market sentiment shifts.
BTC:
TSLA:
🔵 IDEA
The Volumatic VIDYA indicator's core idea is to provide a dynamic, adaptive smoothing tool that identifies trends while simultaneously calculating the volume pressure behind them. The VIDYA line, based on the Variable Index Dynamic Average, adjusts according to the strength of the price movements, offering a more adaptive response to the market compared to standard moving averages.
By calculating and displaying the buy and sell volume pressure throughout each trend, the indicator provides traders with key insights into market participation. The horizontal lines drawn from the highs and lows of market structure pivots give additional clarity on support and resistance levels, backed by average volume at these points. This dual analysis of trend and volume allows traders to evaluate the strength and potential of market movements more effectively.
🔵 KEY FEATURES & USAGE
VIDYA Calculation:
The Variable Index Dynamic Average (VIDYA) is a special type of moving average that adjusts dynamically to the market’s volatility and momentum. Unlike traditional moving averages that use fixed periods, VIDYA adjusts its smoothing factor based on the relative strength of the price movements, using the Chande Momentum Oscillator (CMO) to capture the magnitude of price changes. When momentum is strong, VIDYA adapts and smooths out price movements quicker, making it more responsive to rapid price changes. This makes VIDYA more adaptable to volatile markets compared to traditional moving averages such as the Simple Moving Average (SMA) or the Exponential Moving Average (EMA), which are less flexible.
// VIDYA (Variable Index Dynamic Average) function
vidya_calc(src, vidya_length, vidya_momentum) =>
float momentum = ta.change(src)
float sum_pos_momentum = math.sum((momentum >= 0) ? momentum : 0.0, vidya_momentum)
float sum_neg_momentum = math.sum((momentum >= 0) ? 0.0 : -momentum, vidya_momentum)
float abs_cmo = math.abs(100 * (sum_pos_momentum - sum_neg_momentum) / (sum_pos_momentum + sum_neg_momentum))
float alpha = 2 / (vidya_length + 1)
var float vidya_value = 0.0
vidya_value := alpha * abs_cmo / 100 * src + (1 - alpha * abs_cmo / 100) * nz(vidya_value )
ta.sma(vidya_value, 15)
When momentum is strong, VIDYA adapts and smooths out price movements quicker, making it more responsive to rapid price changes. This makes VIDYA more adaptable to volatile markets compared to traditional moving averages
Triangle Trend Shift Signals:
The indicator marks trend shifts with up and down triangles, signaling a potential change in direction. These signals appear when the price crosses above a VIDYA during an uptrend or crosses below during a downtrend.
Volume Pressure Calculation:
The Volumatic VIDYA tracks the buy and sell pressure during each trend, calculating the cumulative volume for up and down bars. Positive delta volume occurs during uptrends due to higher buy pressure, while negative delta volume reflects higher sell pressure during downtrends. The delta is displayed in real-time on the chart, offering a quick view of volume imbalances.
Market Structure Pivot Lines with Volume Labels:
The indicator draws horizontal lines based on market structure pivots, which are calculated using the highs and lows of price action. These lines are extended on the chart until price crosses them. The indicator also plots the average volume over a 6-bar range to provide a clearer understanding of volume dynamics at critical points.
🔵 CUSTOMIZATION
VIDYA Length & Momentum: Control the sensitivity of the VIDYA line by adjusting the length and momentum settings, allowing traders to customize the smoothing effect to match their trading style.
Volume Pivot Detection: Set the number of bars to consider for identifying pivots, which influences the calculation of the average volume at key levels.
Band Distance: Adjust the band distance multiplier for controlling how far the upper and lower bands extend from the VIDYA line, based on the ATR (Average True Range).

Uptrick: Trend SMA Oscillator### In-Depth Analysis of the "Uptrick: Trend SMA Oscillator" Indicator
---
#### Introduction to the Indicator
The "Uptrick: Trend SMA Oscillator" is an advanced yet user-friendly technical analysis tool designed to help traders across all levels of experience identify and follow market trends with precision. This indicator builds upon the fundamental principles of the Simple Moving Average (SMA), a cornerstone of technical analysis, to deliver a clear, visually intuitive overlay on the price chart. Through its strategic use of color-coding and customizable parameters, the Uptrick: Trend SMA Oscillator provides traders with actionable insights into market dynamics, enhancing their ability to make informed trading decisions.
#### Core Concepts and Methodology
1. **Foundational Principle – Simple Moving Average (SMA):**
- The Simple Moving Average (SMA) is the heart of the Uptrick: Trend SMA Oscillator. The SMA is a widely-used technical indicator that calculates the average price of an asset over a specified number of periods. By smoothing out price data, the SMA helps to reduce the noise from short-term fluctuations, providing a clearer picture of the overall trend.
- In the Uptrick: Trend SMA Oscillator, two SMAs are employed:
- **Primary SMA (oscValue):** This is applied to the closing price of the asset over a user-defined period (default is 14 periods). This SMA tracks the price closely and is sensitive to changes in market direction.
- **Smoothing SMA (oscV):** This second SMA is applied to the primary SMA, further smoothing the data and helping to filter out minor price movements that might otherwise be mistaken for trend reversals. The default period for this smoothing is 50, but it can be adjusted to suit the trader's preference.
2. **Color-Coding for Trend Visualization:**
- One of the most distinctive features of this indicator is its use of color to represent market trends. The indicator’s line changes color based on the relationship between the primary SMA and the smoothing SMA:
- **Bullish (Green):** The line turns green when the primary SMA is equal to or greater than the smoothing SMA, indicating that the market is in an upward trend.
- **Bearish (Red):** Conversely, the line turns red when the primary SMA falls below the smoothing SMA, signaling a downward trend.
- This color-coded system provides traders with an immediate, easy-to-interpret visual cue about the market’s direction, allowing for quick decision-making.
#### Detailed Explanation of Inputs
1. **Bullish Color (Default: Green #00ff00):**
- This input allows traders to customize the color that represents bullish trends on the chart. The default setting is green, a color commonly associated with upward market movement. However, traders can adjust this to any color that suits their visual preferences or matches their overall chart theme.
2. **Bearish Color (Default: Red RGB: 245, 0, 0):**
- The bearish color input determines the color of the line when the market is trending downwards. The default setting is a vivid red, signaling caution or selling opportunities. Like the bullish color, this can be customized to fit the trader’s needs.
3. **Line Thickness (Default: 5):**
- This setting controls the thickness of the line plotted by the indicator. The default thickness of 5 makes the line prominent on the chart, ensuring that the trend is easily visible even in complex or crowded chart setups. Traders can adjust the thickness to make the line thinner or thicker, depending on their visual preferences.
4. **Primary SMA Period (Value 1 - Default: 14):**
- The primary SMA period defines how many periods (e.g., days, hours) are used to calculate the moving average based on the asset’s closing prices. The default period of 14 is a balanced setting that offers a good mix of responsiveness and stability, but traders can adjust this depending on their trading style:
- **Shorter Periods (e.g., 5-10):** These make the indicator more sensitive, capturing trends more quickly but also increasing the likelihood of reacting to short-term price fluctuations or "noise."
- **Longer Periods (e.g., 20-50):** These smooth the data more, providing a more stable trend line that is less prone to whipsaws but may be slower to respond to trend changes.
5. **Smoothing SMA Period (Value 2 - Default: 50):**
- The smoothing SMA period determines how much the primary SMA is smoothed. A longer smoothing period results in a more gradual, stable line that focuses on the broader trend. The default of 50 is designed to smooth out most of the short-term fluctuations while still being responsive enough to detect significant trend shifts.
- **Customization:**
- **Shorter Smoothing Periods (e.g., 20-30):** Make the indicator more responsive, better for fast-moving markets or for traders who want to capture quick trends.
- **Longer Smoothing Periods (e.g., 70-100):** Enhance stability, ideal for long-term traders looking to avoid reacting to minor price movements.
#### Unique Characteristics and Advantages
1. **Simplicity and Clarity:**
- The Uptrick: Trend SMA Oscillator’s design prioritizes simplicity without sacrificing effectiveness. By relying on the widely understood SMA, it avoids the complexity of more esoteric indicators while still providing reliable trend signals. This simplicity makes it accessible to traders of all levels, from novices who are just learning about technical analysis to experienced traders looking for a straightforward, dependable tool.
2. **Visual Feedback Mechanism:**
- The indicator’s use of color to signify market trends is a particularly powerful feature. This visual feedback mechanism allows traders to assess market conditions at a glance. The clarity of the green and red color scheme reduces the mental effort required to interpret the indicator, freeing the trader to focus on strategy execution.
3. **Adaptability Across Markets and Timeframes:**
- One of the strengths of the Uptrick: Trend SMA Oscillator is its versatility. The basic principles of moving averages apply equally well across different asset classes and timeframes. Whether trading stocks, forex, commodities, or cryptocurrencies, traders can use this indicator to gain insights into market trends.
- **Intraday Trading:** For day traders who operate on short timeframes (e.g., 1-minute, 5-minute charts), the oscillator can be adjusted to be more responsive, capturing quick shifts in momentum.
- **Swing Trading:** Swing traders, who typically hold positions for several days to weeks, will find the default settings or slightly adjusted periods ideal for identifying and riding medium-term trends.
- **Long-Term Trading:** Position traders and investors can adjust the indicator to focus on long-term trends by increasing the periods for both the primary and smoothing SMAs, filtering out minor fluctuations and highlighting sustained market movements.
4. **Minimal Lag:**
- One of the challenges with moving averages is lag—the delay between when the price changes and when the indicator reflects this change. The Uptrick: Trend SMA Oscillator addresses this by allowing traders to adjust the periods to find a balance between responsiveness and stability. While all SMAs inherently have some lag, the customizable nature of this indicator helps traders mitigate this effect to align with their specific trading goals.
5. **Customizable and Intuitive:**
- While many technical indicators come with a fixed set of parameters, the Uptrick: Trend SMA Oscillator is fully customizable, allowing traders to tailor it to their trading style, market conditions, and personal preferences. This makes it a highly flexible tool that can be adjusted as markets evolve or as a trader’s strategy changes over time.
#### Practical Applications for Different Trader Profiles
1. **Day Traders:**
- **Use Case:** Day traders can customize the SMA periods to create a faster, more responsive indicator. This allows them to capture short-term trends and make quick decisions. For example, reducing the primary SMA to 5 and the smoothing SMA to 20 can help day traders react promptly to intraday price movements.
- **Strategy Integration:** Day traders might use the Uptrick: Trend SMA Oscillator in conjunction with volume-based indicators to confirm the strength of a trend before entering or exiting trades.
2. **Swing Traders:**
- **Use Case:** Swing traders can use the default settings or slightly adjust them to smooth out minor price fluctuations while still capturing medium-term trends. This approach helps in identifying the optimal points to enter or exit trades based on the broader market direction.
- **Strategy Integration:** Swing traders can combine this indicator with oscillators like the Relative Strength Index (RSI) to confirm overbought or oversold conditions, thereby refining their entry and exit strategies.
3. **Position Traders:**
- **Use Case:** Position traders, who hold trades for extended periods, can extend the SMA periods to focus on long-term trends. By doing so, they minimize the impact of short-term market noise and focus on the underlying trend.
- **Strategy Integration:** Position traders might use the Uptrick: Trend SMA Oscillator in combination with fundamental analysis. The indicator can help confirm the timing of entries and exits based on broader economic or corporate developments.
4. **Algorithmic and Quantitative Traders:**
- **Use Case:** The simplicity and clear logic of the Uptrick: Trend SMA Oscillator make it an excellent candidate for algorithmic trading strategies. Its binary output—bullish or bearish—can be easily coded into automated trading systems.
- **Strategy Integration:** Quant traders might use the indicator as part of a larger trading system that incorporates multiple indicators and rules, optimizing the SMA periods based on historical backtesting to achieve the best results.
5. **Novice Traders:**
- **Use Case:** Beginners can use the Uptrick: Trend SMA Oscillator to learn the basics of trend-following strategies.
The visual simplicity of the color-coded line helps novice traders quickly understand market direction without the need to interpret complex data.
- **Educational Value:** The indicator serves as an excellent starting point for those new to technical analysis, providing a practical example of how moving averages work in a real-world trading environment.
#### Combining the Indicator with Other Tools
1. **Relative Strength Index (RSI):**
- The RSI is a momentum oscillator that measures the speed and change of price movements. When combined with the Uptrick: Trend SMA Oscillator, traders can look for instances where the RSI shows divergence from the price while the oscillator confirms the trend. This can be a powerful signal of an impending reversal or continuation.
2. **Moving Average Convergence Divergence (MACD):**
- The MACD is another popular trend-following momentum indicator. By using it alongside the Uptrick: Trend SMA Oscillator, traders can confirm the strength of a trend and identify potential entry and exit points with greater confidence. For example, a bullish crossover on the MACD that coincides with the Uptrick: Trend SMA Oscillator turning green can be a strong buy signal.
3. **Volume Indicators:**
- Volume is often considered the fuel behind price movements. Using volume indicators like the On-Balance Volume (OBV) or Volume Weighted Average Price (VWAP) in conjunction with the Uptrick: Trend SMA Oscillator can help traders confirm the validity of a trend. A trend identified by the oscillator that is supported by increasing volume is typically more reliable.
4. **Fibonacci Retracement:**
- Fibonacci retracement levels are used to identify potential reversal levels in a trending market. When the Uptrick: Trend SMA Oscillator indicates a trend, traders can use Fibonacci retracement levels to find potential entry points that align with the broader trend direction.
#### Implementation in Different Market Conditions
1. **Trending Markets:**
- The Uptrick: Trend SMA Oscillator excels in trending markets, where it provides clear signals on the direction of the trend. In a strong uptrend, the line will remain green, helping traders stay in the trade for longer periods. In a downtrend, the red line will signal the continuation of bearish conditions, prompting traders to stay short or avoid long positions.
2. **Sideways or Range-Bound Markets:**
- In range-bound markets, where price oscillates within a confined range without a clear trend, the Uptrick: Trend SMA Oscillator may produce more frequent changes in color. While this could indicate potential reversals at the range boundaries, traders should be cautious of false signals. It may be beneficial to pair the oscillator with a volatility indicator to better navigate such conditions.
3. **Volatile Markets:**
- In highly volatile markets, where prices can swing rapidly, the sensitivity of the Uptrick: Trend SMA Oscillator can be adjusted by modifying the SMA periods. A shorter SMA period might capture quick trends, but traders should be aware of the increased risk of whipsaws. Combining the oscillator with a volatility filter or using it in a higher time frame might help mitigate some of this risk.
#### Final Thoughts
The "Uptrick: Trend SMA Oscillator" is a versatile, easy-to-use indicator that stands out for its simplicity, visual clarity, and adaptability. It provides traders with a straightforward method to identify and follow market trends, using the well-established concept of moving averages. The indicator’s customizable nature makes it suitable for a wide range of trading styles, from day trading to long-term investing, and across various asset classes.
By offering immediate visual feedback through color-coded signals, the Uptrick: Trend SMA Oscillator simplifies the decision-making process, allowing traders to focus on execution rather than interpretation. Whether used on its own or as part of a broader technical analysis toolkit, this indicator has the potential to enhance trading strategies and improve overall performance.
Its accessibility and ease of use make it particularly appealing to novice traders, while its adaptability and reliability ensure that it remains a valuable tool for more experienced market participants. As markets continue to evolve, the Uptrick: Trend SMA Oscillator remains a timeless tool, rooted in the fundamental principles of technical analysis, yet flexible enough to meet the demands of modern trading.

ChartArt-Bankniftybuying5minName: ChartArt-BankNifty Buying Strategy (5-Minute)
Timeframe: 5-Minute Candles
Asset: BankNifty (Indian Stock Market Index)
Trading Hours: 9:30 AM - 2:45 PM IST (Indian Standard Time)
This strategy is designed for BankNifty intraday traders who want to capitalize on short-term price movements within a defined trading window. It combines technical indicators like Simple Moving Averages (SMA), Relative Strength Index (RSI), and candlestick patterns to identify potential buy signals during intraday downtrends. The strategy employs specific entry, stop-loss, and target conditions to manage trades effectively and minimize risk.
Technical Indicators Used
Simple Moving Averages (SMA):
EMA7: 7-period SMA on closing price.
EMA5: 5-period SMA on closing price.
Purpose: Used to identify the intraday trend by comparing short-term moving averages. The strategy focuses on situations where the market is in a minor downtrend, indicated by EMA5 being below EMA7.
Relative Strength Index (RSI):
RSI14: 14-period RSI, a momentum oscillator that measures the speed and change of price movements.
SMA14: 14-period SMA of the RSI.
Purpose: RSI is used to identify potential reversal points. The strategy looks for situations where the RSI is below its own moving average, suggesting weakening momentum in the downtrend.
Candlestick Patterns:
Relaxed Hammer or Doji (2nd Candle): A pattern where the second candle in a 3-candle sequence shows a potential reversal signal (Hammer or Doji), indicating indecision or a potential turning point.
Bearish 1st Candle: The first candle is bearish, setting up the context for a potential reversal.
Bullish 3rd Candle: The third candle must be bullish with specific characteristics (closing near the high, surpassing the previous high), confirming the reversal.
Strategy Conditions
Time Condition:
The strategy is only active during specific hours (9:30 AM to 2:45 PM IST). This ensures that trades are only taken during the most liquid hours of the trading day, avoiding potential volatility or lack of liquidity towards market close.
Intraday Downtrend Condition:
EMA5 < EMA7: Indicates that the market is in a minor downtrend. The strategy looks for reversal opportunities within this trend.
RSI Condition:
RSI14 <= SMA14: Indicates that the current RSI value is below its 14-period SMA, suggesting potential weakening momentum, which can precede a reversal.
Candlestick Patterns:
1st Candle: Must be bearish, setting up the context for a potential reversal.
2nd Candle: Must either be a Hammer or Doji, indicating a potential reversal pattern.
3rd Candle: Must be bullish, with specific characteristics (closing near the high, breaking the previous high, etc.), confirming the reversal.
RSI Crossover Condition:
A crossover of the RSI over its SMA in the last 5 periods is also checked, adding further confirmation to the reversal signal.
Entry and Exit Rules
Entry Signal:
A buy signal is generated when all the conditions (time, intraday downtrend, bearish 1st candle, hammer/doji 2nd candle, bullish 3rd candle, and RSI condition) are met. The trade is entered at the high of the bullish third candle.
Stop Loss:
The stop loss is calculated based on the difference between the entry price and the low of the second candle. If this difference is greater than 90 points, the stop loss is placed at the midpoint of the second candle's range (average of high and low). Otherwise, it is placed at the low of the second candle.
Target 1:
The first target is set at 1.8 times the difference between the entry price and the stop loss. When this target is hit, half of the position is exited to lock in partial profits.
Target 2:
The second target is set at 3 times the difference between the entry price and the stop loss. The remaining position is exited at this point, or if the price hits the stop loss.
Originality and Usefulness
This strategy is original in its combination of multiple technical indicators and candlestick patterns to identify potential reversals in a specific intraday timeframe. By focusing on minor downtrends and utilizing a 3-candle reversal pattern, the strategy seeks to capture quick price movements with a structured approach to risk management.
Key Benefits:
High Precision: The strategy’s multi-step filtering process (time condition, trend confirmation, candlestick pattern analysis, and momentum evaluation via RSI) increases the likelihood of accurate trade signals.
Risk Management: The use of a dynamic stop-loss based on candle characteristics, combined with partial profit-taking, allows traders to lock in profits while still giving the trade room to develop further.
Structured Approach: The strategy provides a clear, rule-based system for entering and exiting trades, which can help remove emotional decision-making from the trading process.
Charts and Signals
The strategy produces signals in the form of labels on the chart:
Buy Signal: A green label is plotted below the candle that meets all entry conditions, indicating a potential buy opportunity.
Stop Loss (SL): A red dashed line is drawn at the stop-loss level with a label indicating "SL".
Target 1 (1st TG): A blue dashed line is drawn at the first target level with a label indicating "1st TG".
Target 2 (2nd TG): Another blue dashed line is drawn at the second target level with a label indicating "2nd TG".
These visual aids help traders quickly identify entry points, stop loss levels, and target levels on the chart, making the strategy easy to follow and implement.
Backtesting and Optimization
Backtesting: The strategy can be backtested on TradingView using historical data to evaluate its performance. Traders should consider testing across different market conditions to ensure the strategy's robustness.
Optimization: Parameters such as the RSI period, moving averages, and target multipliers can be optimized based on backtesting results to refine the strategy further.
Conclusion
The ChartArt-BankNifty Buying Strategy offers a well-rounded approach to intraday trading, focusing on capturing reversals in minor downtrends. With a strong emphasis on technical analysis, precise entry and exit rules, and robust risk management, this strategy provides a solid framework for traders looking to engage in intraday trading on BankNifty.

AI-Powered Breakout with Advanced FeaturesDescription
This script is designed to detect breakout moments in financial markets using a combination of traditional breakout detection methods and adaptive moving averages. By leveraging elements of artificial intelligence, the script provides a more dynamic and responsive approach to identifying potential entry and exit points in trading.
Usefulness
This script stands out by integrating a traditional breakout finder with an adaptive moving average component. The adaptive moving average adjusts dynamically based on the differences between fast and slow exponential moving averages (EMAs), offering a more flexible and responsive detection of support and resistance levels. This combination aims to reduce false signals and enhance the reliability of breakout detections, making it a valuable tool for traders seeking to capture market movements more effectively.
Features
1. Breakout Detection: Utilizes pivot highs and lows to identify significant breakout points over a user-defined period. This method helps in capturing the essential support and resistance levels that are critical in breakout trading.
2. AI Machine Learning Component - Adaptive Moving Average: Implements an adaptive moving average using two exponential moving averages (EMAs). adaptiveMA is dynamically adjusted based on the difference between a fast average and a slow average.
3. Buy/Sell Signals: The script generates buy and sell signals when bullish and bearish breakouts occur, respectively. These signals are visually represented on the chart, helping traders to quickly identify potential trading opportunities.
4. Visualization: Draws horizontal lines at identified breakout levels and plots shapes (arrows) on the chart to indicate buy/sell signals. This makes it easy for traders to see where significant breakout points are and where to consider entering or exiting trades.
Underlying Concepts
1. Breakout Finder Logic: The script uses pivot points (highs and lows) to detect breakout levels. It stores these pivot points in arrays and monitors them for persistence, ensuring that the detected breakouts are significant and reliable.
2. Adaptive Moving Average (AMA): The AMA is a key component that enhances the script's responsiveness. By calculating the differences between fast and slow EMAs, the AMA adapts to changing market conditions, providing a more accurate measure of trends and potential reversals.
How to Use
• Adjustable Parameters: The script includes several user-adjustable parameters:
o Lookback Length: Defines the period over which the script calculates the highest high and lowest low for breakout detection.
o Multiplier for Adaptive MA: Adjusts the sensitivity of the adaptive moving average.
o Period for Pivots: Sets the period for detecting pivot highs and lows.
o Max Breakout Length: Specifies the maximum length for breakout consideration.
o Threshold Rate: Determines the threshold rate for breakout validation.
o Minimum Number of Tests: Sets the minimum number of tests required to validate a breakout.
o Colors and Line Style: Customize the colors and line styles for breakout levels.
Interpreting Signals
o Green Arrows: Indicate a bullish breakout signal, suggesting a potential buy opportunity.
o Red Arrows: Indicate a bearish breakout signal, suggesting a potential sell opportunity.
o Horizontal Lines: Show the breakout levels, helping to visualize support and resistance areas.
By combining traditional breakout detection with advanced adaptive moving averages, this script aims to provide traders with a robust tool for identifying and capitalizing on market breakouts.
Credits
Parts of this script were inspired and adapted from the "Breakout Finder" script by LonesomeTheBlue. Significant improvements include the integration of the adaptive moving average component and enhancements to the breakout detection logic.

GL LineIntroduction
The GL Line Indicator is a versatile tool designed to assist traders in identifying market trends by utilizing three different types of moving averages (EMA, SMA, VWMA) across multiple timeframes. This indicator provides a comprehensive view of market conditions, making it easier to spot potential trading opportunities.
Features
Multiple Moving Average Types:
Choose between Exponential Moving Average (EMA), Simple Moving Average (SMA), and Volume Weighted Moving Average (VWMA) for more tailored analysis.
Triple Timeframe Analysis:
Analyze trends across three different timeframes (Main, Secondary, Tertiary) to get a clearer picture of market direction.
Configurable Parameters:
Customizable lengths for fast and slow-moving averages. Adjustable ATR length and multiplier to refine trend detection sensitivity.
Visual Trend Indication:
Bullish and bearish trends are marked with color-coded lines and fills, enhancing visual clarity.
Confluence Table:
Optional confluence table that shows trend direction across the selected timeframes, aiding in decision-making.
How It Works
Main Trend Calculation:
Select the type of moving average and set the lengths for fast and slow MAs. The difference between these MAs, adjusted by the ATR multiplier, determines the trend direction.
Secondary and Tertiary Trends:
Similar calculations are done for secondary and tertiary timeframes, providing a broader market overview.
Trend Direction and Plotting:
The indicator plots the moving averages and fills the area between them with colors to denote bullish (green) and bearish (red) trends.
How to Use
Select Moving Average Type:
Choose between EMA, SMA, or VWMA based on your trading strategy.
Set Lengths and Multipliers:
Customize the lengths for the fast and slow-moving averages and adjust the ATR length and multiplier for better trend sensitivity.
Analyze Trends:
Use the color-coded plots and fills to identify market trends and make informed trading decisions.
Check Confluence Table:
Optionally display the confluence table to see trend directions across different timeframes.
Disclaimer
This indicator is designed to work best when the secondary and tertiary trends are set to higher timeframes than the chart's timeframe. Using higher timeframes for additional trends provides a broader market perspective and enhances the reliability of trend signals.

US M2### Relevance and Functionality of the "US M2" Indicator
#### Relevance
The "US M2" indicator is relevant for several reasons:
1. **Macro-Economic Insight**: The M2 money supply is a critical indicator of the amount of liquidity in the economy. Changes in M2 can significantly impact financial markets, including equities, commodities, and cryptocurrencies.
2. **Trend Identification**: By analyzing the M2 money supply with moving averages, the indicator helps identify long-term and short-term trends, providing insights into economic conditions and potential market movements.
3. **Trading Signals**: The indicator generates bullish and bearish signals based on moving average crossovers and the difference between current M2 values and their moving averages. These signals can be useful for making informed trading decisions.
#### How It Works
1. **Data Input**:
- **US M2 Money Supply**: The indicator fetches the US M2 money supply data using the "USM2" symbol with a monthly resolution.
2. **Moving Averages**:
- **50-Period SMA**: Calculates the Simple Moving Average (SMA) over 50 periods (months) to capture short-term trends.
- **200-Period SMA**: Calculates the SMA over 200 periods to identify long-term trends.
3. **Difference Calculation**:
- **USM2 Difference**: Computes the difference between the current M2 value and its 50-period SMA to highlight deviations from the short-term trend.
4. **Amplification**:
- **Amplified Difference**: Multiplies the difference by 100 to make the deviations more visible on the chart.
5. **Bullish and Bearish Conditions**:
- **Bullish Condition**: When the current M2 value is above the 50-period SMA, indicating a positive short-term trend.
- **Bearish Condition**: When the current M2 value is below the 50-period SMA, indicating a negative short-term trend.
6. **Short-Term SMA of Amplified Difference**:
- **14-Period SMA**: Applies a 14-period SMA to the amplified difference to smooth out short-term fluctuations and provide a clearer trend signal.
7. **Plots and Visualizations**:
- **USM2 Plot**: Plots the US M2 data for reference.
- **200-Period SMA Plot**: Plots the long-term SMA to show the broader trend.
- **Amplified Difference Histogram**: Plots the amplified difference as a histogram with green bars for bullish conditions and red bars for bearish conditions.
- **SMA of Amplified Difference**: Plots the 14-period SMA of the amplified difference to track the trend of deviations.
8. **Moving Average Cross Signals**:
- **Bullish Cross**: Plots an upward triangle when the 50-period SMA crosses above the 200-period SMA, signaling a potential long-term uptrend.
- **Bearish Cross**: Plots a downward triangle when the 50-period SMA crosses below the 200-period SMA, signaling a potential long-term downtrend.
### Summary
The "US M2" indicator provides a comprehensive view of the US M2 money supply, highlighting significant trends and deviations. By combining short-term and long-term moving averages with amplified difference analysis, it offers valuable insights and trading signals based on macroeconomic liquidity conditions.

Uptrick:Intensity IndexPurpose:
The "Uptrick: Intensity Index" strategy is designed to provide traders with insights into the trend intensity of security by combining multiple moving averages and their relative positions. This versatile tool can be used effectively by both short-term and long-term traders to identify potential buy and sell signals based on specific conditions.
Explanation:
Input Parameters and Customization:
Moving Averages Lengths:
Adjust MA1, MA2, and MA3 lengths to change the calculation periods for the moving averages.
Trend Intensity Index SMA Length:
Adjust the length of the SMA applied to the TII.
Plot Colors:
Change the colors of the TII and TII MA plots for better visualization.
Background Colors and Transparency:
Set different colors for positive and negative TII MA values.
Control the transparency of the background color.
---------------------------------------------------------------------------
MA1 (Length 10): Short-term moving average, useful for capturing short-term market trends.
MA2 (Length 20): Medium-term moving average, providing a balanced view of market trends.
MA3 (Length 50): Long-term moving average, offering insights into long-term market trends.
The script calculates the relative positions of the closing price to each moving average (rel1, rel2, rel3) to determine how far the current price deviates from each average.
Trend Intensity Index (TII):
The TII is calculated as the average of the relative positions (rel1, rel2, rel3), multiplied by 100 to convert it into a percentage. This index reflects the overall intensity of the trend, considering short-term, medium-term, and long-term perspectives.
The TII is plotted in blue, providing a visual representation of trend intensity.
SMA of TII:
An additional SMA is applied to the TII (matii) to smooth out fluctuations and provide a clearer long-term trend signal.
The SMA of TII is plotted in orange, offering a reference for long-term trend analysis.
Determining Potential Price Movements:
For Short-Term Traders:
When the blue TII line crosses above the orange SMA of TII line, it indicates a potential buy signal.
When the blue TII line crosses below the orange SMA of TII line, it indicates a potential sell signal.
For Long-Term Traders:
When the orange SMA of TII line crosses above the highlighted 0 line, it indicates a potential buy signal.
When the orange SMA of TII line crosses below the highlighted 0 line, it indicates a potential sell signal.
Plotting and Visualization:
The TII and its SMA are plotted with distinct colors for easy identification.
A horizontal line at 0 is plotted in gray to serve as a reference point for long-term trend signals.
The background color changes based on the value of the SMA of TII (matii):
Green background for matii values above 0, indicating bullish conditions.
Red background for matii values below 0, indicating bearish conditions.
Utility and Potential Usage:
The "Uptrick: Intensity Index" indicator is a powerful tool for both short-term and long-term traders, offering clear buy and sell signals based on the crossover of the TII and its SMA, as well as the position of the SMA relative to the zero line.
By consolidating multiple moving averages and their relative positions into a single indicator, traders can gain comprehensive insights into market trends and intensity.
The ability to adjust all inputs and toggle visibility options enhances the flexibility and utility of the indicator, making it suitable for various trading styles and market conditions.
Through its versatile design and advanced features, the "Uptrick: Intensity Index" indicator equips traders with actionable insights into trend intensity and potential price movements. By integrating this robust tool into their trading strategies, traders can navigate the markets with greater precision and confidence, thereby enhancing their trading outcomes.
WHAT SETTINGS TO HAVE FOR THE MOVING AVERAGE:
Short-term traders (day traders) might prefer a shorter SMA length (e.g., 5-20 periods) as they are looking for quick signals and react to price changes more rapidly.
Medium-term traders (swing traders) might opt for a medium SMA length (e.g., 20-50 periods) which can filter out some noise and provide a clearer signal on the trend.
Long-term traders (position traders) might choose a longer SMA length (e.g., 50-200 periods) to get a broader view of the market trend and avoid reacting to short-term fluctuations.

Six T3 Bands – Set to Any Time Frame [1000X]Script Description: Six T3 Bands – Set to Any Time Frame
This script leverages T3 lines, an advanced form of moving averages, to provide more adaptive and responsive indicators compared to traditional Moving Averages (MA) or Exponential Moving Averages (EMA). The T3 indicator, originally conceptualized by Tim Tillson in 1998, is known for its smoothness and reduced lag, making it a powerful tool for traders seeking precise market signals.
Features:
1 Adjustable Parameters:
◦ The script allows for the customization of six different T3 lines, each with adjustable lengths and "b values" (smoothing coefficients). This flexibility lets users fine-tune the indicators to fit various trading styles and market conditions.
◦ Users can set the reference timeframe for the T3 lines using the request.security function, enabling analysis across different timeframes. By default, the timeframe is set to the daily chart.
2 Calculation Method:
◦ The T3 lines are calculated using a multi-stage Exponential Moving Average (EMA) process. Specifically, the price data is smoothed through six stages of EMA calculations, with coefficients applied to produce the final T3 value. This method ensures the T3 lines are smoother and less laggy than traditional moving averages.
3 Usage:
◦ The T3 lines can be utilized to identify natural support and resistance levels within the market. By observing how the price interacts with these lines, traders can gain insights into potential reversal points or continuation patterns.
◦ The script's default settings are optimized for identifying these levels, but users are encouraged to adjust the parameters to match their specific trading strategies.
How to Use:
1 Customization:
◦ Access the script's settings to adjust the T3 lengths and "b values" for each of the six lines. This customization allows you to tailor the indicator to your preferred sensitivity and responsiveness.
◦ Set the reference timeframe according to your analysis needs. Whether you prefer intraday, daily, or longer-term charts, the T3 lines will remain set to the reference timeframe that you choose, while you focus your attention on the time frame of your choice.
2 Trading Strategies:
◦ Support and Resistance Trading: Use the T3 lines to identify key support and resistance zones. Look for price reactions around these lines to make informed trading decisions.
◦ Trend Confirmation: Combine the T3 lines with other technical indicators to confirm trends and filter out noise. The smoothness of the T3 lines helps in recognizing genuine trend changes.
Conclusion: This script builds on the foundational work of Tim Tillson and the classic T3 Average script by @HPotter (2014). Significant enhancements include making the "b value" an adjustable input and utilizing the request.security function to apply T3 lines to a specified timeframe. These improvements provide traders with greater control and adaptability, enhancing the practical utility of the T3 indicator.
The "Six T3 Bands – Set to Any Time Frame " script offers a useful tool for traders looking to enhance their technical analysis, both to visualize trend direction and to identify likely support and resistance levels. Its adaptive nature and customizable features make it a valuable addition to many trading strategies..

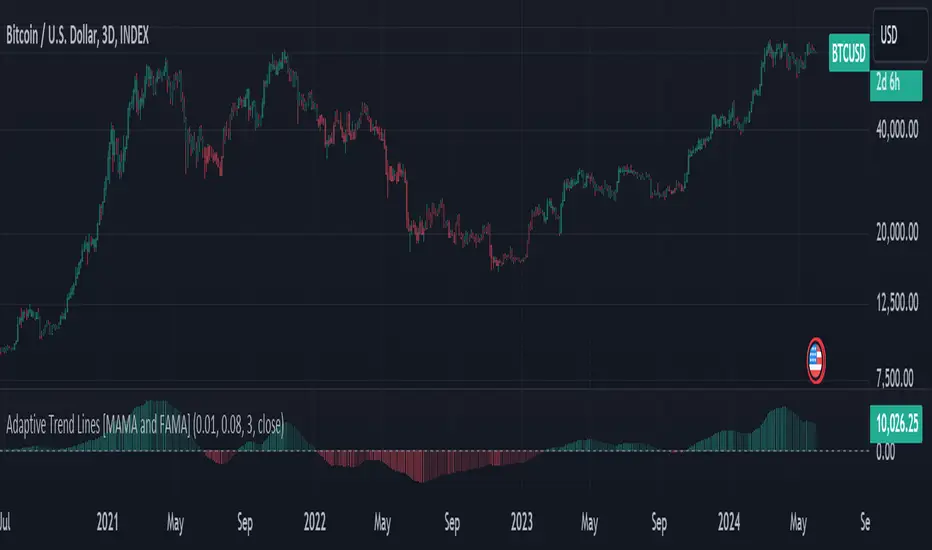
Adaptive Trend Lines [MAMA and FAMA]Updated my previous algo on the Adaptive Trend lines, however I have added new functionalities and sorted out the settings.
You can now switch between normalized and non-normalized settings, the colors have also been updated and look much better.
The MAMA and FAMA
These indicators was originally developed by John F. Ehlers (Stocks & Commodities V. 19:10: MESA Adaptive Moving Averages). Everget wrote the initial functions for these in pine script. I have simply normalized the indicators and chosen to use the Laplace transformation instead of the hilbert transformation
How the Indicator Works:
The indicator employs a series of complex calculations, but we'll break it down into key steps to understand its functionality:
LaplaceTransform: Calculates the Laplace distribution for the given src input. The Laplace distribution is a continuous probability distribution, also known as the double exponential distribution. I use this because of the assymetrical return profile
MESA Period: The indicator calculates a MESA period, which represents the dominant cycle length in the price data. This period is continuously adjusted to adapt to market changes.
InPhase and Quadrature Components: The InPhase and Quadrature components are derived from the Hilbert Transform output. These components represent different aspects of the price's cyclical behavior.
Homodyne Discriminator: The Homodyne Discriminator is a phase-sensitive technique used to determine the phase and amplitude of a signal. It helps in detecting trend changes.
Alpha Calculation: Alpha represents the adaptive factor that adjusts the sensitivity of the indicator. It is based on the MESA period and the phase of the InPhase component. Alpha helps in dynamically adjusting the indicator's responsiveness to changes in market conditions.
MAMA and FAMA Calculation: The MAMA and FAMA values are calculated using the adaptive factor (alpha) and the input price data. These values are essentially adaptive moving averages that aim to capture the current trend more effectively than traditional moving averages.
But Omar, why would anyone want to use this?
The MAMA and FAMA lines offer benefits:
The indicator offers a distinct advantage over conventional moving averages due to its adaptive nature, which allows it to adjust to changing market conditions. This adaptability ensures that investors can stay on the right side of the trend, as the indicator becomes more responsive during trending periods and less sensitive in choppy or sideways markets.
One of the key strengths of this indicator lies in its ability to identify trends effectively by combining the MESA and MAMA techniques. By doing so, it efficiently filters out market noise, making it highly valuable for trend-following strategies. Investors can rely on this feature to gain clearer insights into the prevailing trends and make well-informed trading decisions.
This indicator is primarily suppoest to be used on the big timeframes to see which trend is prevailing, however I am not against someone using it on a timeframe below the 1D, just be careful if you are using this for modern portfolio theory, this is not suppoest to be a mid-term component, but rather a long term component that works well with proper use of detrended fluctuation analysis.
Dont hesitate to ask me if you have any questions
Again, I want to give credit to Everget and ChartPrime!
Code explanation as required by House Rules:
fastLimit = input.float(title='Fast Limit', step=0.01, defval=0.01, group = "Indicator Settings")
slowLimit = input.float(title='Slow Limit', step=0.01, defval=0.08, group = "Indicator Settings")
src = input(title='Source', defval=close, group = "Indicator Settings")
input.float: Used to create input fields for the user to set the fastLimit and slowLimit values.
input: General function to get user inputs, like the data source (close price) used for calculations.
norm_period = input.int(3, 'Normalization Period', 1, group = "Normalized Settings")
norm = input.bool(defval = true, title = "Use normalization", group = "Normalized Settings")
input.int: Creates an input field for the normalization period.
input.bool: Allows the user to toggle normalization on or off.
Color settings in the code:
col_up = input.color(#22ab94, group = "Color Settings")
col_dn = input.color(#f7525f, group = "Color Settings")
Constants and functions
var float PI = math.pi
laplace(src) =>
(0.5) * math.exp(-math.abs(src))
_computeComponent(src, mesaPeriodMult) =>
out = laplace(src) * mesaPeriodMult
out
_smoothComponent(src) =>
out = 0.2 * src + 0.8 * nz(src )
out
math.pi: Represents the mathematical constant π (pi).
laplace: A function that applies the Laplace transform to the source data.
_computeComponent: Computes a component of the data using the Laplace transform.
_smoothComponent: Smooths data by averaging the current value with the previous one (nz function is used to handle null values).
Alpha function:
_computeAlpha(src, fastLimit, slowLimit) =>
mesaPeriod = 0.0
mesaPeriodMult = 0.075 * nz(mesaPeriod ) + 0.54
...
alpha = math.max(fastLimit / deltaPhase, slowLimit)
out = alpha
out
_computeAlpha: Calculates the adaptive alpha value based on the fastLimit and slowLimit. This value is crucial for determining the MAMA and FAMA lines.
Calculating MAMA and FAMA:
mama = 0.0
mama := alpha * src + (1 - alpha) * nz(mama )
fama = 0.0
fama := alpha2 * mama + (1 - alpha2) * nz(fama )
Normalization:
lowest = ta.lowest(mama_fama_diff, norm_period)
highest = ta.highest(mama_fama_diff, norm_period)
normalized = (mama_fama_diff - lowest) / (highest - lowest) - 0.5
ta.lowest and ta.highest: Find the lowest and highest values of mama_fama_diff over the normalization period.
The oscillator is normalized to a range, making it easier to compare over different periods.
And finally, the plotting:
plot(norm == true ? normalized : na, style=plot.style_columns, color=col_wn, title = "mama_fama_diff Oscillator Normalized")
plot(norm == false ? mama_fama_diff : na, style=plot.style_columns, color=col_wnS, title = "mama_fama_diff Oscillator")
Example of Normalized settings:
Example for setup:
Try to make sure the lower timeframe follows the higher timeframe if you take a trade based on this indicator!
Support Resistance & Ema
The "Support Resistance & Ema" indicator combines various strategies to assist traders in identifying significant support and resistance levels on the chart and in following trends through exponential moving averages (EMA). This script is designed to be versatile and useful in different trading strategies.
Key Features:
Support and Resistance: It utilizes pivot highs and lows to pinpoint support and resistance levels. These levels are plotted on the chart with lines that change color based on trend reversals.
Trend Identification: The indicator follows trends using four conditions:
_hh: Higher highs and higher lows, indicating an uptrend.
_ll: Lower highs and lower lows, indicating a downtrend.
_hl: Higher highs and lower lows, indicating weakening uptrend or an impending reversal.
_lh: Lower highs and higher lows, indicating weakening downtrend or an impending reversal.
Exponential Moving Averages (EMA): It also displays various EMAs (9, 21, 50, 100, 200) on the chart to provide further insights into the trend direction.
Usage:
Support and Resistance: Support and resistance lines are automatically plotted on the chart. Trend reversals are highlighted by changing the color of the lines.
Trend Identification: The _hh, _ll, _hl, _lh conditions help identify trend changes. When one of these conditions is met, it indicates a particular configuration of highs and lows that might suggest a trading opportunity.
Exponential Moving Averages (EMA): The EMAs are plotted on the chart and can be used to confirm trends identified by the main indicator.
To use this script, you need to add it as an indicator to your trading chart. Once applied, the support, resistance lines, and EMAs will be visible on the chart, providing traders with valuable information to make informed trading decisions.
In summary, this script offers a comprehensive way to identify significant support and resistance levels, spot market trends, and confirm those trends through the use of exponential moving averages.

Hull AMA SignalsThis script is a comprehensive trading indicator named "Hull AMA Signals", which combines AMA and HSO by LuxAlgo and ther video based strategy techniques to provide buy (long) and sell (short) signals. It overlays directly on the price chart, offering a dynamic and visually intuitive trading aid. The core components of this indicator are Adaptive Moving Averages (AMA), Hull Moving Average (HMA), and a unique Hull squeeze oscillator (HSO), each configured with customizable parameters for flexibility and adaptability to various market conditions.
Features and Components
Adaptive Moving Averages (AMA): This indicator employs two sets of AMAs, each with distinct lengths, multipliers, lags, and overshoot parameters. The AMAs are designed to adapt their sensitivity based on the market's volatility, making them more responsive during significant price movements and less prone to false signals during periods of consolidation.
Hull Moving Average (HMA): The HMA is calculated using a sophisticated algorithm that aims to reduce the lag commonly associated with traditional moving averages. It provides a smoother and more responsive moving average line, which helps in identifying the prevailing market trend more accurately.
Hull Squeeze Oscillator (HSO): A novel component of this indicator, the HSO, is designed to identify potential market breakouts. It does so by comparing the Hull Moving Average's direction and momentum against a dynamically calculated mean, generating bullish or bearish signals based on the crossover and divergence from this mean.
Buy (Long) and Sell (Short) Signals: The script intelligently combines signals from the AMA crossovers and the Hull squeeze oscillator to pinpoint potential buy and sell opportunities. Bullish signals are generated when there's a positive crossover in the AMAs accompanied by a bullish dot from the HSO, whereas bearish signals are indicated by a negative crossover in the AMAs along with a bearish dot from the HSO.
Customization and Style Options: Users have the ability to adjust various parameters such as the length of the moving averages, multipliers, and source data, enabling customization for different trading strategies and asset classes. Additionally, color-coded visual elements like gradients and shapes enhance the readability and instant recognition of trading signals.
Use Cases
Trend Identification: By analyzing the direction and position of the AMAs and HMA, traders can easily discern the prevailing market trend, helping them to align their trades with the market momentum.
Signal Confirmation: The combination of AMA crossovers and HSO signals provides a robust framework for confirming trade entries and exits, potentially increasing the reliability of the trading signals.
Volatility Adaptation: The adaptive nature of the AMAs and the dynamic calculation of the HSO mean allow this indicator to adjust to changing market volatility, making it suitable for a wide range of market environments.
This indicator is suitable for traders looking for a comprehensive and dynamic technical analysis tool that combines trend analysis with signal generation, offering both visual appeal and practical trading utility.

Adaptive Fisherized Z-scoreHello Fellas,
It's time for a new adaptive fisherized indicator of me, where I apply adaptive length and more on a classic indicator.
Today, I chose the Z-score, also called standard score, as indicator of interest.
Special Features
Advanced Smoothing: JMA, T3, Hann Window and Super Smoother
Adaptive Length Algorithms: In-Phase Quadrature, Homodyne Discriminator, Median and Hilbert Transform
Inverse Fisher Transform (IFT)
Signals: Enter Long, Enter Short, Exit Long and Exit Short
Bar Coloring: Presents the trade state as bar colors
Band Levels: Changes the band levels
Decision Making
When you create such a mod you need to think about which concepts are the best to conclude. I decided to take Inverse Fisher Transform instead of normalization to make a version which fits to a fixed scale to avoid the usual distortion created by normalization.
Moreover, I chose JMA, T3, Hann Window and Super Smoother, because JMA and T3 are the bleeding-edge MA's at the moment with the best balance of lag and responsiveness. Additionally, I chose Hann Window and Super Smoother because of their extraordinary smoothing capabilities and because Ehlers favours them.
Furthermore, I decided to choose the half length of the dominant cycle instead of the full dominant cycle to make the indicator more responsive which is very important for a signal emitter like Z-score. Signal emitters always need to be faster or have the same speed as the filters they are combined with.
Usage
The Z-score is a low timeframe scalper which works best during choppy/ranging phases. The direction you should trade is determined by the last trend change. E.g. when the last trend change was from bearish market to bullish market and you are now in a choppy/ranging phase confirmed by e.g. Chop Zone or KAMA slope you want to do long trades.
Interpretation
The Z-score indicator is a momentum indicator which shows the number of standard deviations by which the value of a raw score (price/source) is above or below the mean value of what is being observed or measured. Easily explained, it is almost the same as Bollinger Bands with another visual representation form.
Signals
B -> Buy -> Z-score crosses above lower band
S -> Short -> Z-score crosses below upper band
BE -> Buy Exit -> Z-score crosses above 0
SE -> Sell Exit -> Z-score crosses below 0
If you were reading till here, thank you already. Now, follows a bunch of knowledge for people who don't know the concepts I talk about.
T3
The T3 moving average, short for "Tim Tillson's Triple Exponential Moving Average," is a technical indicator used in financial markets and technical analysis to smooth out price data over a specific period. It was developed by Tim Tillson, a software project manager at Hewlett-Packard, with expertise in Mathematics and Computer Science.
The T3 moving average is an enhancement of the traditional Exponential Moving Average (EMA) and aims to overcome some of its limitations. The primary goal of the T3 moving average is to provide a smoother representation of price trends while minimizing lag compared to other moving averages like Simple Moving Average (SMA), Weighted Moving Average (WMA), or EMA.
To compute the T3 moving average, it involves a triple smoothing process using exponential moving averages. Here's how it works:
Calculate the first exponential moving average (EMA1) of the price data over a specific period 'n.'
Calculate the second exponential moving average (EMA2) of EMA1 using the same period 'n.'
Calculate the third exponential moving average (EMA3) of EMA2 using the same period 'n.'
The formula for the T3 moving average is as follows:
T3 = 3 * (EMA1) - 3 * (EMA2) + (EMA3)
By applying this triple smoothing process, the T3 moving average is intended to offer reduced noise and improved responsiveness to price trends. It achieves this by incorporating multiple time frames of the exponential moving averages, resulting in a more accurate representation of the underlying price action.
JMA
The Jurik Moving Average (JMA) is a technical indicator used in trading to predict price direction. Developed by Mark Jurik, it’s a type of weighted moving average that gives more weight to recent market data rather than past historical data.
JMA is known for its superior noise elimination. It’s a causal, nonlinear, and adaptive filter, meaning it responds to changes in price action without introducing unnecessary lag. This makes JMA a world-class moving average that tracks and smooths price charts or any market-related time series with surprising agility.
In comparison to other moving averages, such as the Exponential Moving Average (EMA), JMA is known to track fast price movement more accurately. This allows traders to apply their strategies to a more accurate picture of price action.
Inverse Fisher Transform
The Inverse Fisher Transform is a transform used in DSP to alter the Probability Distribution Function (PDF) of a signal or in our case of indicators.
The result of using the Inverse Fisher Transform is that the output has a very high probability of being either +1 or –1. This bipolar probability distribution makes the Inverse Fisher Transform ideal for generating an indicator that provides clear buy and sell signals.
Hann Window
The Hann function (aka Hann Window) is named after the Austrian meteorologist Julius von Hann. It is a window function used to perform Hann smoothing.
Super Smoother
The Super Smoother uses a special mathematical process for the smoothing of data points.
The Super Smoother is a technical analysis indicator designed to be smoother and with less lag than a traditional moving average.
Adaptive Length
Length based on the dominant cycle length measured by a "dominant cycle measurement" algorithm.
Happy Trading!
Best regards,
simwai
---
Credits to
@cheatcountry
@everget
@loxx
@DasanC
@blackcat1402

MoonFlag BTC Daily Swing PredictorThis script mainly works on BTC on the daily timeframe. Other coins also show similar usefulness with this script however, BTC on the daily timeframe is the main design for this script.
(Please note this is not trading advice this is just comments about how this indicator works.)
This script is predictive. It colors the background yellow when the script calculates a large BTC swing is potentially about to happen. It does not predict in which direction the swing will occur but it leads the price action so can be useful for leveraged trades. When the background gets colored with vertical yellow lines - this shows that a largish price swing is probably going to occur.
The scripts also shades bands around the price action that are used to estimate an acceptable volatility at any given time. If the bands are wide that means price action is volatile and large swings are not easily predicted. Over time, with reducing volatility, these price action bands narrow and then at a set point or percentage (%) which can be set in the script settings, the background gets colored yellow. This indicates present price action is not volatile and a large price swing is potentially going to happen in the near future. When price action breaks through the narrowing bands, the background is no longer presented because this is seen as an increase in volatility and a considerable portion of the time, a large sudden drop in price action or momentous gain in price is realized.
This indicator leads price action. It predicts that a swing is possibly going to happen in the near future. As the indicator works on the BTC daily, this means on a day-to-day basis if the bands continually narrow - a breakout is more likely to happen. In order to see how well this indicator works, have a look at the results on the screenshot provided. Note the regions where vertical yellow lines are present on the price action - and then look after these to see if a sizeable swing in price has occurred.
To use this indicator - wait until yellow vertical lines are presented on the BTC daily. Then use your experience to determine which way the price action might swing and consider entering a trade or leveraged trade in this direction. Alternatively wait a while to see in which direction the break-out occurs and considering and attempt to trade with this. Sometimes swings can be unexpected and breakout in one direction before then swinging much larger in the other. Its important to remember/consider that this indicator works on the BTC daily timeframe, so any consideration of entering a trade should be expected to cover a duration over many days or weeks, or possibly months. A large swing is only estimated every several plus months.
Most indicators are based on moving averages. A moving average is not predictive in the sense in that it lags price actions. This indicator creates bands that are based on the momentum of the price action. A change in momentum of price action therefore causes the bands to widen. When the bands narrow this means that the momentum of the price action is steady and price action volatility has converged/reduced over time. With BTC this generally means that a large swing in price action is going to occur as momentum in price action then pick-up again in one direction or another. Trying to view this using moving averages is not easy as a moving average lags price action which means that it is difficult to predict any sudden movements in price action ahead of when they might occur. Although, moving averages will converge over time in a similar manner as the bands calculated by this script. This script however, uses the price action momentum in a predictive manner to estimate where the price action might go based on present price momentum. This script therefore reacts to reduced volatility in price action much faster than a set of moving averages over various timescales can achieve.
MoonFlag

Simple Moving Average CrossoverThis Pine Script is a TradingView script for creating a technical analysis indicator known as a Simple Moving Average Crossover (SMAC). The script visualizes two moving averages on a chart and provides buy and sell signals based on the crossover of these moving averages.
Here's a breakdown of the script:
Input Parameters:
fastLength: The length of the fast/simple moving average.
slowLength: The length of the slow/simple moving average.
Moving Averages Calculation:
fastMA: Calculates the simple moving average with a length of fastLength using the closing prices.
slowMA: Calculates the simple moving average with a length of slowLength using the closing prices.
Plotting:
Plots the fast and slow moving averages on the chart using different colors.
Buy and Sell Signals:
buySignal: Generates a boolean series indicating a buy signal when the fast moving average crosses above the slow moving average.
sellSignal: Generates a boolean series indicating a sell signal when the fast moving average crosses below the slow moving average.
Plotting Signals:
Plots green triangle-up shapes below price bars for buy signals.
Plots red triangle-down shapes above price bars for sell signals.
In summary, this script helps traders visualize potential trend reversals by identifying points where a shorter-term moving average crosses above (buy signal) or below (sell signal) a longer-term moving average. These crossover signals are often used in trend-following strategies to capture potential changes in market direction. Traders can customize the script by adjusting the input parameters to suit their trading preferences.
Webby's Quick & Grateful Dead RSWebby's Quick & Grateful Dead RS combines a Relative Strength Line and Moving Averages to help traders hold a core position in a winning stock by identifying moments of strength and weakness in a stocks advance.
The Relative Strength (RS) line is something many investors are familiar with. It is used to measure a stocks performance versus the S&P 500 (default setting) and is typically calculated by dividing the closing price of the stock by the closing price of the S&P. This means if a stock moves up and the S&P moves down or the stock moves up more than the S&P the RS line will increase, if the stock moves down while the S&P moves up the line will decrease.
While the RS Line by itself is a powerful tool, adding moving averages to the RS line can help better understand trends. This work was done by Mike Webster (Webby) as he tried to reverse engineer how William O'Neil was able to hold some of his biggest winning positions.
This indicator plots the RS line along with two moving averages and clearly labels and alerts the 3 signals shared by Webby:
Quick Break - RS line crosses below the fast moving average
Quicksand - RS line moves lower than it was at the time of the Quick Break
Grateful Dead Break - RS line crosses below the slow moving average
To ensure your chart doesn't get skewed, please use the multiplier in the setting to adjust the vertical offset of the RS line and moving averages.

Price Strength Index + RSI Buy/Sell ZonesThe Price Strength Index + RSI Buy/Sell Zones indicator is a technical analysis tool designed to evaluate the strength of a financial asset's price movement by comparing it with a series of Volume Weighted Moving Averages (VWMAs) of different lengths calculated from historical data.
Hypothesis :
The core hypothesis behind this indicator is that assessing the relationship between the current price and a range of VWMAs with varying lengths can provide valuable insights into the strength and direction of a price trend. Additionally, it incorporates Relative Strength Index (RSI) conditions to further refine potential buy and sell signals.
How It Works :
Multiple VWMA Calculation: The indicator calculates multiple VWMAs, each with a different length, using historical price data and volume. These VWMAs represent weighted moving averages over various periods, helping to capture different aspects of the price trend.
Comparison with Current Price : For each of these VWMAs, the indicator compares the current bar's price with the VWMA value. This comparison is crucial in understanding how the current price relates to historical averages, shedding light on the strength and direction of the prevailing trend.
SMA of Percentage Above VWMA : The indicator calculates the Simple Moving Average (SMA) of the percentage of prices above the various VWMAs over a specified period. This moving average smoothens out the percentage data, providing a clearer trend signal.
Buy and Sell Zones : User-defined upper and lower thresholds for the percentage of prices above the VWMAs are used to define buy and sell zones. When the percentage falls below the lower threshold, it signals a potential buy zone, suggesting a weakening trend. Conversely, when it exceeds the upper threshold, it signifies a potential sell zone, indicating a strengthening trend.
RSI Integration : The RSI is calculated for the selected price source with a specified length. When the SMA of the percentage above VWMAs falls within the buy zone and the RSI is below the lower RSI threshold, it indicates an oversold condition, potentially signaling a buy opportunity. Conversely, when the SMA falls within the sell zone and the RSI is above the upper RSI threshold, it suggests an overbought condition, possibly signaling a sell opportunity.
Color Coding : The indicator employs color-coding to visually represent the buy and sell zones, as well as extreme RSI conditions. Green color denotes the buy zone, red represents the sell zone, and orange lines indicate the median and potential reversal points.
In summary, the Price Strength Index + RSI Buy/Sell Zones indicator leverages multiple VWMAs of different lengths to assess the relationship between current prices and historical moving averages. This comprehensive analysis, coupled with RSI conditions, aids traders in identifying potential buy and sell zones, as well as extreme RSI points within those zones, enhancing the evaluation of price strength and potential trend reversals.

Traders Trend DashboardThe Traders Trend Dashboard (TTD) is a comprehensive trend analysis tool designed to assist traders in making informed trading decisions across various markets and timeframes. Unlike conventional trend-following scripts, TTD goes beyond simple trend detection by incorporating a unique combination of moving averages and a visual dashboard, providing traders with a clear and actionable overview of market trends. Here's how TTD stands out from the crowd:
Originality and Uniqueness:
TTD doesn't rely on just one moving average crossover to detect trends. Instead, it employs a dynamic approach by comparing two moving averages of distinct periods across multiple timeframes. This innovative methodology enhances trend detection accuracy and reduces false signals commonly associated with single moving average systems.
Market Applicability:
TTD is versatile and adaptable to various financial markets, including forex, stocks, cryptocurrencies, and commodities. Its flexibility ensures that traders can utilize it across different asset classes and capitalize on market opportunities.
Optimal Timeframe Utilization:
Unlike many trend indicators that work best on specific timeframes, TTD caters to traders with diverse trading preferences. It offers support for intraday trading (1m, 3m, 5m), short-term trading (15m, 30m, 1h), and swing trading (4h, D, W, M), making it suitable for a wide range of trading styles.
Underlying Conditions and Interpretation:
TTD is particularly effective during trending markets, where its multi-timeframe approach helps identify consistent trends across various time horizons. In ranging markets, TTD can indicate potential reversals or areas of uncertainty when moving averages converge or cross frequently.
How to Use TTD:
1. Timeframe Selection: Choose the relevant timeframes based on your trading style and preferences. Enable or disable timeframes in the settings to focus on the most relevant ones for your strategy.
2. Dashboard Interpretation: The TTD dashboard displays green (🟢) and red (🔴) symbols to indicate the relationship between two moving averages. A green symbol suggests that the shorter moving average is above the longer one, indicating a potential bullish trend. A red symbol suggests the opposite, indicating a potential bearish trend.
3. Confirmation and Strategy: Consider TTD signals as confirmation for your trading strategy. For instance, in an uptrend, look for long opportunities when the dashboard displays consistent green symbols. Conversely, in a downtrend, focus on short opportunities when red symbols dominate.
4. Risk Management: As with any indicator, use TTD in conjunction with proper risk management techniques. Avoid trading solely based on indicator signals; instead, integrate them into a comprehensive trading plan.
Conclusion:
The Traders Trend Dashboard (TTD) offers traders a powerful edge in trend analysis, combining innovation, versatility, and clarity. By understanding its unique methodology and integrating its signals with your trading strategy, you can make more informed trading decisions across various markets and timeframes. Elevate your trading with TTD and unlock a new level of trend analysis precision.
Normalized Adaptive Trend Lines [MAMA and FAMA]These indicators was originally developed by John F. Ehlers (Stocks & Commodities V. 19:10: MESA Adaptive Moving Averages). Everget wrote the initial functions for these in pine script. I have simply normalized the indicators and chosen to use the Laplace transformation instead of the hilbert transformation
How the Indicator Works:
The indicator employs a series of complex calculations, but we'll break it down into key steps to understand its functionality:
LaplaceTransform: Calculates the Laplace distribution for the given src input. The Laplace distribution is a continuous probability distribution, also known as the double exponential distribution. I use this because of the assymetrical return profile
MESA Period: The indicator calculates a MESA period, which represents the dominant cycle length in the price data. This period is continuously adjusted to adapt to market changes.
InPhase and Quadrature Components: The InPhase and Quadrature components are derived from the Hilbert Transform output. These components represent different aspects of the price's cyclical behavior.
Homodyne Discriminator: The Homodyne Discriminator is a phase-sensitive technique used to determine the phase and amplitude of a signal. It helps in detecting trend changes.
Alpha Calculation: Alpha represents the adaptive factor that adjusts the sensitivity of the indicator. It is based on the MESA period and the phase of the InPhase component. Alpha helps in dynamically adjusting the indicator's responsiveness to changes in market conditions.
MAMA and FAMA Calculation: The MAMA and FAMA values are calculated using the adaptive factor (alpha) and the input price data. These values are essentially adaptive moving averages that aim to capture the current trend more effectively than traditional moving averages.
But Omar, why would anyone want to use this?
The MAMA and FAMA lines offer benefits:
The indicator offers a distinct advantage over conventional moving averages due to its adaptive nature, which allows it to adjust to changing market conditions. This adaptability ensures that investors can stay on the right side of the trend, as the indicator becomes more responsive during trending periods and less sensitive in choppy or sideways markets.
One of the key strengths of this indicator lies in its ability to identify trends effectively by combining the MESA and MAMA techniques. By doing so, it efficiently filters out market noise, making it highly valuable for trend-following strategies. Investors can rely on this feature to gain clearer insights into the prevailing trends and make well-informed trading decisions.
This indicator is primarily suppoest to be used on the big timeframes to see which trend is prevailing, however I am not against someone using it on a timeframe below the 1D, just be careful if you are using this for modern portfolio theory, this is not suppoest to be a mid-term component, but rather a long term component that works well with proper use of detrended fluctuation analysis.
Dont hesitate to ask me if you have any questions
Again, I want to give credit to Everget and ChartPrime!

Multi-Band Breakout IndicatorThe Multi-Band Breakout Indicator was created to help identify potential breakout opportunities in the market. It combines multiple bands (ATR-Based and Donchian) and moving averages to provide valuable insights into the underlying trend and potential breakouts. By understanding the calculations, interpretation, parameter adjustments, potential applications, and limitations of the indicator, traders can effectively incorporate it into their trading strategy.
Calculation:
The indicator utilizes several calculations to plot the bands and moving averages. The length parameter determines the period used for the Average True Range (ATR), which measures volatility. A higher length captures a longer-term view of price movement, while a lower length focuses on shorter-term volatility. The multiplier parameter adjusts the distance of the upper and lower bands from the ATR. A higher multiplier expands the bands, accommodating greater price volatility, while a lower multiplier tightens the bands, reflecting lower volatility. The MA Length parameter determines the period for the moving averages used to calculate the trend and trend moving average. A higher MA Length creates a smoother trend line, filtering out shorter-term fluctuations, while a lower MA Length provides a more sensitive trend line.
The Donchian calculations in the Multi-Band Breakout Indicator play a significant role in identifying potential breakout opportunities and providing additional confirmation for trading signals. In this indicator, the Donchian calculations are applied to the trend line, which represents the average of the upper and lower bands. To calculate the Donchian levels, the indicator uses the Donchian Length parameter, which determines the period over which the highest high and lowest low are calculated. A longer Donchian Length captures a broader price range, while a shorter length focuses on more recent price action. By incorporating the Donchian calculations into the Multi-Band Breakout Indicator, traders gain an additional layer of confirmation for breakout signals.
Interpretation:
The Multi-Band Breakout Indicator offers valuable interpretation for traders. The upper and lower bands represent dynamic levels of resistance and support, respectively. These bands reflect the potential price range within which the asset is expected to trade. The trend line is the average of these bands and provides a central reference point for the overall trend. When the price moves above the upper band, it suggests a potential overbought condition and a higher probability of a pullback. Conversely, when the price falls below the lower band, it indicates a potential oversold condition and an increased likelihood of a bounce. The trend moving average further smooths the trend line, making it easier to identify the prevailing direction.
The crossover of the trend line (representing the average of the upper and lower bands) and the trend moving average holds a significant benefit for traders. This crossover serves as a powerful signal for potential trend changes and breakout opportunities in the market. When the trend line crosses above the trend moving average, it suggests a shift in momentum towards the upside, indicating a potential bullish trend. This provides traders with an early indication of a possible upward movement in prices. Conversely, when the trend line crosses below the trend moving average, it indicates a shift in momentum towards the downside, signaling a potential bearish trend. This crossover acts as an early warning for potential downward price movement. By identifying these crossovers, traders can capture the initial stages of a new trend, enabling them to enter trades at favorable entry points and potentially maximize their profit potential.
Breakout Signals:
For bullish breakouts, the indicator looks for a bullish crossover between the trend line and the trend moving average. This crossover suggests a shift in momentum towards the upside. Additionally, it checks if the current price has broken above the upper band and the previous Donchian high. This confirms that the price is surpassing a previous resistance level, indicating further upward movement.
For bearish breakouts, the indicator looks for a bearish crossunder between the trend line and the trend moving average. This crossunder indicates a shift in momentum towards the downside. It also checks if the current price has broken below the lower band and the previous Donchian low. This confirms that the price is breaking through a previous support level, signaling potential downward movement.
When a bullish or bearish breakout is detected, it suggests a potential trading opportunity. Traders may consider initiating positions in the direction of the breakout, anticipating further price movement in that direction. However, it's important to remember that breakouts alone do not guarantee a successful trade. Other factors, such as market conditions, volume, and confirmation from additional indicators, should be taken into account. Risk management techniques should also be implemented to manage potential losses.
Coloration:
The coloration in the Multi-Band Breakout Indicator is used to visually represent different aspects of the indicator and provide valuable insights to traders. Let's break down the coloration components:
-- Trend/Basis Color : The tColor variable determines the color of the bars based on the relationship between the trend line (trend) and the closing price (close), as well as the relationship between the trend line and the trend moving average (trendMA). If the trend line is above the closing price and the trend moving average is also above the closing price, the bars are colored fuchsia, indicating a potential bullish trend. If the trend line is below the closing price and the trend moving average is also below the closing price, the bars are colored lime, indicating a potential bearish trend. If neither of these conditions is met, the bars are colored yellow, representing a neutral or indecisive market condition.
-- Moving Average Color : The maColor variable determines the color of the filled area between the trend line and the trend moving average. If the trend line is above the trend moving average, the area is filled with a lime color with 70% opacity, indicating a potential bullish trend. Conversely, if the trend line is below the trend moving average, the area is filled with a fuchsia color with 70% opacity, indicating a potential bearish trend. This coloration helps traders visually identify the relationship between the trend line and the trend moving average.
-- highColor and lowColor : The highColor and lowColor variables determine the colors of the high Donchian band (hhigh) and the low Donchian band (llow), respectively. These bands represent dynamic levels of resistance and support. If the highest point in the previous Donchian period (hhigh) is above the upper band, the highColor is set to olive with 90% opacity, indicating a potential resistance level. On the other hand, if the lowest point in the previous Donchian period (llow) is below the lower band, the lowColor is set to red with 90% opacity, suggesting a potential support level. These colorations help traders quickly identify important price levels and assess their significance in relation to the bands.
By incorporating coloration, the Multi-Band Breakout Indicator provides visual cues to traders, making it easier to interpret the relationships between various components and assisting in identifying potential trend changes and breakout opportunities. Traders can use these color cues to quickly assess the prevailing market conditions and make informed trading decisions.
Adjusting Parameters:
The Multi-Band Breakout Indicator offers flexibility through parameter adjustments. Traders can customize the indicator based on their preferences and trading style. The length parameter controls the sensitivity to price changes, with higher values capturing longer-term trends, while lower values focus on shorter-term price movements. By adjusting the parameters, such as the ATR length, multiplier, Donchian length, and MA length, traders can customize the indicator to suit different timeframes and trading strategies. For shorter timeframes, smaller values for these parameters may be more suitable, while longer timeframes may require larger values.
Potential Applications:
The Multi-Band Breakout Indicator can be applied in various trading strategies. It helps identify potential breakout opportunities, allowing traders to enter trades in the direction of the breakout. Traders can use the indicator to initiate trades when the price moves above the upper band or below the lower band, confirming a potential breakout and providing a signal to enter a trade. Additionally, the indicator can be combined with other technical analysis tools, such as support and resistance levels, candlestick patterns, or trend indicators, to increase the probability of successful trades. By incorporating the Multi-Band Breakout Indicator into their trading approach, traders can gain a better understanding of market trends and capture potential profit opportunities.
Limitations:
While the Multi-Band Breakout Indicator is a useful tool, it has some limitations that traders should consider. The indicator performs best in trending markets where price movements are relatively strong and sustained. During ranging or choppy market conditions, the indicator may generate false signals, leading to potential losses. It is crucial to use the indicator in conjunction with other analysis techniques and risk management strategies to enhance its effectiveness. Additionally, traders should consider external factors such as market news, economic events, and overall market sentiment when interpreting the signals generated by the indicator.
By combining multiple bands and moving averages, this indicator offers valuable insights into the underlying trend and helps traders make informed trading decisions. With customization options and careful interpretation, this indicator can be a valuable addition to any trader's toolkit, assisting in identifying potential breakouts, capturing profitable trades, and enhancing overall trading performance.

HK Percentile Interpolation One
This script is designed to execute a trading strategy based on Heikin Ashi candlesticks, moving averages, and percentile levels.
Please note that you should keep your original chart in normal candlestick mode and not switch it to Heikin Ashi mode. The script itself calculates Heikin Ashi values from regular candlesticks. If your chart is already in Heikin Ashi mode, the script would be calculating Heikin Ashi values based on Heikin Ashi values, which would produce incorrect results.
The strategy begins trading from a start date that you can specify by modifying the `startDate` parameter. The format of the date is "YYYY MM DD". So, for example, to start the strategy from January 1, 2022, you would set `startDate = timestamp("2022 01 01")`.
The script uses Heikin Ashi candlesticks, which are plotted in the chart. This approach can be useful for spotting trends and reversals more easily than with regular candlestick charts. This is particularly useful when backtesting in TradingView's "Rewind" mode, as you can see how the Heikin Ashi candles behaved at each step of the strategy.
Buy and sell signals are generated based on two factors:
1. The crossing over or under of the Heikin Ashi close price and the 75th percentile price level.
2. The Heikin Ashi close price being above certain moving averages.
You have the flexibility to adjust several parameters in the script, including:
1. The stop loss and trailing stop percentages (`stopLossPercentage` and `trailStopPercentage`). These parameters allow the strategy to exit trades if the price moves against you by a certain percentage.
2. The lookback period (`lookback`) used to calculate percentile levels. This determines the range of past bars used in the percentile calculation.
3. The lengths of the two moving averages (`yellowLine_length` and `purplLine_length`). These determine how sensitive the moving averages are to recent price changes.
4. The minimum holding period (`holdPeriod`). This sets the minimum number of bars that a trade must be kept open before it can be closed.
Please adjust these parameters according to your trading preferences and risk tolerance. Happy trading!
