Simple Breakout Zones MTFSimple Breakout Zones MTF
Overview
The "Simple Breakout Zones MTF" indicator is designed to help traders identify key breakout and rejection zones using multi-timeframe (MTF) analysis. By calculating high and low zones based on both close and high/low data, this indicator provides a comprehensive view of market movements. It is ideal for traders looking to spot potential trend reversals, breakouts, or rejections with added flexibility through MTF support and customizable tolerance modes.
Key Features
Multi-Timeframe (MTF) Support: Analyze data from different timeframes for both Close Mode and HL (High/Low) Mode to gain a broader market perspective.
Tolerance Modes: Choose from three tolerance options—ATR, Percent, or Fixed—to adjust the sensitivity of breakout and rejection signals.
Zone Visualization: Easily identify high and low zones with filled areas, making it simple to spot potential breakout or rejection levels.
Breakout and Rejection Detection: Detects breakouts and rejections for both Close and HL modes, with specific conditions to ensure accurate signals.
Custom Alerts: Set up alerts for various scenarios, including when both modes agree on a breakout or rejection, or when only one mode triggers a signal.
Multi-Timeframe (MTF) and Higher Timeframe (HTF) Utility
The Multi-Timeframe (MTF) and Higher Timeframe (HTF) modes are powerful features that significantly enhance the indicator’s versatility and effectiveness. By enabling MTF/HTF analysis, traders can integrate data from multiple timeframes—such as daily, weekly, or monthly—into a single chart, regardless of the timeframe they are currently viewing. This capability is invaluable for understanding the bigger picture of market behavior. For instance, a trader working on a 15-minute chart can leverage HTF data from a daily chart to identify overarching trends, critical support and resistance levels, or potential reversal zones that would otherwise remain hidden on shorter timeframes. This multi-layered perspective is especially beneficial for swing traders, position traders, or anyone employing strategies that require alignment with longer-term market movements.
Additionally, the MTF/HTF functionality allows traders to filter out noise and false signals often present in lower timeframes. For example, a breakout signal on a 1-hour chart gains greater significance when confirmed by HTF analysis showing a similar breakout on a 4-hour or daily timeframe. This confluence increases confidence in trade setups and reduces the likelihood of acting on fleeting market fluctuations. Whether used to spot macro trends, validate trade entries, or time exits with precision, the MTF/HTF modes make this indicator a robust tool for adapting to various trading styles and market conditions.
Non-Repainting Indicator
A standout advantage of this indicator is its non-repainting nature, which applies fully to the MTF and HTF modes. Unlike repainting indicators that retroactively alter their signals, this indicator locks in its calculated levels and zones once a bar closes on the chosen timeframe—whether it’s the current chart’s timeframe or a higher one selected via MTF/HTF settings. This reliability is critical for traders who depend on consistent historical data for strategy development and backtesting. For example, a support zone identified on a daily timeframe using HTF mode will remain unchanged in the past, present, and future, ensuring that what you see in a backtest mirrors what you would have experienced in real-time trading. This non-repainting feature fosters trust in the indicator’s signals, making it a dependable choice for both discretionary and systematic traders seeking accurate, reproducible results.
How It Works
The indicator calculates the highest and lowest values over a specified period (length) for both close prices (Close Mode) and high/low prices (HL Mode). These calculations can be performed on the current timeframe or a higher timeframe using MTF settings. The high and low zones are created by taking the maximum and minimum of the Close and HL levels, respectively.
Breakouts: A breakout occurs when the price closes beyond the calculated levels for both modes or just one, depending on the alert condition.
Rejections: A rejection is detected when the price touches the zone but fails to close beyond it, indicating potential resistance or support.
Tolerance is applied to the rejection logic to account for minor price fluctuations and can be customized using ATR, a percentage of the price, or a fixed value.
Usage Instructions
1. Input Settings
Use MTF for Close Mode?: Enable this option to analyze Close Mode data from a higher timeframe. When enabled, the indicator will use the specified 'Close Mode Timeframe' for calculations.
Close Mode Timeframe: Select the timeframe for Close Mode analysis (e.g., 'D' for daily). This allows you to incorporate longer-term close price data into your analysis.
Use MTF for HL Mode?: Enable this option to analyze HL (High/Low) Mode data from a higher timeframe. When enabled, the indicator will use the specified 'HL Mode Timeframe' for calculations.
HL Mode Timeframe: Select the timeframe for HL Mode analysis. This enables you to consider longer-term high and low price levels.
Source: Choose the data source for calculations (default is 'close').
Length: Set the lookback period for calculating the highest and lowest values.
Tolerance Mode: Select how tolerance is calculated—'ATR', 'Percent', or 'Fixed'.
ATR Length: Set the ATR period if using ATR tolerance.
ATR Multiplier: Adjust the multiplier for ATR-based tolerance.
Tolerance % of Price: Set the percentage for Percent tolerance.
Fixed Tolerance (Points): Set a fixed tolerance value in points.
2. Visual Elements
High Zone: A filled area (aqua) between the highest levels of Close Max and HL Max.
Low Zone: A filled area (orange) between the lowest levels of Close Min and HL Min.
Close Max/Min: Green and red crosses indicating the highest and lowest close prices over the specified length.
HL Max/Min: Green and red crosses indicating the highest high and lowest low prices over the specified length.
3. Alerts
The indicator provides several alert conditions to notify you of potential trading opportunities:
Both Modes New High: Triggers when both Close and HL modes agree on a new high, indicating a strong breakout signal upward.
Both Modes New Low: Triggers when both modes agree on a new low, indicating a strong breakout signal downward.
Both Modes Rejection: Triggers when both modes agree on a rejection, suggesting strong resistance or support.
Close Mode New High: Triggers when only Close Mode indicates a new high, useful for early breakout signals upward.
Close Mode New Low: Triggers when only Close Mode indicates a new low, useful for early breakout signals downward.
Weak Rejection Up: Triggers when only one mode indicates a rejection upward, signaling a weaker but noteworthy resistance.
Weak Rejection Down: Triggers when only one mode indicates a rejection downward, signaling a weaker but noteworthy support.
Why Use This Indicator?
Enhanced Market Insight: Combining data from multiple timeframes and modes provides a more complete picture of market dynamics.
Customizable Sensitivity: Adjust tolerance settings to fine-tune the indicator for different market conditions or trading styles.
Clear Visual Cues: Filled zones and plotted levels make it easy to spot key areas of interest on the chart.
Versatile Alerts: Tailor alerts to capture both strong and subtle market movements, ensuring you never miss a potential opportunity.
Reliable Signals: The non-repainting nature of the indicator ensures that the signals and zones are consistent and trustworthy, both in backtesting and live trading.
Поиск скриптов по запросу "backtest"
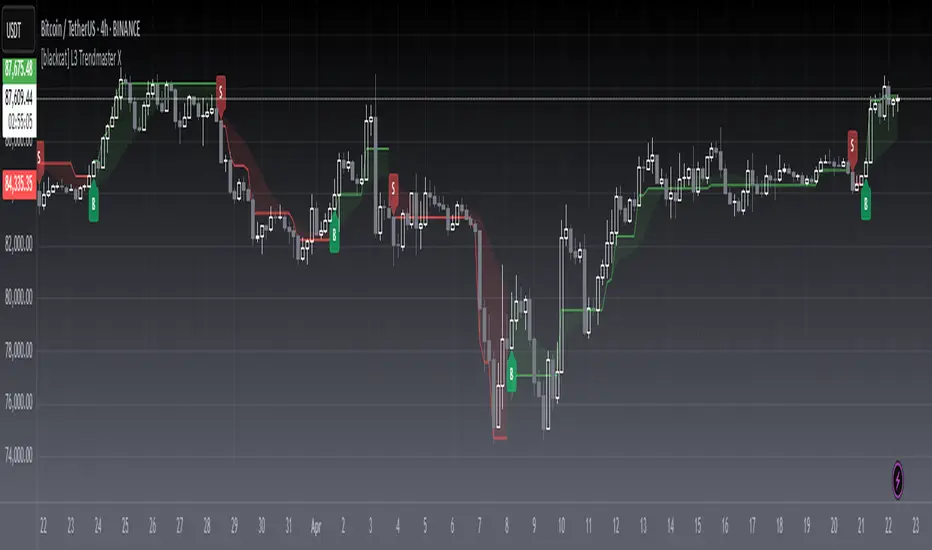
[blackcat] L3 Trendmaster XOVERVIEW
The L3 Trendmaster X is an advanced trend-following indicator meticulously crafted to assist traders in identifying and capitalizing on market trends. This sophisticated tool integrates multiple technical factors, including Average True Range (ATR), volume dynamics, and price spreads, to deliver precise buy and sell signals. By plotting dynamic trend bands directly onto the chart, it offers a comprehensive visualization of potential trend directions, enabling traders to make informed decisions swiftly and confidently 📊↗️.
FEATURES
Customizable Input Parameters: Tailor the indicator to match your specific trading needs with adjustable settings:
Trendmaster X Multiplier: Controls the sensitivity of the ATR-based levels.
Trendmaster X Period: Defines the period over which the ATR is calculated.
Window Length: Specifies the length of the moving window for standard deviation calculations.
Volume Averaging Length: Determines how many periods are considered for averaging volume.
Volatility Factor: Adjusts the impact of volatility on the trend bands.
Core Technical Metrics:
Dynamic Range: Measures the range between high and low prices within each bar.
Candle Body Size: Evaluates the difference between open and close prices.
Volume Average: Assesses the cumulative On-Balance Volume relative to the dynamic range.
Price Spread: Computes the standard deviation of the price ranges over a specified window.
Volatility Factor: Incorporates volatility into the calculation of trend bands.
Advanced Trend Bands Calculation:
Upper Level: Represents potential resistance levels derived from the ATR multiplier.
Lower Level: Indicates possible support levels using the same ATR multiplier.
High Band and Low Band: Dynamically adjust to reflect current trend directions, offering a clear view of market sentiment.
Visual Representation:
Plots distinct green and red trend lines representing bullish and bearish trends respectively.
Fills the area between these trend lines and the middle line for enhanced visibility.
Displays clear buy ('B') and sell ('S') labels on the chart for immediate recognition of trading opportunities 🏷️.
Alert System:
Generates real-time alerts when buy or sell conditions are triggered, ensuring timely action.
Allows customization of alert messages and frequencies to align with individual trading strategies 🔔.
HOW TO USE
Adding the Indicator:
Open your TradingView platform and navigate to the "Indicators" section.
Search for " L3 Trendmaster X" and add it to your chart.
Adjusting Settings:
Fine-tune the input parameters according to your preferences and trading style.
For example, increase the Trendmaster X Multiplier for higher sensitivity during volatile markets.
Decrease the Window Length for shorter-term trend analysis.
Monitoring Trends:
Observe the plotted trend bands and labels on the chart.
Look for buy ('B') labels at potential support levels and sell ('S') labels at resistance levels.
Setting Up Alerts:
Configure alerts based on the generated buy and sell signals.
Choose notification methods (e.g., email, SMS) and set alert frequencies to stay updated without constant monitoring 📲.
Combining with Other Tools:
Integrate the Trendmaster X with other technical indicators like Moving Averages or RSI for confirmation.
Utilize fundamental analysis alongside the indicator for a holistic approach to trading.
Backtesting and Optimization:
Conduct thorough backtests on historical data to evaluate performance.
Optimize parameters based on backtest results to enhance accuracy and reliability.
Real-Time Application:
Apply the optimized settings to live charts and monitor real-time signals.
Execute trades based on confirmed signals while considering risk management principles.
LIMITATIONS
Market Conditions: The indicator might produce false signals in highly volatile or sideways-trending markets due to increased noise and lack of clear direction 🌪️.
Complementary Analysis: Traders should use this indicator in conjunction with other analytical tools to validate signals and reduce the likelihood of false positives.
Asset-Specific Performance: Effectiveness can vary across different assets and timeframes; therefore, testing on diverse instruments is recommended.
NOTES
Data Requirements: Ensure adequate historical data availability for accurate calculations and reliable signal generation.
Demo Testing: Thoroughly test the indicator on demo accounts before deploying it in live trading environments to understand its behavior under various market scenarios.
Parameter Customization: Regularly review and adjust parameters based on evolving market conditions and personal trading objectives.
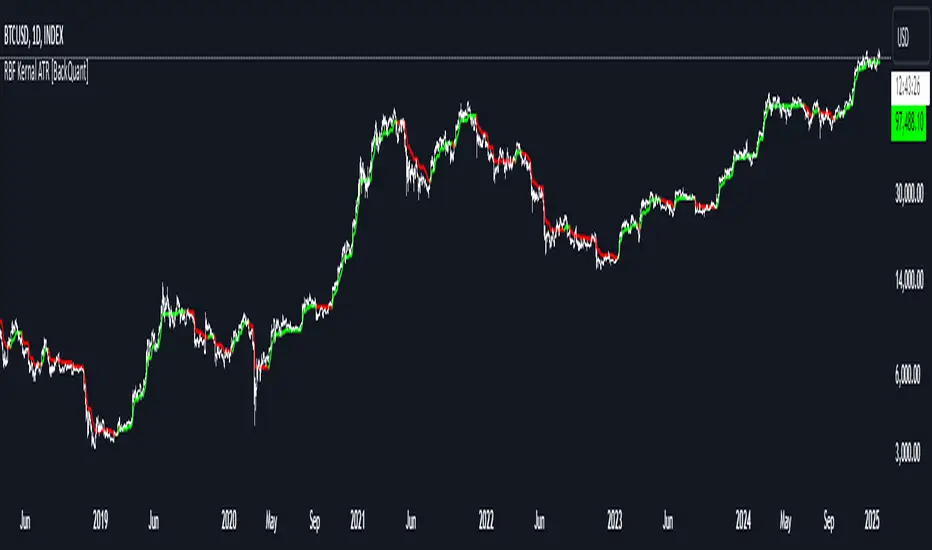
Radial Basis Kernal ATR [BackQuant]Radial Basis Kernel ATR
The Radial Basis Kernel ATR is a trading indicator that combines the classic Average True Range (ATR) with advanced Radial Basis Function (RBF) kernel smoothing . This innovative approach creates a highly adaptive and precise tool for detecting volatility, identifying trends, and providing dynamic support and resistance levels.
With its configurable parameters and ability to adjust to market conditions, this indicator offers traders a robust framework for making informed decisions across various assets and timeframes.
Key Feature: Radial Basis Function Kernel Smoothing
The Radial Basis Function (RBF) kernel is at the heart of this indicator, applying sophisticated mathematical techniques to smooth price data and calculate an enhanced version of ATR. By weighting data points dynamically, the RBF kernel ensures that recent price movements are given appropriate emphasis without overreacting to short-term noise.
The RBF kernel uses a gamma factor to control the degree of smoothing, making it highly adaptable to different asset classes and market conditions:
Gamma Factor Adjustment :
For low-volatility data (e.g., indices), a smaller gamma (0.05–0.1) ensures smoother trends and avoids overly sharp responses.
For high-volatility data (e.g., cryptocurrencies), a larger gamma (0.1–0.2) captures the increased price fluctuations while maintaining stability.
Experimentation is Key : Traders are encouraged to backtest and visually compare different gamma values to find the optimal setting for their specific asset and strategy.
The gamma factor dynamically adjusts based on the variance of the source data, ensuring the indicator remains effective across a wide range of market conditions.
Average True Range (ATR) with Dynamic Bands
The ATR is a widely used volatility measure that captures the degree of price movement over a specific period. This indicator enhances the traditional ATR by integrating the RBF kernel, resulting in a smoothed and adaptive ATR calculation.
Dynamic bands are created around the RBF kernel output using a user-defined ATR factor , offering valuable insights into potential support and resistance zones. These bands expand and contract based on market volatility, providing a visual representation of potential price movement.
Moving Average Confluence
For additional confirmation, the indicator includes the option to overlay a moving average on the smoothed ATR. Traders can choose from several moving average types, such as EMA , SMA , or Hull , and adjust the lookback period to suit their strategy. This feature helps identify broader trends and potential confluence areas, making the indicator even more versatile.
Long and Short Trend Detection
The indicator provides long and short signals based on the directional movement of the smoothed ATR:
Long Signal : Triggered when the ATR crosses above its previous value, indicating bullish momentum.
Short Signal : Triggered when the ATR crosses below its previous value, signaling bearish momentum.
These trend signals are visually highlighted on the chart with green and red bar coloring (optional), providing clear and actionable insights.
Customization Options
The Radial Basis Kernel ATR offers extensive customization options, allowing traders to tailor the indicator to their preferences:
RBF Kernel Settings
Source : Select the price data (e.g., close, high, low) used for the kernel calculation.
Kernel Length : Define the lookback period for the RBF kernel, controlling the smoothing effect.
Gamma Factor : Adjust the smoothing sensitivity, with smaller values for smoother trends and larger values for responsiveness.
ATR Settings
ATR Period : Set the period for ATR calculation, with shorter periods capturing more short-term volatility and longer periods providing a broader view.
ATR Factor : Adjust the scaling of ATR bands for dynamic support and resistance levels.
Confluence Settings
Moving Average Type : Choose from various moving average types for additional trend confirmation.
Moving Average Period : Define the lookback period for the moving average overlay.
Visualization
Trend Coloring : Enable or disable bar coloring based on trend direction (green for long, red for short).
Background Highlighting : Add optional background shading to emphasize long and short trends visually.
Line Width : Customize the thickness of the plotted ATR line for better visibility.
Alerts and Automation
To help traders stay on top of market movements, the indicator includes built-in alerts for trend changes:
Kernel ATR Trend Up : Triggered when the ATR indicates a bullish trend.
Kernel ATR Trend Down : Triggered when the ATR signals a bearish trend.
These alerts ensure traders never miss important opportunities, providing timely notifications directly to their preferred device.
Suggested Gamma Values
The effectiveness of the gamma factor depends on the asset type and the selected kernel length:
Low Volatility Assets (e.g., indices): Use a smaller gamma factor (approximately 0.05–0.1) for smoother trends.
High Volatility Assets (e.g., crypto): Use a larger gamma factor (approximately 0.1–0.2) to capture sharper price movements.
Experimentation : Fine-tune the gamma factor using backtests or visual comparisons to optimize for specific assets and strategies.
Trading Applications
The Radial Basis Kernel ATR is a versatile tool suitable for various trading styles and strategies:
Trend Following : Use the smoothed ATR and dynamic bands to identify and follow trends with confidence.
Reversal Trading : Spot potential reversals by observing interactions with dynamic ATR bands and moving average confluence.
Volatility Analysis : Analyze market volatility to adjust risk management strategies or position sizing.
Final Thoughts
The Radial Basis Kernel ATR combines advanced mathematical techniques with the practical utility of ATR, offering traders a powerful and adaptive tool for volatility analysis and trend detection. Its ability to dynamically adjust to market conditions through the RBF kernel and gamma factor makes it a unique and indispensable part of any trader's toolkit.
By combining sophisticated smoothing , dynamic bands , and customizable visualization , this indicator enhances the ability to read market conditions and make more informed trading decisions. As always, backtesting and incorporating it into a broader strategy are recommended for optimal results.
Fractalyst Moving Average [Adaptive] | FractalystWhat's the indicator purpose and functionality?
Moving averages are widely used technical indicators in trading.
Typically, they provide reliable entry signals in trending markets but can falter during consolidation periods.
Now, imagine a moving average that adjusts to market conditions.
The Fractalyst Moving Average does just that by adapting to the market's noise level, which is the erratic price movement within trends or consolidation phases.
This indicator incorporates market structure into moving averages to more effectively identify potential market trends.
By dynamically calculating moving averages based on external swing highs and lows, it offers robust trend identification and adapts to different market conditions, giving traders valuable insights into current market condition.
------
How does FRMA react in a trending and consolidating market?
When the market trends, the FRMA adjusts quickly to price movements, closely tracking the trend and positioning itself close to prices. This responsiveness allows it to provide timely signals and effectively capture trends.
However, in consolidating markets where there is little net change in price over time, the FRMA reacts slowly. As consolidation prolongs, the FRMA may even cease to move significantly, appearing non-reactive. This characteristic helps minimize false signals and unnecessary trades during periods of market indecision.
Notice how the FRMA tracks prices closely when the market is trending. When the market begins to consolidate, however, the FRMA becomes relatively unresponsive and stays horizontal.
------
What are the underlying calculations behind FRMA?
Identifying Swing Highs and Lows: FRMA begins by identifying the most recent external swing highs and lows, which are key pivot points in the market's price structure.
Defining Market Structure: It calculates the distance between these external swing levels. When price remains confined between these levels, indicating a horizontal market, it signifies minor intermediate ranges or a lack of clear trend direction.
Adapting to Breaks of Structure: When a new break of structure occurs—such as a significant price movement above a previous swing high or below a swing low—the FRMA updates dynamically.
It adjusts its values to reflect the midpoint (50%) of the distance between the external swing highs and lows.
This adjustment helps the FRMA react promptly to changes in different market environments.
------
How to use the FRMA in trading?
In a trend-following context, the FRMA provides clear signals for trading:
Buying Signal: Look to buy when the FRMA is rising. This indicates that the market is in an uptrend, with prices consistently moving higher. Buying at these points aligns with the trend momentum and increases the likelihood of capturing profitable movements.
Selling Signal: Consider selling when the FRMA is falling. A declining FRMA suggests that the market is in a downtrend, where prices are consistently decreasing. Selling during these periods helps capitalize on downward movements and potential profit-taking opportunities.
Avoiding Trades: Avoid trading when the FRMA appears horizontal and the market is consolidating. This indicates a lack of clear trend direction or significant price movement, which can lead to choppy price action and increased risk of false signals. Waiting for the FRMA to resume a clear trend direction can help avoid unnecessary losses in consolidating markets.
Note: These rules are just examples and may generate numerous false signals. Even when the FRMA is less responsive, it can exhibit frequent changes in direction.
Traders should apply additional filters or confirmatory indicators to refine their trading decisions and mitigate the impact of false signals.
Depending on whether they're employing mean-reversion or trend-following trading styles, traders need to adjust other market filters accordingly.
It's crucial to conduct thorough backtesting using various market conditions and filters to validate and optimize their trading strategies effectively.
This process helps traders identify the settings that best align with their trading goals and market conditions.
------
What makes this moving average unique compared to others?
Yes, it's another moving average, but the Fractalyst Adaptive Moving Average stands out for a compelling reason.
Its calculation is more sophisticated, leveraging market structure to identify potential consolidation and trending environments, similar to conventional moving averages such as SMA and EMA.
------
How does the FRMA's stack up against the other moving averages?
Since markets are always evolving, using adaptive strategy elements like the FRMA certainly makes a whole lot of sense.
However, from a practical standpoint, the only way to find out would be to exhaustively backtest the various moving averages across all markets of interest.
Establishing equivalency between the FRMA and other moving averages may be a little challenging, since the FRMA does not use a single integer value for its lookback period.
Assuming the backtests produced roughly equal results, I’d personally prefer to use the FRMA. Its adaptive qualities give me confidence that the strategy can weather changing market conditions.
------
User-inputs and customizations
------
Terms and Conditions | Disclaimer
Our charting tools are provided for informational and educational purposes only and should not be construed as financial, investment, or trading advice. They are not intended to forecast market movements or offer specific recommendations. Users should understand that past performance does not guarantee future results and should not base financial decisions solely on historical data.
Built-in components, features, and functionalities of our charting tools are the intellectual property of @Fractalyst Unauthorized use, reproduction, or distribution of these proprietary elements is prohibited.
By continuing to use our charting tools, the user acknowledges and accepts the Terms and Conditions outlined in this legal disclaimer and agrees to respect our intellectual property rights and comply with all applicable laws and regulations.

CryptoGraph Entry BuilderA complete system to generate buy & sell signals, based on multiple indicators, timeframes and assets
═════════════════════════════════════════════════════════════════════════
🟣 How it works
This indicator allows you to create buy & sell signals, based on multiple trigger conditions, placed in one easy to use TradingView indicator to produce alerts, backtest, reduce risk and increase profitability. This script is especially designed to be used with the CryptoGraph Strategizer indicator. Signals produced by this indicator, can be used as external input with the CryptoGraph Strategizer, by adding both indicators to your chart and selecting "External Input" as entry source in the inputs of the Strategizer indicator. From that point on, buy & sell signals generated by the Entry Builder, will be used for backtesting.
Each trigger or filtering condition is selectable and able to be combined using the selection boxes.
Trigger or filter conditions can be used on a different timeframes, and with different assets or coin pairs. Make sure to set higher timeframe filters, to a higher timeframe than your chart timeframe.
🟣 How to use
• Add the indicator to your chart
• Select an indicator you woud like to use for entry analysis. Combine more indicators for more entry filtering
• Configure entry conditions per indicator. It is recommended to add and configure one indicator at a time
• Analyse your buy/sell entries
• Connect to CryptoGraph Strategizer as external input source for backtesting purposes
🟣 Indicator Filters
• ATR :
Average True Range (ATR) is a tool used in technical analysis to measure volatility .
Possible options for ATR entry filtering are an ATR value greater/smaller than your input variable for trade entries, or the ATR crossing your input variable for trade entries.
This enables the possibility to only enter positions when the market has a certain degree of volatility .
• ADX :
The Average Directional Index ( ADX ) helps traders determine the strength of a trend, not its actual direction. It can be used to find out whether the
market is ranging or starting a new trend.
Possible options for ADX entry filtering are an ADX value greater/smaller than your input variable for trade entries, or the ADX crossing your input variable for trade entries.
• OBV :
The On Balance Volume indicator (OBV) is used in technical analysis to measure buying and selling pressure. It is a cumulative indicator meaning that on days where price went up, that day's volume is added to the cumulative OBV total.
Possible options for OBV entry filtering are Regular, Hidden or Regular&Hidden divergences. Divergence is when the price of an asset is moving in the opposite direction of a technical indicator, such as an oscillator, or is moving contrary to other data. Divergence warns that the current price trend may be weakening, and in some cases may lead to the price changing direction.
• Moving Average :
Moving Average (MA) is a price based, lagging (or reactive) indicator that displays the average price of a security over a set period of time. A Moving Average is a good way to gauge momentum as well as to confirm trends, and define areas of support and resistance .
Possible options for MA entry filtering are price being above/below Moving Average 1, price crossing up/down Moving Average 1, Moving Average 1 being above/below Moving Average 2 and Moving Average 1 crossing up/down Moving Average 2.
• Supertrend :
Supertrend (ST) is a trend-following indicator based on Average True Range (ATR). The calculation of its single line combines trend detection and volatility . It can be used to detect changes in trend direction and to position stops.
Possible options for ST entry filtering are Supertrend being in upward/downward direction, or Supertrend changing direction.
• RSI :
The Relative Strength Index ( RSI ) is a well versed momentum based oscillator which is used to measure the speed (velocity) as well as the change (magnitude) of directional price movements.
Possible options for RSI entry filtering are RSI being smaller/greater than your input value, or RSI crossing up/down your input value.
• Stochastic RSI :
The Stochastic RSI indicator ( Stoch RSI ) is essentially an indicator of an indicator. It is used in technical analysis to provide a stochastic calculation to the RSI indicator. This means that it is a measure of RSI relative to its own high/low range over a user defined period of time.
Possible options for Stoch RSI entry filtering are Stoch RSI crossing below or above your input value.
• VWAP Bands :
Volume Weighted Average Price ( VWAP ) is a technical analysis tool used to measure the average price weighted by volume . VWAP is typically used with intraday charts as a way to determine the general direction of intraday prices.
We use standard deviations, determined by user input, to create VWAP bands.
Possible options for VWAP long entry filtering are: price being below the lower VWAP band, price crossing back up the lower VWAP band or price crossing down the lower VWAP band.
Possible options for VWAP short entry filtering are: price being above the upper VWAP band, price crossing back down the upper VWAP band, or price crossing up the upper VWAP band.
• Bollinger Bands :
Bollinger Bands (BB) are a widely popular technical analysis instrument created by John Bollinger in the early 1980’s. Bollinger Bands consist of a band of three lines which are plotted in relation to security prices. The line in the middle is usually a Simple Moving Average ( SMA ) set to a period of 20 days (the type of trend line and period can be changed by the trader; however a 20 day moving average is by far the most popular).
Possible options for BB long entry filtering are: price being below the lower Bollinger band , price crossing back up the lower Bollinger band or price crossing down the lower Bollinger band .
Possible options for BB short entry filtering are: price being above the upper Bollinger band , price crossing back down the upper Bollinger band , or price crossing up the upper Bollinger band .
• WaveTrend :
WaveTrend (WT) is a smoothed momentum oscillator which enables it to detect true reversals in an accurate manner.
Possible options for WT entry filtering are: Green/red dots below or above a certain WaveTrend value, Regular Divergence, Hidden Divergence and Regular&Hidden Divergence.

DR/IDR Case Study [TFO]This indicator was made to backtest the DR / IDR concept (Defining Range / Implied Defining Range). There is only one built in DR session, but it can be changed to fit whatever session you like. Just make sure that the beginning time of the Session parameter matches the end time of the Defining Range parameter.
I'm not trying to validate or invalidate the claims of the DR concept, as the sample size of the success rate from this indicator is likely significantly smaller than that of the backtests where the initial success rates were derived. I'm simply sharing this indicator to encourage others to do their own due diligence by collecting their own data before implementing new concepts in their trading. Likewise I'm also making this open source for those who wish to do different kinds of backtesting and extract more value from this concept - for example, what percentage of the time does the session actually close further from the DR after initially closing through the range? Data like this could be good to track for those looking to make a trading model out of the DR concept.
Please note that all times are set to the "America/New_York" time zone by default. Besides the fact that the input times will use New York local time, this also means that they automatically adjust for Daylight Savings (this only impacts areas that do not observe Daylight Savings).

Institutional Dominance & Trapped Trader @MaxMaserati 3.0 Institutional Dominance & Trapped Trader Delta Profile @MaxMaserati 3.0
═════════════════════════════════════════════════════════════
Overview
The IDT Auction Profile is a professional-grade volume order flow analysis tool that reveals where institutional traders hold Positional Advantage and where retail participants are Trapped. Unlike traditional Volume Profile indicators, the IDT Profile integrates Volume Point Delta (VPD) analysis with advanced pattern recognition to identify the exact price levels where profitable institutional positions create support/resistance, and where losing positions are forced to exit.
This indicator answers the critical questions: Who is in profit? Who is trapped? And where will they defend or exit their positions?
═════════════════════════════════════════════════════════════
Core Concept: Dominance vs Trapped Positioning
════════════════════════════════════════════════════════════TThe indicator categorizes all market participants into two strategic positions based on their entry price relative to current market price:
Above Current Price (Resistance Zones)
🔴 Aggressive Sellers in Profit - Sold higher, currently winning. Will defend positions or add to winners.
🟥 Trapped Buyers at Loss - Bought higher, currently losing. Must exit at breakeven, creating resistance.
Below Current Price (Support Zones)
🟢 Aggressive Buyers in Profit - Bought lower, currently winning. Will defend positions or add to winners.
🟩 Trapped Sellers at Loss - Sold lower, currently losing. Must cover at breakeven, creating support.
Maximum Confluence Zones
When Dominant (Profitable) and Trapped (Loss) positions align at the same level, you get the strongest support/resistance zones. These appear as:
🟧 Orange Boxes (Above Price) = Aggressive Sellers + Trapped Buyers = STRONGEST RESISTANCE
🟨 Yellow Boxes (Below Price) = Aggressive Buyers + Trapped Sellers = STRONGEST SUPPORT
═════════════════════════════════════════════════════════════
VOLUME ANALYSIS
═════════════════════════════════════════════════════════════
1. VPD Column (Volume Point Delta)
Net aggressive pressure at each price level (Buying Volume - Selling Volume).
Bullish Delta (Green): Buyers dominated the auction at this level
Bearish Delta (Red): Sellers dominated the auction at this level
Smart Coloring: Automatically highlights institutional patterns (icebergs, absorption, spikes, failed auctions)
2. VPS Column (Volume Point of Sell - ASK Volume)
Aggressive buying volume that "lifted the offer" by hitting ask prices.
Represents participants who paid the ask price to enter long
When price is below this level = These buyers are in profit
When price is above this level = These sellers who got hit are in profit
3. VPB Column (Volume Point of Buy - BID Volume)
Aggressive selling volume that "hit the bid" by taking bid prices.
Represents participants who sold at bid price to enter short
When price is above this level = These sellers are in profit
When price is below this level = These buyers who got hit are in profit
═════════════════════════════════════════════════════════════
🧠 ADVANCED INSTITUTIONAL PATTERNS DETECTION
═════════════════════════════════════════════════════════════
The indicator uses statistical analysis (standard deviation, moving averages, hit counting) to identify institutional footprints:
Failed Auctions ⚡
"BUYERS TRAPPED" or "SELLERS TRAPPED" labels
High volume entered, but price immediately reversed
Creates extreme concentrations of losing positions
Trading Implication: High-probability reversal zones where trapped participants must exit
Volume Spikes 📈📉
Bright green/red bars in VPD column
Volume exceeds average by 2+ standard deviations
Represents aggressive institutional entry
Trading Implication: Potential trend continuation or setup for failed auction
Absorption Zones 🛡️
Yellow/Orange colored bars
Large passive orders absorbing aggressive volume without price movement
Indicates accumulation (bullish) or distribution (bearish)
Trading Implication: Institutional positioning before major moves
Iceberg Orders 🧊
Cyan colored bars with high hit counts
Same price level shows repeated volume without clearing
Reveals hidden institutional limit orders split into small pieces
Trading Implication: Strong liquidity magnets, price often returns here
Volume Exhaustion 💜
Purple colored bars
Sharp volume drop (50%+) after spike
Momentum exhausted, participants depleted
Trading Implication: Potential reversal or consolidation ahead
═════════════════════════════════════════════════════════════
Colors bars based on detected patterns vs simple red/green
═════════════════════════════════════════════════════════════
Yellow = Bullish battles won
Orange = Bearish battles won
Cyan = Iceberg orders
Purple = Large passive orders
Bright Green = Buying spikes
Bright Red = Selling spikes
═════════════════════════════════════════════════════════════
Confluence Scoring ⭐
═════════════════════════════════════════════════════════════
Each price level receives 1-5 stars based on:
Volume spike presence (+2 stars)
Absorption pattern (+1 star)
Large passive orders (+1 star)
Proximity to Value Area (+1 star)
Iceberg detection (+2 stars)
Failed auction (+2 stars)
Minimum Signal Strength filter lets you show only levels with ★3+ confluence for highest-quality signals.
═════════════════════════════════════════════════════════════
📍 Value Area Analysis
═════════════════════════════════════════════════════════════
VAH (Value Area High) - Blue Line
Top of the 70% volume acceptance zone. Price at VAH often rejects downward.
VAL (Value Area Low) - Red Line
Bottom of the 70% volume acceptance zone. Price at VAL often bounces upward.
Trading Applications:
Price outside Value Area → Mean reversion opportunity
Price breaks VA with volume → Trend continuation
Price oscillates within VA → Range-bound, fade extremes
═════════════════════════════════════════════════════════════
EXPECTED PORICE BEHAVIOR AT KEY LEVELS
═════════════════════════════════════════════════════════════
⚠️ IMPORTANT: These are observed behavioral patterns for educational purposes and backtesting research. Always validate with 250-500+ backtest trades before risking capital. Use this indicator to enhance your existing strategy, not as a standalone system.
1. POC Box Zones (Highest Statistical Relevance)
═════════════════════════════════════════════════════════════
🟨 Yellow Boxes (Below Current Price)
Expected Behavior:
Price approaching from above typically encounters buying pressure
Both profitable institutional buyers and trapped short sellers create demand
Common reaction: Price slows, consolidates, or bounces
Failed bounces often lead to rapid breakdown (trapped buyers capitulate)
What Often Happens:
Initial dip into zone → Weak bounce attempt
Second test → Stronger bounce (trapped sellers covering + buyers defending)
Break below → Quick acceleration as both groups exit
Backtesting Focus:
Measure bounce success rate at ★3+ vs ★4-5 zones
Track how often price returns after initial rejection
Compare behavior during trending vs ranging markets
🟧 Orange Boxes (Above Current Price)
Expected Behavior:
Price rallying into zone typically encounters selling pressure
Both profitable institutional sellers and trapped long buyers create supply
Common reaction: Price stalls, consolidates, or rejects
What Often Happens:
Initial push into zone → Weak rejection
Second test → Stronger rejection (trapped buyers exiting + sellers defending)
Break above → Quick acceleration as resistance becomes support
Backtesting Focus:
Measure rejection success rate by confluence score
Track false breakouts vs genuine breakouts
Identify market conditions that favor breakouts vs reversals
2. Failed Auction Zones
═════════════════════════════════════════════════════════════
"SELLERS TRAPPED" Labels (Below Price)
Expected Behavior:
High-volume selling that immediately reversed = maximum trapped short positions
When price returns to this level, trapped sellers face pressure to cover
Typical pattern: Price approaches → Initial hesitation → Sharp bounce
Common Price Action:
First retest: Quick spike through level then immediate recovery
Subsequent retests: Stronger bounces as fewer trapped sellers remain
Level becomes support after trapped positions cleared
Backtesting Focus:
Success rate of bounces on first vs second retest
Time decay: Does signal strength diminish after X bars?
Volume characteristics during successful bounces
"BUYERS TRAPPED" Labels (Above Price)
Expected Behavior:
High-volume buying that immediately failed = maximum trapped long positions
Price returning forces trapped buyers to exit at breakeven
Typical pattern: Price approaches → Distribution → Rejection
Common Price Action:
First retest: Shallow penetration then swift rejection
Multiple retests: Weaker rallies as trapped positions cleared
Level becomes resistance until breakout occurs
Backtesting Focus:
How many retests before level breaks?
Volume profile changes on each successive test
Correlation with broader market direction
3. Value Area Dynamics
═════════════════════════════════════════════════════════════
Price Outside Value Area (VAH/VAL)
Expected Behavior:
Price beyond 70% volume zone = statistical outlier
Two outcomes: Mean reversion OR trend continuation
Key differentiator: Presence of confluence zones
Mean Reversion Pattern (No Strong Confluence):
Price extends 1-2% beyond VA → Typically reverts toward POC
Weak volume on extension → Higher probability of reversal
Price oscillates back into value area over several bars
Breakout Pattern (With ★4+ Confluence):
Price breaks VA with institutional patterns → Often continues
Strong volume + confluence = New value area forming
Old VA becomes reference point for pullbacks
Backtesting Focus:
Success rate of fades based on distance from VA
Confluence requirements for successful breakouts
Time of day / session impact on VA behavior
4. Iceberg Order Behavior
═════════════════════════════════════════════════════════════
Cyan Bars with High Hit Counts
Expected Behavior:
Repeated volume at same level = Large hidden order absorbing
Price typically "tests" iceberg multiple times before resolution
Two outcomes: Absorption complete (break) OR rejection (bounce)
Absorption Phase:
Price approaches → Slows near iceberg → Minimal movement
Volume increases but price range contracts
Acts as temporary support/resistance
Resolution Phase:
Iceberg filled → Sudden acceleration through level
Iceberg defended → Sharp rejection away from level
Post-resolution: Level often becomes support/resistance flip
Backtesting Focus:
Average number of tests before resolution
Volume characteristics when iceberg breaks vs holds
Timeframe impact on iceberg effectiveness
5. Volume Spike Patterns
═════════════════════════════════════════════════════════════
Bright Green/Red Bars (Institutional Aggression)
Expected Behavior:
Extreme delta spikes indicate institutional entry
Two scenarios: Continuation (spike in trend direction) OR Exhaustion (spike against trend)
Trend Continuation Spikes:
Spike + ★4+ confluence + aligned with trend = Often continues
Price may consolidate briefly then resume direction
These levels become support/resistance on pullbacks
Exhaustion Spikes:
Spike against trend + followed by reversal = Failed auction forming
High probability of "TRAPPED" label appearing
Often marks short-term extremes
Backtesting Focus:
Distinguish continuation vs exhaustion spikes
Success rate based on trend alignment
Time holding before reversal occurs
═════════════════════════════════════════════════════════════
💡 Best Practices
═════════════════════════════════════════════════════════════
Start with defaults (200 lookback, 60 rows, ★3 confluence, Classic colors, Smart Coloring ON)
Focus on POC boxes first - These are your highest-probability zones
Combine with price action - Use the profile to explain WHY support/resistance exists
Watch for alignment - Yellow/Orange boxes (both participant types) = strongest levels
Respect failed auctions - "TRAPPED" labels are extreme reversal setups
Use Value Area for context - Price outside VA = opportunity for mean reversion
Trust confluence scores - ★4-5 signals are institutional-grade setups
Adjust timeframe settings - Lower lookback for scalping, higher for position trading
🔧 Technical Notes
Calculation: Enhanced delta using OHLC and volume with wick ratio analysis
Updates: Real-time on every bar close
Performance: Optimized for up to 500 bars lookback and 250 price rows
Compatibility: Works on all symbols and timeframes
Indicator Unique Value
═════════════════════════════════════════════════════════════
Unlike standard Volume Profile indicators that only show where volume occurred,
the IDT Auction Profile:
✅ Separates bid vs ask volume to reveal true order flow
✅ Identifies who is profitable vs who is trapped at each level
✅ Detects institutional patterns (icebergs, absorption, failed auctions)
✅ Calculates confluence scores combining multiple factors
✅ Provides clear POC boxes showing exact institutional positioning
✅ Maps positional advantage rather than just volume density
This transforms Volume Profile from a historical volume chart into a strategic positioning map showing institutional dominance and trapped participants.
How to Integrate with Your Strategy
═════════════════════════════════════════════════════════════
✅ Proper Uses:
Entry refinement within your existing setups
Intelligent stop placement beyond institutional levels
Objective profit targets at next confluence zones
Trade filtering (only take setups at ★4+ zones)
Understanding market positioning before entry
❌ What It Cannot Do:
Predict direction with certainty
Replace risk management
Account for news/external events
Guarantee profitability
Work in all market conditions
Development Path (12-16 Weeks)
Weeks 1-2: Observation Only
Watch price behavior at key levels
Document patterns without trading
Weeks 3-8: Paper Trading
Simulate trades, track all metrics
Minimum 100 paper trades
Weeks 9-16: Small Size Testing
Minimal capital, real market conditions
Continue tracking, refine rules
After Proven Edge: Scale Position Sizing
Critical Disclaimers
⚠️ Past volume ≠ Future price action
⚠️ Institutional positions change rapidly - these are static snapshots
⚠️ No indicator works 100% - risk management is mandatory
⚠️ Market conditions change - adapt your approach
⚠️ Backtest with YOUR style, YOUR timeframe, YOUR risk tolerance
The indicator reveals WHERE institutions are positioned and HOW they might behave. YOU decide IF, WHEN, and HOW to trade that information.
Not financial advice. For educational and research purposes only.

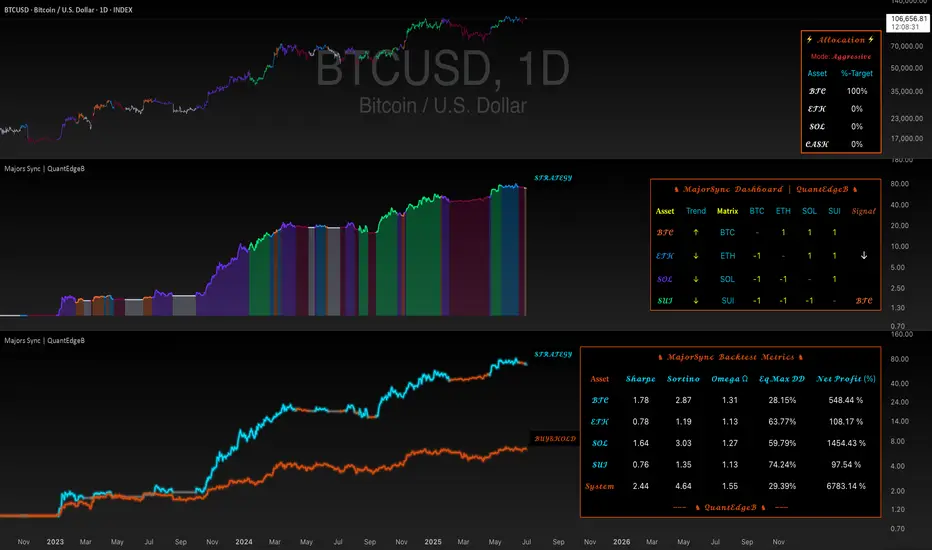
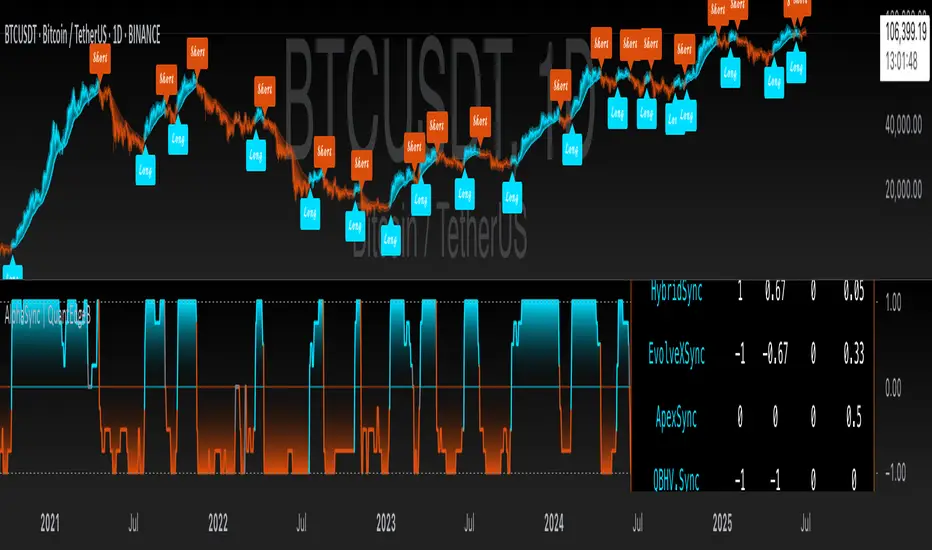
AlphaSync | QuantEdgeB📢 Introducing AlphaSync by QuantEdgeB
🛠️ Overview
AlphaSync is a comprehensive medium-term market guidance system designed for major assets such as BTC, ETH, and SOL. This system helps traders determine the overall market direction by integrating three universal strategies (EvolveXSync, ApexSync, QBHV Sync) and a Hybrid strategy (HybridSync).
🚀 What Makes AlphaSync Unique?
✅ Multi-Strategy Fusion → A robust blend of technical, economic, on-chain, and volatility-driven insights.
✅ HybridSync Component (90% Non-Price Factors) → Incorporates macro and liquidity signals to balance pure price-based models.
✅ Structured Decision-Making → The Trend Confluence score aggregates all sub-strategies, providing a unified market signal.
__________________________________________________________________________________
✨ Key Features
🔹 HybridSync (Hybrid Model)
Utilizes on-chain, economic, liquidity, and volatility factors to provide a fundamental market risk outlook. Unlike technical models, it derives signals primarily from macroeconomic indicators, risk appetite gauges, and capital flows.
🔹 EvolveXSync, & ApexSync (Technical Strategies)
Both strategies are purely price-based, relying on volatility-adjusted trend models, adaptive moving averages, and statistical deviations to confirm bullish or bearish trends.
🔹 QBHV Sync (Momentum & Deviation-Based System)
A fusion of momentum-deviation and a volatility-driven trend confirmation model, designed to detect shifts in momentum while filtering out market noise.
🔹 Trend Confluence (Final Aggregated Signal)
A weighted combination of all four models, delivering a single, structured signal to eliminate conflicting indicators and refine decision-making.
__________________________________________________________________________________
📊 How It Works
1️⃣ HybridSync – Non-Price Market Structure Analysis
HybridSync is an economic and liquidity-based framework, integrating macro variables, credit spreads, volatility indices, capital flows, and on-chain dynamics to assess risk-on/risk-off conditions.
📌 Key Components:
✔ On-Chain Metrics → Tracks investor behavior, exchange flows, and market cap ratios.
✔ Liquidity Indicators → Monitors global money supply (M2), Federal Reserve balance sheet, credit markets, and capital flows.
✔ Volatility & Risk Metrics → Uses MOVE, VIX, VVIX ratios, and bond market stress indicators to identify risk sentiment shifts.
🔹 Why HybridSync?
• Price alone does not dictate the market; macro liquidity and risk factors are often leading indicators of price movement, especially when it comes to risk assets such as cryptocurrencies.
• Improves decision-making in uncertain market environments, particularly during high-volatility or trendless conditions.
2️⃣ EvolveXSync, & ApexSync – Trend-Following & Volatility Models
Both EvolveXSync, & ApexSync are technical strategies, independently designed to capture trend strength and volatility dynamics.
📌 Core Mechanisms:
✔ VIDYA-Based Trend Detection → Adaptive moving averages adjust dynamically to price swings.
✔ SD-Filtered EMA Models → Uses normalized standard deviation levels to confirm trend validity.
✔ ATR-Adjusted Breakout Filters → Prevents false signals by incorporating dynamic volatility assessments.
🔹 Why Two UniStrategies?
• EvolveXSync, & ApexSync have different calculation methods, providing diverse perspectives on trend confirmation.
• Ensures robustness by mitigating overfitting to a single price-based model.
3️⃣ QBHV Sync – Momentum Deviation & Trend Confirmation
This component blends Bollinger Momentum Deviation (BMD) with a percentile-based trend model to confirm trend shifts.
📌 Core Components:
✔ Bollinger Momentum Deviation → A normalized SMA-SD filter detects overbought/oversold conditions.
✔ Percentile-Based Trend Confirmation → Ensures trends align with long-term volatility structure.
✔ Adaptive Signal Filtering → Prevents unnecessary trade signals by refining thresholds dynamically.
🔹 Why QBHV Sync?
• Adds a statistical layer to trend assessment, preventing whipsaws in volatile conditions.
• Complements HybridSync by ensuring price movements align with broader market forces.
4️⃣ Trend Confluence – The Final Aggregated Signal
AlphaSync blends HybridSync, EvolveXSync, ApexSync, and QBHV Sync into one final output.
📌 How It’s Weighted ? Equal Weight to remove any bias and over-reliance on one input.
✔ HybridSync (Macro & On-Chain Factors) → 25% Weight
✔ UniStrat V1 (Pure Trend) → 25% Weight
✔ UniStrat V2 (Trend + ATR) → 25% Weight
✔ QBHV Sync (Momentum & Deviation) → 25% Weight
🔹 Why Merge These Into One System?
The core philosophy behind AlphaSync is to create a holistic, structured decision-making framework that eliminates the weaknesses of single-method trading approaches. Instead of relying solely on technical indicators, which can lag or fail in macro-driven markets, AlphaSync blends price-based trend signals with macroeconomic, liquidity, and risk-adjusted models.
This multi-layered approach ensures that the system:
✔ Adapts dynamically to different market environments.
✔ Eliminates conflicting signals by creating a structured confluence score.
✔ Prevents over-reliance on a single market model, improving robustness.
📌 Final Signal Interpretation:
✅ Long Signal → AlphaSync Score > Long Threshold
❌ Short Signal → AlphaSync Score < Short Threshold
__________________________________________________________________________________
👥 Who Should Use AlphaSync?
✅ Medium-Term Traders & Portfolio Managers → Ideal for traders who require macro-confirmed trend signals.
✅ Systematic & Quantitative Traders → Designed for algorithmic integration and structured decision-making.
✅ Long-Term Position Traders → Helps identify major trend shifts and capital rotation opportunities.
✅ Risk-Conscious Investors → Incorporates macro volatility assessments to minimize unnecessary risk exposure.
__________________________________________________________________________________
📊 Backtest Mode - Evaluating Historical Performance
AlphaSync includes a fully integrated backtest module, allowing traders to assess its historical performance metrics.
🔹 Backtest Metrics Displayed:
✔ Equity Max Drawdown → Measures historical peak loss.
✔ Profit Factor → Evaluates profitability vs. loss ratio.
✔ Sharpe & Sortino Ratios → Risk-adjusted return metrics.
✔ Total Trades & Win Rate → Performance across different market cycles.
✔ Half Kelly Criterion → Optimal position sizing based on historical returns.
📌 Disclaimer:Backtest results are based on past performance and do not guarantee future success. Always incorporate real-time validation and risk management in live trading.
🚀 Why This Matters?
✅ Strategy Validation → See how AlphaSync performs across various market conditions.
✅ Customizable Analysis → Adjust parameters and observe real-time backtest results.
✅ Risk Awareness → Understand potential drawdowns before deploying capital.
Behavior Across Crypto Majors:
BTC
ETH
SOL
📌 Disclaimer: Backtest results are based on historical data and past market behavior. Performance is not indicative of future results and should not be considered financial advice. Always conduct your own backtests and research before making any investment decisions. 🚀
__________________________________________________________________________________
📌 Customization & Default Settings
📌 AlphaSync Input Parameters & Default Values
🔹 Strategy Configuration
• Color Mode → "Strategy"
• Extra Plots → true
• Long/Cash Signal Label → false
• AlphaSync Dashboard → true
• Enable BackTest Table → false
• Enable Equity Curve → false
• Table Position → "Bottom Left"
• Start Date → '01 Jan 2018 00:00'
• AlphaSync Long Threshold → 0.00
• AlphaSync Short Threshold → 0.00
🔹 QBHV.Sync
• DEMA Source → close
• DEMA Length → 14
• Percentile Length → 35
• ATR Length → 14
• Long Multiplier (ATR Up) → 1.8
• Short Multiplier (ATR Down) → 2.5
• Momentum Length → 8
• Momentum Source → close
• Base Length (SMA Calculation) → 40
• Source for BMD → close
• Standard Deviation Length → 30
• SD Multiplier → 0.7
• Long Threshold → 72
• Short Threshold → 59
🔹 EvolveXSync Configuration
• VIDYA Loop Length → 2
• VIDYA Loop Hist Length → 5
• Vidya Loop Long Threshold → 40
• Vidya Loop Short Threshold → 10
• Dynamic EMA Length → 12
• Dynamic EMA SD Length → 30
• Dynamic EMA Upper SD Weight → 1.032
• Dynamic EMA Lower SD Weight → 1.02
• SD Median Length → 12
• Normalized Median Length → 20
• Median SD Length → 30
• Median Long SD Weight → 0.98
• Median Short SD Weight → 1.04
🔹ApexSync Configuration
• DEMA Length → 30
• DEMA ATR Length → 14
• DEMA ATR Multiplier → 1.0
• G-VIDYA Length → 9
• G-VIDYA Hist Length → 30
• VIDYA ATR Length → 14
• VIDYA ATR Multiplier → 1.7
• SD Kijun Length → 24
• Normalized Kijun Length → 50
• KIJUN SD Length → 32
• KIJUN Long SD Weight → 0.98
• KIJUN Short SD Weight → 1.02
🔹 Risk Mosaic (Macro & Liquidity Component)
• Risk Signal Smoothing Length (EMA) → 8
🚀 AlphaSync is fully customizable to match different market conditions and trading styles
🚀 By default, AlphaSync is optimized for structured, medium-term market guidance.
__________________________________________________________________________________
📌 Conclusion
AlphaSync redefines medium-term trend analysis by merging technical, fundamental, and quantitative models into one unified system. Unlike traditional strategies that rely solely on price action, AlphaSync incorporates macroeconomic and liquidity factors, ensuring a more holistic market view.
🔹 Key Takeaways:
1️⃣ Hybrid + Technical Fusion – Balances macro & price-based strategies for stronger decision-making.
2️⃣ Multi-Factor Trend Aggregation – Reduces false signals by merging independent methodologies.
3️⃣ Structured, Data-Driven Approach – Designed for quantitative trading and risk-aware portfolio allocation.
📌 Master the market with precision and confidence | QuantEdgeB
🔹 Disclaimer: Past performance is not indicative of future results. No trading strategy can guarantee success in financial markets.
🔹 Strategic Advice: Always backtest, optimize, and align parameters with your trading objectives and risk tolerance before live trading.
Price Action Analyst [OmegaTools]Price Action Analyst (PAA) is an advanced trading tool designed to assist traders in identifying key price action structures such as order blocks, market structure shifts, liquidity grabs, and imbalances. With its fully customizable settings, the script offers both novice and experienced traders insights into potential market movements by visually highlighting premium/discount zones, breakout signals, and significant price levels.
This script utilizes complex logic to determine significant price action patterns and provides dynamic tools to spot strong market trends, liquidity pools, and imbalances across different timeframes. It also integrates an internal backtesting function to evaluate win rates based on price interactions with supply and demand zones.
The script combines multiple analysis techniques, including market structure shifts, order block detection, fair value gaps (FVG), and ICT bias detection, to provide a comprehensive and holistic market view.
Key Features:
Order Block Detection: Automatically detects order blocks based on price action and strength analysis, highlighting potential support/resistance zones.
Market Structure Analysis: Tracks internal and external market structure changes with gradient color-coded visuals.
Liquidity Grabs & Breakouts: Detects potential liquidity grab and breakout areas with volume confirmation.
Fair Value Gaps (FVG): Identifies bullish and bearish FVGs based on historical price action and threshold calculations.
ICT Bias: Integrates ICT bias analysis, dynamically adjusting based on higher-timeframe analysis.
Supply and Demand Zones: Highlights supply and demand zones using customizable colors and thresholds, adjusting dynamically based on market conditions.
Trend Lines: Automatically draws trend lines based on significant price pivots, extending them dynamically over time.
Backtesting: Internal backtesting engine to calculate the win rate of signals generated within supply and demand zones.
Percentile-Based Pricing: Plots key percentile price levels to visualize premium, fair, and discount pricing zones.
High Customizability: Offers extensive user input options for adjusting zone detection, color schemes, and structure analysis.
User Guide:
Order Blocks: Order blocks are significant support or resistance zones where strong buyers or sellers previously entered the market. These zones are detected based on pivot points and engulfing price action. The strength of each block is determined by momentum, volume, and liquidity confirmations.
Demand Zones: Displayed in shades of blue based on their strength. The darker the color, the stronger the zone.
Supply Zones: Displayed in shades of red based on their strength. These zones highlight potential resistance areas.
The zones will dynamically extend as long as they remain valid. Users can set a maximum number of order blocks to be displayed.
Market Structure: Market structure is classified into internal and external shifts. A bullish or bearish market structure break (MSB) occurs when the price moves past a previous high or low. This script tracks these breaks and plots them using a gradient color scheme:
Internal Structure: Short-term market structure, highlighting smaller movements.
External Structure: Long-term market shifts, typically more significant.
Users can choose how they want the structure to be visualized through the "Market Structure" setting, choosing from different visual methods.
Liquidity Grabs: The script identifies liquidity grabs (false breakouts designed to trap traders) by monitoring price action around highs and lows of previous bars. These are represented by diamond shapes:
Liquidity Buy: Displayed below bars when a liquidity grab occurs near a low.
Liquidity Sell: Displayed above bars when a liquidity grab occurs near a high.
Breakouts: Breakouts are detected based on strong price momentum beyond key levels:
Breakout Buy: Triggered when the price closes above the highest point of the past 20 bars with confirmation from volume and range expansion.
Breakout Sell: Triggered when the price closes below the lowest point of the past 20 bars, again with volume and range confirmation.
Fair Value Gaps (FVG): Fair value gaps (FVGs) are periods where the price moves too quickly, leaving an unbalanced market condition. The script identifies these gaps:
Bullish FVG: When there is a gap between the low of two previous bars and the high of a recent bar.
Bearish FVG: When a gap occurs between the high of two previous bars and the low of the recent bar.
FVGs are color-coded and can be filtered by their size to focus on more significant gaps.
ICT Bias: The script integrates the ICT methodology by offering an auto-calculated higher-timeframe bias:
Long Bias: Suggests the market is in an uptrend based on higher timeframe analysis.
Short Bias: Indicates a downtrend.
Neutral Bias: Suggests no clear directional bias.
Trend Lines: Automatic trend lines are drawn based on significant pivot highs and lows. These lines will dynamically adjust based on price movement. Users can control the number of trend lines displayed and extend them over time to track developing trends.
Percentile Pricing: The script also plots the 25th percentile (discount zone), 75th percentile (premium zone), and a fair value price. This helps identify whether the current price is overbought (premium) or oversold (discount).
Customization:
Zone Strength Filter: Users can set a minimum strength threshold for order blocks to be displayed.
Color Customization: Users can choose colors for demand and supply zones, market structure, breakouts, and FVGs.
Dynamic Zone Management: The script allows zones to be deleted after a certain number of bars or dynamically adjusts zones based on recent price action.
Max Zone Count: Limits the number of supply and demand zones shown on the chart to maintain clarity.
Backtesting & Win Rate: The script includes a backtesting engine to calculate the percentage of respect on the interaction between price and demand/supply zones. Results are displayed in a table at the bottom of the chart, showing the percentage rating for both long and short zones. Please note that this is not a win rate of a simulated strategy, it simply is a measure to understand if the current assets tends to respect more supply or demand zones.
How to Use:
Load the script onto your chart. The default settings are optimized for identifying key price action zones and structure on intraday charts of liquid assets.
Customize the settings according to your strategy. For example, adjust the "Max Orderblocks" and "Strength Filter" to focus on more significant price action areas.
Monitor the liquidity grabs, breakouts, and FVGs for potential trade opportunities.
Use the bias and market structure analysis to align your trades with the prevailing market trend.
Refer to the backtesting win rates to evaluate the effectiveness of the zones in your trading.
Terms & Conditions:
By using this script, you agree to the following terms:
Educational Purposes Only: This script is provided for informational and educational purposes and does not constitute financial advice. Use at your own risk.
No Warranty: The script is provided "as-is" without any guarantees or warranties regarding its accuracy or completeness. The creator is not responsible for any losses incurred from the use of this tool.
Open-Source License: This script is open-source and may be modified or redistributed in accordance with the TradingView open-source license. Proper credit to the original creator, OmegaTools, must be maintained in any derivative works.

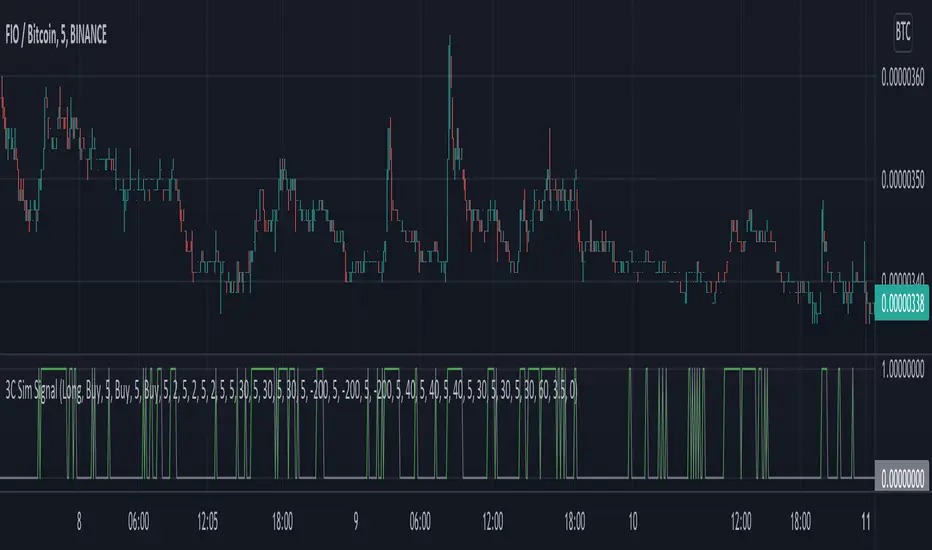
3C Sim SignalThis indicator offers the same deal start conditions available on Backtest script but now as an external signal so you can not only backtest but also set up alerts.
You can use the backtest script to backtest this indicator as an external signal and then once happy with the backtest results send directly tradingview alerts to your own bots on any exchange.
It supports most of the deal start conditions currently available for DCA bots on binance.com for example:
- TV technical ratings: buy, sell, strong buy, strong sell.
- RSI
- MFI
- CCI
- Ultimate Oscilator
- QFL
- min volume filter
Once added to the chart it will plot one when the deal start condition is true and zero when is not.
The conditions can be used in long or short strategy mode.
The biggest advantage compared to using it separately from the DSC already available in the backtest script is that because this is a separated study it will perform faster than the backtest and it resolves repainting issues. This two aspects make these indicator better suited for real time trading while still being able to connect to the backtest as an external indicator therefore still backtestable.
Now you can backtest symbols on any exchange and once your strategy is ready you then can send alerts directly to your bots.
SuperFast M1 - STUDYScript developed for automated trading (autoview).
Start of backtest: Jan 01 2020.
Way of acting:
SMA , EMA and HullMA analysis.
Must be used on the 3 minute chart.
Supports leverage up to x50 with certain security.
-------------------- PT-BR -------------------
Script desenvolvido para trading automatizado (autoview).
Início do backtest: Jan 01 2020.
Forma de atuação:
Analise de SMA , EMA e HullMA.
Deve ser usado no gráfico de 3 minutos.
Suporta alvancagem de até x50 com certa segurança.

Beast Mode PRO v4.0# Beast Mode PRO v4.0 - Advanced Multi-Regime Trading System
## Overview
Beast Mode PRO v4.0 is a sophisticated technical analysis indicator designed for active traders seeking high-probability setups across multiple timeframes. This system combines machine learning-inspired clustering algorithms with traditional technical analysis to identify market regimes and generate precision entry signals. The indicator adapts to different trading styles through intelligent preset configurations and multiple trading modes.
---
## Core Methodology
### Signal Generation Framework
The indicator employs a **multi-component voting system** that analyzes market conditions through several independent technical perspectives:
**Technical Components:**
- **RSI (Relative Strength Index)**: Momentum oscillator measuring overbought/oversold conditions
- **Fisher Transform**: Price transformation technique that normalizes price distributions for clearer turning points
- **DMI (Directional Movement Index)**: Trend strength indicator measuring directional pressure
- **Z-Score Analysis**: Statistical measure identifying price deviations from historical norms
- **Moving Average Ratio**: Price relationship to its moving average baseline
- **MFI (Money Flow Index)**: Volume-weighted momentum indicator
- **Stochastic Oscillator**: Momentum indicator comparing closing price to price range
- **CCI (Commodity Channel Index)**: Measures current price level relative to average price level
### Clustering Engine
The system utilizes a **k-means inspired clustering algorithm** that categorizes each technical indicator's normalized values into distinct market regimes (bullish, bearish, neutral). This approach:
1. **Normalizes** all indicators using z-score transformation over a historical lookback window
2. **Clusters** normalized values using percentile-based thresholds
3. **Aggregates** individual votes into a composite score ranging from -100 to +100
4. **Smooths** the composite score using selectable methods (SMA, EMA, WMA, HMA, TEMA, DEMA)
The clustering percentiles adapt dynamically based on current market volatility (ATR-normalized), ensuring the system remains responsive across different market conditions.
---
## Trading Modes
### 1. Normal Mode
Standard crossover-based signals using fixed thresholds (+10/-10). Suitable for balanced trading with moderate signal frequency.
### 2. Scalper Mode
Dynamic threshold adjustment based on recent score volatility. Generates more frequent signals by adapting to short-term price movements.
### 3. Aggressive Mode
Reversal-focused approach that triggers signals when the composite score crosses extreme levels (+80/-80), targeting major trend reversals.
### 4. Hybrid Mode
Combines Normal and Aggressive signals, capturing both standard crossovers and extreme reversals for comprehensive market coverage.
### 5. Super Scalper Mode
Ultra-responsive mode using signal line crossovers (14-period HMA of composite score) for maximum trade frequency.
### 6. Sniper Mode (Premium Feature)
Multi-confirmation system requiring alignment of:
- Composite score threshold breach
- Positive fast momentum (10-period SMI)
- Positive trend momentum (200-period SMI)
- Price above/below smart trend filter MA
This mode prioritizes precision over frequency, filtering out low-probability setups.
---
## Timeframe Presets
Pre-optimized configurations for common trading timeframes:
### 1 Minute Preset
- Fast smoothing (10-period WMA)
- Tight chop filter (61.8 threshold)
- Optimized for rapid scalping with minimal lag
### 2 Minute Preset
- Balanced smoothing (12-period EMA)
- Enhanced volume filtering
- Moderate cooling period (5 bars)
### 3 Minute Preset
- HMA smoothing for reduced lag
- Stochastic and CCI enabled
- Balanced approach for intraday trading
### 5 Minute Preset
- TEMA smoothing for trend following
- Stronger filters to reduce noise
- Extended lookback (1000 bars)
### 15 Minute Preset
- DEMA smoothing for swing positions
- Maximum filtering configuration
- All technical indicators enabled
- Suitable for swing trading and position building
Users can also select "Custom" to manually configure all parameters.
---
## Advanced Filtering System
### 1. Choppy Market Filter
Uses Choppiness Index calculation to identify consolidating markets. When CI exceeds the threshold, signals are suppressed to avoid whipsaw trades.
### 2. Smart Trend Filter
Configurable moving average (SMA/EMA/WMA/HMA/TEMA/DEMA/VWMA/RMA) that prevents counter-trend signals. Long signals require price above the MA, shorts require price below.
### 3. Volume Filter
Compares current volume to its moving average. Signals are suppressed when volume falls below the specified multiplier of average volume.
### 4. ATR Volatility Filter
Prevents trading during low volatility periods when ATR falls below its moving average multiplied by the specified factor.
### 5. Session Filter
Time-based filtering for Asia, London, New York, or combined sessions. Ensures trading only during preferred market hours.
### 6. Multi-Timeframe Confirmation
Optionally requires higher timeframe alignment before generating signals, adding confluence for higher probability trades.
### 7. Cooling Off Period
Prevents signal clustering by enforcing a minimum number of bars between consecutive signals.
---
## Smart Money Concepts Integration
### Order Block Detection
Identifies institutional supply/demand zones using multi-timeframe analysis:
- Detects strong directional candles followed by breakout moves
- Volume confirmation ensures significance
- Customizable timeframe selection (current TF or higher TF: 5m, 15m, 30m, 1H, Daily)
- Visual boxes mark active order blocks with automatic expiration after lookback period
- Price interaction alerts when touching active zones
### Liquidity Zones
Marks equal highs (EQH) and equal lows (EQL) where stop losses typically cluster, indicating potential reversal or breakout points.
---
## Momentum Analysis
### Fast Momentum (Default: 10-period)
Short-term momentum oscillator using Stochastic Momentum Index (SMI) calculation. Provides early warning of momentum shifts.
### Trend Momentum (Default: 200-period)
Long-term momentum gauge confirming overall trend direction. Used in Sniper Mode for multi-confirmation.
### Momentum Divergence Detection
Automatically identifies:
- **Regular Divergence**: Price makes new high/low but momentum doesn't (reversal signal)
- **Hidden Divergence**: Price makes higher low/lower high but momentum doesn't (continuation signal)
---
## Visual Components
### Price Chart Overlay
- **Smart Trend MA**: Dynamically colored moving average based on price position
- **EMA Cloud**: 50/200 EMA cloud showing long-term trend (background shading)
- **Trend Background**: Subtle background coloring based on composite score
- **Order Block Boxes**: Institutional supply/demand zones
- **Entry/Exit Markers**: Clear visual signals with emoji labels
- **Liquidity Markers**: EQH/EQL identification
### Bar Coloring
Bars change color based on active mode and market regime:
- **Sniper Mode**: Purple (bull) / Pink (bear)
- **Aggressive Mode**: Bright Green / Bright Red
- **Super Scalper**: Neon Green / Neon Red
- **Timeframe Presets**: Unique color schemes per preset
- **Choppy/Neutral**: Always gray regardless of mode
### Oscillator Pane
- **Composite Score Line**: Gradient-colored stepline showing current regime strength
- **Fast/Trend Momentum**: Optional overlays (gold/cyan colors)
- **Divergence Markers**: Visual alerts for regular, hidden, and momentum divergences
- **Power Zones**: Overbought/oversold regions (80/-80 levels)
- **Dynamic/Fixed Thresholds**: Visual reference lines based on active mode
### Interactive Dashboards
**Main Dashboard** displays:
- Active preset/mode configuration
- Real-time indicator values and votes
- Current market status (active/choppy/counter-trend/low volume/low ATR/MTF misalignment)
- Regime classification (Strong Long/Long/Neutral/Short/Strong Short)
- Smart Trend MA status
**Performance Dashboard** shows:
- Exit strategy (Fixed TP/SL, Trailing Stop, Opposite Signal)
- Total trades and win rate
- Total points and average per NY session
- Profit factor and recovery factor
- Best/worst trades and max drawdown
- Maximum winning/losing streaks
- Sharpe ratio and average risk:reward
**TP Optimizer** (33 variations tested):
- Tests take profit levels from 40 to 200 ticks (5-tick increments)
- Sortable by: Profit Factor, Win Rate, Total Points, Sharpe Ratio
- Displays top 5 configurations with full metrics
- Real-time optimization during backtesting
---
## Backtest Engine
### Exit Strategies
**1. Fixed TP/SL**
- Configurable in Ticks, ATR multiples, or Percentage
- Precise risk management with predefined targets
**2. Exit on Opposite Signal**
- Closes position when counter-signal appears
- Adapts to changing market conditions
- Useful for trend-following approaches
**3. Trailing Stop**
- Dynamic stop loss that follows profitable moves
- Configurable trailing offset percentage
- Locks in profits while allowing trends to develop
### Risk Management
- Optional minimum risk:reward filter
- Prevents trades below specified R:R threshold
- Date range filtering for historical analysis
- Session-based performance tracking
### Performance Metrics
- Win rate, profit factor, Sharpe ratio
- Maximum drawdown and recovery factor
- Consecutive win/loss streaks
- Average win/loss analysis
- Gross profit vs gross loss breakdown
---
## Alert System
Comprehensive alert conditions for:
- Entry signals (Long/Short)
- Exit events (TP/SL/Opposite/Trailing)
- Trend signals (Strong bullish/bearish)
- Divergences (Regular/Hidden/Momentum)
- Order block detection and touches
- Multi-condition strong signals (all confirmations aligned)
---
## How to Use
### Quick Start
1. Select your preferred timeframe preset (1m, 2m, 3m, 5m, 15m, or Custom)
2. Choose a trading mode (Normal, Scalper, Aggressive, Hybrid, Super Scalper, or Sniper)
3. Configure session filter to match your trading hours
4. Enable desired filters (choppy, trend, volume, ATR, MTF)
5. Set your exit strategy and TP/SL levels
6. Monitor signals on price chart and oscillator pane
### Optimization Workflow
1. Enable "Run TP Optimizer" in backtest settings
2. Run backtest on historical data
3. Review Optimizer Dashboard for best TP levels
4. Sort by preferred metric (Profit Factor, Win Rate, Total Points, Sharpe)
5. Apply winning configuration to live trading
### Advanced Configuration
- Customize individual indicator lengths and enable/disable specific components
- Adjust clustering parameters (lookback window, percentiles, cluster count)
- Fine-tune smoothing methods and lengths
- Configure order block detection timeframe and sensitivity
- Set cooling off period to control signal frequency
---
## Unique Features
1. **Adaptive Clustering**: Volatility-adjusted percentiles ensure consistent performance across market conditions
2. **Multi-Mode Architecture**: Six distinct trading modes from conservative to ultra-aggressive
3. **Timeframe Intelligence**: Pre-optimized presets eliminate guesswork for common timeframes
4. **Smart Money Integration**: Order block detection and liquidity zone marking
5. **Comprehensive Backtesting**: Three exit strategies with 33-variation TP optimization
6. **Visual Clarity**: Mode-specific bar coloring and clean chart presentation
7. **Filter Stack**: Seven-layer filtering system prevents low-quality signals
8. **Real-Time Metrics**: Live performance tracking with advanced statistics
---
## Benefits
- **Reduced False Signals**: Multi-confirmation clustering approach filters noise
- **Adaptability**: Works across timeframes and market conditions through preset system
- **Transparency**: Open visualization of all component votes and filtering status
- **Risk Management**: Built-in TP/SL optimization and R:R filtering
- **Time Efficiency**: Preset configurations save hours of manual optimization
- **Educational Value**: Dashboard shows exactly why signals trigger or get filtered
- **Professional Tools**: Institutional concepts (order blocks, liquidity zones) accessible to retail traders
---
## Best Practices
- Use Sniper Mode for high-probability setups during volatile markets
- Enable choppy filter during consolidation periods
- Combine Smart Trend Filter with MTF confirmation for swing trades
- Run TP Optimizer monthly to adapt to changing market dynamics
- Monitor Sharpe Ratio in addition to win rate for risk-adjusted performance
- Use session filters to avoid low-liquidity hours
- Start with preset configurations before custom optimization
---
## Technical Requirements
- TradingView Premium/Pro/Pro+ for full feature access
- Minimum chart history: 500 bars (adjustable in clustering settings)
- Works on all instruments (stocks, forex, crypto, futures)
- Compatible with standard candles (Heikin Ashi optional but not recommended for backtesting)
---
## Disclaimer
This indicator is a technical analysis tool designed to assist trading decisions. It does not guarantee profits and should be used in conjunction with proper risk management, fundamental analysis, and personal trading experience. Past performance does not indicate future results. Users should thoroughly test the indicator on demo accounts before live trading.
---
**Version**: 4.0
**Language**: Pine Script v6
**Type**: Overlay Indicator with Oscillator Pane
**Calculation**: On bar close (default) or real-time (configurable)

ICT/SMC DOL Detector PRO (Final)This indicator is designed to operate only on the 1-hour timeframe.
The ICT/SMC DOL Detector PRO is an educational indicator designed to identify and visualize Draw on Liquidity (DOL) levels across multiple time-frames. It tracks unmitigated daily highs and lows, clusters them into zones, and calculates confidence scores based on multiple factors including time decay, cluster size, and time-frame alignment.
This indicator is based on ICT (Inner Circle Trader) concepts and liquidity theory, which suggests that price tends to seek out areas of concentrated unfilled orders before reversing or continuing its trend.
What is a DOL (Draw on Liquidity)?
A Draw on Liquidity represents a daily high or low that has not been revisited (mitigated) by price. These levels act as "magnets" that draw price toward them because:
1. They represent untapped liquidity pools where unfilled orders exist
2. Market makers and institutions often target these levels to fill large orders
3. Price is drawn to these zones to clear pending orders
4. They can serve as potential reversal or continuation zones once liquidity is taken
Methodology
1. Level Tracking
The indicator monitors daily session highs and lows on the 1-hour time-frame, tracking:
- Session high price and time of formation
- Session low price and time of formation
- Whether each level has been breached (mitigated)
- Time elapsed since level formation
2. Clustering Algorithm
Unmitigated levels within a defined tolerance (default 0.5% of price) are grouped together to identify zones where multiple DOLs cluster. Larger clusters indicate stronger liquidity pools.
3. Confidence Scoring (The "AI" Logic)
Each DOL receives a confidence score (0-100%) based on three weighted factors. This is the core "AI" intelligence of the indicator:
**Factor 1: Cluster Size (50% weight)**
- Counts how many unmitigated levels exist within 0.5% of the price zone
- Formula: (levels_in_cluster / total_unmitigated_levels) × 50
- Logic: More unfilled orders clustered together = stronger liquidity pool = higher confidence
- Example: If 5 out of 10 total unmitigated levels cluster at 27,500, cluster score = (5/10) × 50 = 25%
**Factor 2: Time Decay (25% weight)**
- Calculates age of the level since formation
- Fresh levels (< 1 week old): Full 25% score
- Aging penalty: Loses 5% per week of age
- Maximum penalty: 25% (very old levels = 0% time score)
- Formula: max(0, 25 - (weeks_old × 5))
- Logic: Recent liquidity is more relevant than old liquidity that price has ignored for months
**Factor 3: Timeframe Alignment (25% weight)**
- Checks how many timeframes (1H, 4H, D1, W1) point in the same direction
- If multiple timeframes identify DOLs on the same side (all bullish or all bearish): Higher score
- If mixed signals: Lower score
- Formula: (aligned_timeframes / total_timeframes) × 25
- Logic: When multiple timeframes agree, the liquidity zone is validated across different time perspectives
**Total Confidence Score:**
```
Confidence = Cluster_Score + Time_Score + Alignment_Score
= (0-50%) + (0-25%) + (0-25%)
= 0-100%
```
**Example Calculation:**
```
DOL at 27,500:
- 6 out of 12 unmitigated levels cluster here → (6/12) × 50 = 25%
- Level is 2 weeks old → 25 - (2 × 5) = 15%
- 3 out of 4 timeframes bullish toward this level → (3/4) × 25 = 18.75%
- Total Confidence = 25% + 15% + 18.75% = 58.75% ≈ 59%
```
This mathematical approach removes subjectivity and provides objective, data-driven confidence scoring.
4. Multi-Timeframe Analysis
The indicator analyzes DOLs across four timeframes:
- **1H:** Intraday levels (fastest reaction)
- **4H:** Short-term swing levels
- **Daily:** Intermediate-term levels
- **Weekly:** Long-term structural levels
For each timeframe, it identifies:
- Highest confidence unmitigated high
- Highest confidence unmitigated low
- Directional bias (bullish if high > low confidence, bearish if low > high confidence)
5. Primary DOL Selection (AI Auto-Selection Logic)
When "Show AI DOL" is enabled, the indicator uses an automated selection algorithm to identify the most important targets:
**Step 1: Collect All Candidates**
The algorithm gathers all identified DOLs from all timeframes (1H, 4H, D1, W1) that meet minimum criteria:
- Must be unmitigated (not yet swept)
- Must have confidence score > 0%
- Must have at least 1 level in cluster
**Step 2: Calculate Confidence for Each**
Each candidate DOL receives its confidence score using the three-factor formula described above (Cluster + Time + Alignment).
**Step 3: Sort by Confidence**
All candidates are ranked from highest to lowest confidence score.
**Step 4: Select Primary and Secondary**
- **P1 (Primary DOL):** The DOL with the absolute highest confidence score
- **P2 (Secondary DOL):** The DOL with the second highest confidence score
**Why This Matters:**
Instead of manually scanning multiple timeframes and guessing which level is most important, the AI objectively identifies the two highest-probability liquidity targets based on quantifiable data.
**Example AI Selection:**
```
Available DOLs:
- 1H High: 27,400
- 4H High: 27,500
- D1 High: 27,500 ← P1 (Highest)
- W1 High: 27,650 ← P2 (Second Highest)
- 1H Low: 26,800
- D1 Low: 26,500
AI Selection:
P1 = 27,500 (Daily High with 92% confidence)
P2 = 27,650 (Weekly High with 88% confidence)
```
This provides a data-driven target selection rather than subjective manual interpretation. The AI removes emotion and bias, selecting targets based purely on mathematical probability.
Features
Why "AI" DOL?
The term "AI" in this indicator refers to the automated algorithmic selection process, not machine learning or neural networks. Specifically:
**What the AI Does:**
- Automatically evaluates all available DOLs across all timeframes
- Applies a weighted scoring algorithm (Cluster 50%, Time 25%, Alignment 25%)
- Objectively ranks DOLs by probability
- Selects the top 2 highest-confidence targets (P1 and P2)
- Removes human bias and emotion from target selection
**What the AI Does NOT Do:**
- It does not use machine learning or train on historical data
- It does not predict future price movements
- It does not adapt or "learn" over time
- It does not guarantee accuracy
The "AI" is simply an automated decision-making algorithm that applies consistent mathematical rules to identify the most statistically significant liquidity zones. Think of it as a "smart filter" rather than artificial intelligence in the traditional sense.
Visual Components
**Daily Level Lines:**
- Green lines: Unmitigated (not yet breached) levels
- Red lines: Mitigated (already breached) levels
- Dots at origin point showing where level was formed
- X marker when level gets breached
- Lines extend forward to show projection
**DOL Labels:**
- Display timeframe (1H, 4H, D1, W1) or "DOL" for AI selection
- Show confidence percentage in brackets
- Color-coded by timeframe:
- Lime: AI DOL (Smart selection)
- Aqua: 1-hour timeframe
- Blue: 4-hour timeframe
- Purple: Daily timeframe
- Orange: Weekly timeframe
**Info Box (Top Right):**
Displays comprehensive liquidity metrics:
- Total levels tracked
- Active (unmitigated) levels count
- Cleared (mitigated) levels count
- Flow direction (BID PRESSURE / OFFER PRESSURE)
- Most recent sweep
- Primary and Secondary DOL targets
- Multi-timeframe bias analysis
- Overall directional bias
Settings Explained
**Daily Levels Group:**
- Show Daily Highs/Lows: Toggle visibility of all daily level tracking
- Unbreached Color: Color for levels not yet hit
- Breached Color: Color for levels that have been swept
- Show X on Breach: Display marker when level is breached
- Show Dot at Origin: Display marker at level formation point
- Line Width: Thickness of level lines (1-5)
- Line Extension: How many bars forward to project (1-24)
- Max Days to Track: Historical lookback period (5-200 days)
**DOL Settings Group:**
- Cluster Tolerance %: Price range to group DOLs (0.1-2.0%)
- Show Price on Labels: Display actual price value on labels
- Backtest Mode: Only show recent labels for clean historical analysis
- Labels Lookback: Number of bars to show labels when backtesting (10-500)
**Info Box Group:**
- Show Info Box: Toggle info panel visibility
**DOL Toggles Group:**
- Show AI DOL: Display smart auto-selected primary target
- Show 1HR DOL: Display 1-hour timeframe DOLs
- Show 4HR DOL: Display 4-hour timeframe DOLs
- Show Daily DOL: Display daily timeframe DOLs
- Show Weekly DOL: Display weekly timeframe DOLs
**Advanced Group:**
- Manual Mode: Simplified display showing only daily high/low clusters
How to Use This Indicator
Educational Application
This indicator is intended for educational purposes to help traders:
1. **Understand Liquidity Concepts:** Visualize where unfilled orders may exist
2. **Identify Key Levels:** See where price may be drawn to
3. **Analyze Market Structure:** Understand how price interacts with liquidity
4. **Study Multi-Timeframe Alignment:** Observe when multiple timeframes agree
5. **Learn ICT Concepts:** Apply liquidity theory in practice
Interpretation Guidelines
**BID PRESSURE (Flow):**
When lows are being swept more than highs, it suggests:
- Sell-side liquidity being taken
- Potential for upward move to unfilled buy-side liquidity
- Market may be clearing the way for a bullish move
**OFFER PRESSURE (Flow):**
When highs are being swept more than lows, it suggests:
- Buy-side liquidity being taken
- Potential for downward move to unfilled sell-side liquidity
- Market may be clearing the way for a bearish move
**Confidence Scores:**
- 90-100%: Very high probability zone (strong cluster, recent, aligned)
- 80-89%: High probability zone (good cluster, relatively recent)
- 70-79%: Moderate probability zone (decent cluster or older)
- 60-69%: Lower probability zone (small cluster or very old)
- Below 60%: Weak zone (minimal confluence)
**Timeframe Analysis:**
- All timeframes LONG: Strong bullish alignment
- All timeframes SHORT: Strong bearish alignment
- Mixed: Conflicting signals, exercise caution
- Higher timeframes (D1, W1) carry more weight than lower (1H, 4H)
**DIRECTIONAL Indicator:**
- BULLISH: Overall bias suggests upward movement toward buy-side DOLs
- BEARISH: Overall bias suggests downward movement toward sell-side DOLs
- NEUTRAL: No clear directional bias, conflicting signals
Practical Application Examples
**Example 1: Bullish Setup**
```
Flow: BID PRESSURE (lows being swept)
P1: 27,500 (price above current market)
D1: LONG 27,500
W1: LONG 27,650
DIRECTIONAL: BULLISH
```
Interpretation: Price has cleared sell-side liquidity. High confidence buy-side DOL at 27,500. Daily and Weekly timeframes aligned bullish. Watch for move toward 27,500 target.
**Example 2: Bearish Setup**
```
Flow: OFFER PRESSURE (highs being swept)
P1: 26,200 (price below current market)
D1: SHORT 26,200
W1: SHORT 26,100
DIRECTIONAL: BEARISH
```
Interpretation: Price has cleared buy-side liquidity. High confidence sell-side DOL at 26,200. Daily and Weekly timeframes aligned bearish. Watch for move toward 26,200 target.
**Example 3: Mixed Signals - Wait**
```
Flow: BID PRESSURE
P1: 26,800
D1: LONG 27,000
W1: SHORT 26,200
DIRECTIONAL: NEUTRAL
```
Interpretation: Conflicting signals. Flow suggests up, but Weekly bias is down. Confidence scores moderate. Better to wait for clarity.
Important Considerations
This Indicator Does NOT:
- Predict the future
- Guarantee profitable trades
- Provide buy/sell signals
- Replace proper risk management
- Work in isolation without other analysis
This Indicator DOES:
- Visualize liquidity concepts
- Identify potential target zones
- Show timeframe alignment
- Calculate objective confidence scores
- Help understand market structure
Proper Usage:
1. Use as one component of a complete trading strategy
2. Combine with price action analysis
3. Confirm with other technical indicators
4. Consider fundamental factors
5. Always use proper risk management
6. Backtest any strategy before live trading
Risk Disclaimer
**FOR EDUCATIONAL PURPOSES ONLY**
This indicator is for educational purposes only. Trading financial markets involves substantial risk of loss. Past performance does not guarantee future results. Always conduct your own research and consult with a financial advisor before making trading decisions.
**Important Limitations:**
- No indicator is 100% accurate, including the AI selection
- The "AI" is an automated algorithm, not predictive artificial intelligence
- DOL levels can be swept and price can continue in the same direction
- Confidence scores are mathematical calculations, not predictions or probabilities of success
- High confidence does not mean guaranteed profit
- Markets can remain irrational longer than you can remain solvent
- Always use stop losses and proper position sizing
**Understanding the AI Component:**
The AI auto-selection feature uses a fixed mathematical formula to rank DOLs. It does not:
- Predict where price will go
- Learn from past performance
- Adapt to market conditions
- Guarantee any level of accuracy
The confidence score represents the mathematical strength of a liquidity cluster based on objective factors (cluster size, recency, timeframe alignment), NOT a probability of the trade succeeding.
**Risk Warning:**
Trading is risky. Most traders lose money. This indicator cannot change that fundamental reality. Use it as an educational tool to understand market structure, not as a trading signal or system.
Technical Requirements
- **Timeframe:** Best used on 1-hour charts (required for accurate daily level tracking)
- **Markets:** Works on any market (forex, crypto, stocks, futures, indices)
- **Updates:** Real-time calculation on each bar close
- **Resources:** Uses max 500 lines and 500 labels (TradingView limits)
Backtesting Features
The indicator includes "Backtest Mode" to keep historical charts clean:
- When enabled, only shows labels from recent bars
- Adjustable lookback period (10-500 bars)
- All lines remain visible
- Helps review past setups without clutter
To use:
1. Enable "Backtest Mode" in settings
2. Adjust "Labels Lookback" to desired period
3. Review historical price action
4. Disable for live trading
Credits and Methodology
This indicator implements concepts from:
- ICT (Inner Circle Trader) liquidity theory
- Smart Money Concepts (SMC)
- Order flow analysis
- Multi-timeframe analysis principles
The clustering algorithm, confidence scoring, and timeframe synthesis are original implementations designed to quantify and visualize these concepts.
Version History
**v1.0 - Initial Release**
- Multi-timeframe DOL detection
- Confidence scoring system
- Info box with liquidity metrics
- Backtest mode for clean charts
- Black/white professional theme
Support and Updates
For questions, feedback, or suggestions, please use the TradingView comments section. Updates and improvements will be released as needed based on user feedback and market evolution.
**Remember:** This is an educational tool. Successful trading requires knowledge, discipline, risk management, and continuous learning. Use this indicator to enhance your understanding of market structure and liquidity, not as a standalone trading system.

ICT HTF Volume Candles (Based on HTF Candles by Fadi)# ICT HTF Volume Candles - Multi-Timeframe Volume Analysis
## Overview
This indicator provides multi-timeframe volume visualization designed to complement price action analysis. It displays volume data from up to 6 higher timeframes simultaneously in a separate panel, allowing traders to identify volume spikes, divergences, and institutional activity without switching between timeframes.
**Original Concept Credits:** This indicator builds upon the HTF Candles framework by Fadi, adapting it specifically for volume analysis with enhanced features including gap-filling for extended hours, multiple scaling methods, and advanced synchronization.
## What Makes This Script Original
### Key Innovations:
1. **Three Volume Scaling Methods:**
- **Per-HTF Auto Scale:** Each timeframe scales independently for detailed comparison
- **Global Auto Scale:** All timeframes use unified scale for relative volume comparison
- **Manual Scale:** User-defined maximum for consistent analysis across sessions
2. **Bullish/Bearish Volume Differentiation:**
- Volume bars colored based on price movement (close vs open)
- Separate styling for bullish (green) and bearish (red) volume periods
- Helps identify whether volume supports price direction
3. **Advanced Time Synchronization:**
- Custom daily candle open times (Midnight, 8:30 AM, 9:30 AM ET)
- Timezone-aware calculations for New York trading hours
- Real-time countdown timers for each timeframe
- **Gap-filling technology** for continuous display during extended hours and weekends
4. **Flexible Display Options:**
- Configurable spacing and positioning
- Label placement (top, bottom, or both)
- Day-of-week or time interval labels on candles
- Works reliably in backtesting and live trading
## How It Works
### Volume Calculation
The indicator uses `request.security()` with optimized parameters to fetch volume data from higher timeframes:
- **Volume Open/High/Low/Close (OHLC):** Tracks volume changes within each HTF candle
- **Color Logic:** Compares HTF close vs open prices to determine bullish/bearish classification
- **Alignment:** All volume bars share a common baseline for easy visual comparison
- **Gap Handling:** Uses `gaps=barmerge.gaps_off` to maintain continuity during non-trading hours
### Technical Implementation
```
1. Monitors HTF timeframe changes using request.security() with lookahead
2. Creates new VolumeCandle object when HTF bar opens
3. Updates current candle's volume H/L/C on each chart bar
4. Applies selected scaling method to normalize display height
5. Repositions all candles and labels on each bar update
6. Fills gaps automatically during extended hours for consistent display
```
### Scaling Methods Explained
**Method 1 - Auto Scale per HTF:**
Each timeframe displays volume relative to its own maximum. Best for identifying patterns within each individual timeframe.
**Method 2 - Global Auto Scale:**
All timeframes share the same scale based on the highest volume across all HTFs. Best for comparing relative volume strength between timeframes.
**Method 3 - Manual Scale:**
User sets maximum volume value. Best for maintaining consistent scale across different trading sessions or instruments.
## How to Use This Indicator
### Setup
1. Add indicator to your chart (it appears in a separate panel below price)
2. Configure up to 6 higher timeframes (default: 5m, 15m, 1H, 4H, 1D, 1W)
3. Set number of candles to display for each timeframe
4. Choose volume scaling method based on your analysis needs
5. Enable "Fix gaps in non-trading hours" for extended hours trading (enabled by default)
### Interpretation
**Volume Spikes:**
- Sudden increase in volume height indicates institutional activity or strong conviction
- Compare volume between timeframes to identify where the real money is moving
- Look for volume spikes that appear across multiple timeframes simultaneously
**Bullish vs Bearish Volume:**
- **Green volume bars:** Price closed higher (buying pressure)
- **Red volume bars:** Price closed lower (selling pressure)
- High green volume during uptrend = confirmation of strength
- High red volume during downtrend = confirmation of weakness
- High volume opposite to trend = potential reversal warning
**Multi-Timeframe Context:**
- **5m/15m:** Scalping and day trading activity
- **1H/4H:** Swing trading and intraday institutional flows
- **Daily/Weekly:** Major position building and long-term trends
**Divergences:**
- Price making new highs but volume declining = weakening trend
- Volume increasing while price consolidates = potential breakout brewing
- Price breaks level but volume doesn't confirm = likely false breakout
### Practical Examples
**Example 1 - Institutional Confirmation:**
Price breaks above resistance. Check volume across timeframes:
- 5m shows spike = retail interest
- 15m + 1H + 4H all show spikes = institutional confirmation
- **Trade confidence: HIGH**
**Example 2 - False Breakout Detection:**
Price breaks resistance with:
- High volume on 5m only
- Normal/low volume on 1H and 4H
- **Interpretation:** Likely retail trap, institutions not participating
- **Action:** Wait for pullback or avoid
**Example 3 - Accumulation Phase:**
Price ranges sideways but:
- Daily volume gradually increasing
- Weekly volume above average
- **Interpretation:** Smart money accumulating
- **Action:** Prepare for breakout in direction of volume
**Example 4 - Volume Divergence:**
Price makes new high:
- Current high has lower volume than previous high across all timeframes
- **Interpretation:** Weakening momentum
- **Action:** Consider profit-taking or reversal trade
## Configuration Parameters
### Timeframe Settings
- **HTF 1-6:** Select timeframes (must be higher than chart timeframe)
- **Max Display:** Number of candles to show per timeframe (1-50)
- **Limit to Next HTFs:** Display only first N enabled timeframes (1-6)
### Styling
- **Bull/Bear Colors:** Separate colors for body, border, and wick
- **Padding from current candles:** Distance offset from live price action
- **Space between candles:** Gap between individual volume bars
- **Space between Higher Timeframes:** Gap between different timeframe groups
- **Candle Width:** Thickness of volume bars (1-4, multiplied by 2)
### Volume Settings
- **Volume Scale Method:** Choose 1, 2, or 3
- 1 = Auto Scale per HTF (each TF independent)
- 2 = Global Auto Scale (all TF unified)
- 3 = Manual Scale (user-defined max)
- **Auto Scale Volume:** Enable/disable automatic scaling
- **Manual Scale Max Volume:** Set maximum when using Method 3
### Label Settings
- **HTF Label:** Show/hide timeframe names with color and size options
- **Label Positions:** Display at Top, Bottom, or Both
- **Label Alignment:** Align centered or Follow Candles
- **Remaining Time:** Show countdown timer until next HTF candle
- **Interval Value:** Display day-of-week or time on each candle
### Custom Daily Candle
- **Enable Custom Daily:** Override default daily candle timing
- **Open Time Options:**
- **Midnight:** Standard 00:00 ET daily open
- **8:30 AM:** Align with economic data releases
- **9:30 AM:** Align with NYSE market open
- Useful for specific trading strategies or market alignment
### Advanced Settings
- **Fix gaps in non-trading hours:** Maintains alignment during extended hours and weekends (recommended: ON)
- Prevents visual gaps during forex weekend closures
- Ensures consistent display during crypto 24/7 trading
- Improves backtesting reliability
## Best Practices
1. **Pair with Price Action:** Use alongside HTF price candles indicator for complete picture
2. **Start Simple:** Enable 2-3 timeframes initially (e.g., 15m, 1H, 4H), add more as needed
3. **Match Settings:** Use same candle width/spacing as companion price indicator for visual alignment
4. **Scale Appropriately:**
- Use **Global scale** (Method 2) when comparing timeframes
- Use **Per-HTF scale** (Method 1) for pattern analysis within each timeframe
- Use **Manual scale** (Method 3) for consistent day-to-day comparison
5. **Watch for Volume Clusters:** High volume appearing simultaneously across multiple HTFs signals significant market events
6. **Confirm Breakouts:** Always check if volume supports the price movement across higher timeframes
7. **Extended Hours:** Keep "Fix gaps" enabled for 24/7 markets (Forex, Crypto) and weekend analysis
## Technical Notes
- **Timezone:** All calculations use America/New_York timezone for consistency
- **Real-time Updates:** Volume and timers update on each tick during market hours
- **Performance:** Optimized with max_bars_back=5000 for extensive historical analysis
- **Compatibility:** Works on all instruments with volume data (Stocks, Forex, Crypto, Futures)
- **Gap Handling:** Uses `barmerge.gaps_off` to fill data gaps during non-trading periods
- **Backtesting:** Uses `lookahead=barmerge.lookahead_on` for stable historical data without repainting
- **Data Continuity:** Automatically handles market closures, weekends, and extended hours
## Updates & Improvements
**Version 2.0 (Current):**
- ✅ Fixed alignment issues during extended hours and weekends
- ✅ Eliminated repainting in backtesting
- ✅ Added gap-filling technology for continuous display
- ✅ Improved data synchronization across all timeframes
- ✅ Enhanced NA value handling for data integrity
- ✅ Added advanced settings group for user control
## Support
For questions, suggestions, or feedback, please comment on the publication or message the author.
---
**Disclaimer:** This indicator is for educational and informational purposes only. It does not constitute financial advice. Past performance is not indicative of future results. Always perform your own analysis and implement proper risk management before making trading decisions.

RMSD Trend [InvestorUnknown]RMSD Trend is a trend-following indicator that utilizes Root Mean Square Deviation (RMSD) to dynamically construct a volatility-weighted trend channel around a selected moving average. This indicator is designed to enhance signal clarity, minimize noise, and offer quantitative insights into market momentum, ideal for both discretionary and systematic traders.
How It Works
At its core, RMSD Trend calculates a deviation band around a selected moving average using the Root Mean Square Deviation (similar to standard deviation but with squared errors), capturing the magnitude of price dispersion over a user-defined period. The logic is simple:
When price crosses above the upper deviation band, the market is considered bullish (Risk-ON Long).
When price crosses below the lower deviation band, the market is considered bearish (Risk-ON Short).
If price stays within the band, the market is interpreted as neutral or ranging, offering low-risk decision zones.
The indicator also generates trend flips (Long/Short) based on crossovers and crossunders of the price and the RMSD bands, and colors candles accordingly for enhanced visual feedback.
Features
7 Moving Average Types: Choose between SMA, EMA, HMA, DEMA, TEMA, RMA, and FRAMA for flexibility.
Customizable Source Input: Use price types like close, hl2, ohlc4, etc.
Volatility-Aware Channel: Adjustable RMSD multiplier determines band width based on volatility.
Smart Coloring: Candles and bands adapt their colors to reflect trend direction (green for bullish, red for bearish).
Intra-bar Repainting Toggle: Option to allow more responsive but repaintable signals.
Speculation Fill Zones: When price exceeds the deviation channel, a semi-transparent fill highlights potential momentum surges.
Backtest Mode
Switching to Backtest Mode unlocks a robust suite of simulation features:
Built-in Equity Curve: Visualizes both strategy equity and Buy & Hold performance.
Trade Metrics Table: Displays the number of trades, win rates, gross profits/losses, and long/short breakdowns.
Performance Metrics Table: Includes key stats like CAGR, drawdown, Sharpe ratio, and more.
Custom Date Range: Set a custom start date for your backtest.
Trade Sizing: Simulate results using position sizing and initial capital settings.
Signal Filters: Choose between Long & Short, Long Only, or Short Only strategies.
Alerts
The RMSD Trend includes six built-in alert conditions:
LONG (RMSD Trend) - Trend flips from Short to Long
SHORT (RMSD Trend) - Trend flips from Long to Short
RISK-ON LONG (RMSD Trend) - Price crosses above upper RMSD band
RISK-OFF LONG (RMSD Trend) - Price falls back below upper RMSD band
RISK-ON SHORT (RMSD Trend) - Price crosses below lower RMSD band
RISK-OFF SHORT (RMSD Trend) - Price rises back above lower RMSD band
Use Cases
Trend Confirmation: Confirms directional bias with RMSD-weighted confidence zones.
Breakout Detection: Highlights moments when price breaks free from historical volatility norms.
Mean Reversion Filtering: Avoids false signals by incorporating RMSD’s volatility sensitivity.
Strategy Development: Backtest your signals or integrate with a broader system for alpha generation.
Settings Summary
Display Mode: Overlay (default) or Backtest Mode
Average Type: Choose from SMA, EMA, HMA, DEMA, etc.
Average Length: Lookback window for moving average
RMSD Multiplier: Band width control based on RMS deviation
Source: Input price source (close, hl2, ohlc4, etc.)
Intra-bar Updating: Real-time updates (may repaint)
Color Bars: Toggle bar coloring by trend direction
Disclaimer
This indicator is provided for educational and informational purposes only. It is not financial advice. Past performance, including backtest results, is not indicative of future results. Use with caution and always test thoroughly before live deployment.
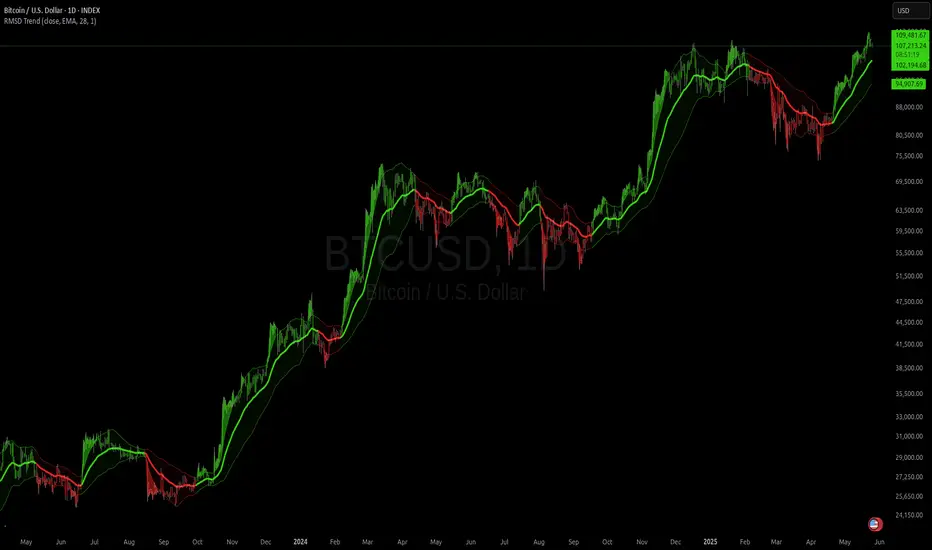
Adaptive Fisher [BackQuant]Adaptive Fisher
What is it at its core:
Custom Kaufman Adaptive Moving Average Smoothed Price Data, Fisher Transformation.
Why did we choose to make an Adaptive Fisher ?
The Adaptive Fisher Transformation Indicator is an advanced technical tool designed to signal potential turning points in market prices by transforming asset price data into a nearly Gaussian normal distribution. This transformation, initially conceptualized by John F. Ehlers, aims to make extreme price behavior, which could indicate potential market reversals, more identifiable. Unlike the standard distribution of asset prices, the Gaussian normal distribution provides a clearer framework for identifying price extremes and trends.
With that being considered there are key things to take into consideration:
As the transformation seeks to normalize price data, it's crucial to remember that asset prices inherently do not follow a normal distribution. Thus, traders should use this tool in conjunction with other analyses to confirm potential trading signals. The effectiveness can vary across different assets and market conditions, underscoring the importance of customization and adaptation to specific trading strategies. As the same for all tools, all must be backtested. Past performance is not a guarantee for future results.
Now for the Key Features
Normalization of Prices: The Adaptive Fisher Transformation normalizes price data, enhancing the visibility of turning points. This normalization is critical for identifying moments when the price movement is statistically significant, thereby aiding in decision-making.
Adaptivity through Kaufman's Adaptive Moving Average (KAMA): Unlike traditional indicators, this version employs KAMA to dynamically adjust to market volatility. By doing so, it smoothens the price data more effectively, providing signals that are more responsive to current market conditions.
Divergence Detection: It includes the capability to detect divergences between the indicator and price movement, a powerful signal of potential trend reversals. Traders can specify the length over which divergences are calculated, allowing for customization based on their trading strategy.
Visual Enhancements: The indicator features color gradients to delineate strength levels and extreme values, improving readability and the quick assessment of market conditions.
Customizable Smoothing Mechanism: To accommodate different assets and timeframes, the indicator includes an option to select from various moving averages for smoothing, with an Exponential Moving Average (EMA) recommended for its effectiveness.
Application and Interpretation:
Traders can utilise this tool to identify potential reversal points by looking for extreme values in the transformed price data. Changes in the direction of the indicator can also signal shifts in market trends.
The inclusion of a normalized Relative Strength Index (RSI) provides additional confluence, aiding traders in recognizing overbought and oversold conditions through color-coded background hues in the chart.
Alert conditions are programmed for various scenarios, including trend shifts, Fisher Transform crossings over the midline, and both regular and hidden divergences, enabling traders to react promptly to potential market movements.
Empirical Soundness
Mathematical Foundation in Gaussian Distribution: At its core, the Fisher Transformation's application to financial markets is based on transforming prices to conform more closely to a Gaussian normal distribution, which is a fundamental concept in statistics. This transformation aims to make the identification of price extremes more reliable. Empirical studies have shown that while raw financial data may not follow a normal distribution, the application of transformations can facilitate the identification of critical turning points in market data (Ehlers, John F., "Cybernetic Analysis for Stocks and Futures", Wiley & Sons, 2004).
Adaptivity through KAMA: The use of Kaufman's Adaptive Moving Average introduces a dynamic element to the indicator, allowing it to adjust to market volatility automatically. This adaptivity is particularly relevant in today's financial markets, where volatility patterns can shift rapidly due to economic news, geopolitical events, and changes in market sentiment. The empirical strength of KAMA lies in its foundational logic, designed to account for market noise and smoothing price data more effectively than traditional moving averages (Kaufman, Perry J., "Trading Systems and Methods", Wiley & Sons, 2013).
Innovative Divergence Detection Mechanism: Divergence detection adds an empirical layer to the Adaptive Fisher Transformation by highlighting discrepancies between price action and the indicator's performance. This feature is grounded in the principle that divergences can often precede reversals, providing early warning signs of potential shifts in market direction. The ability to customize the calculation length for divergences enables the indicator to be fine-tuned to the characteristics of specific assets or market conditions, enhancing its practical application.
User Inputs Explained:
Calculation Source (price): This input determines the base price used for calculations, typically the closing price (close). Traders can adjust this to open, high, low, or another average, tailoring the indicator to focus on specific aspects of price action.
Fisher Lookback (ftPeriod): Defines the period over which the Fisher Transform is calculated. A shorter period makes the indicator more sensitive to price movements, while a longer period smoothens the output, reducing sensitivity.
Make Fisher Adaptive (adapt): A boolean input that enables the adaptation feature of the Fisher Transform using KAMA. When set to true, it dynamically adjusts the Fisher Transform according to market volatility, enhancing its responsiveness to recent price changes.
Adaptive Period (length), Fast Length (fast), Slow Length (slow): These inputs configure the KAMA calculation, affecting its sensitivity to price movements. The length determines the lookback period for volatility calculation, while fast and slow set the speed of adjustment to market conditions.
Smooth Fisher (smooth): Allows for additional smoothing of the Fisher Transform output to reduce noise. This is particularly useful in highly volatile markets or when the indicator is too reactive to price changes.
Smoothing Type (modeSwitch) and Smooth Period (smoothlen): Determine the method and period for smoothing. Options include various moving averages (EMA, SMA, etc.), providing flexibility in how the smoothing is applied.
Show Fisher, Show Fisher Moving Average, Moving Average Period (malen): These inputs control the visibility of the Fisher Transform and its moving average on the chart, as well as the period of the moving average. This helps in identifying trends and the direction of the market.
Show Detected Trend Shifts (trendshift): Enables the highlighting of moments when the indicator suggests a potential shift in market trend, providing early signals for traders.
Show Fisher Strength levels (showextreme): Displays predefined levels indicating extreme values of the Fisher Transform, which could suggest overbought or oversold conditions.
Show Confluence RSI (showrsi), RSI Period (rsiPeriod): These inputs add a normalized Relative Strength Index to the chart for additional analysis, offering a secondary measure of market conditions.
Show Overbought and Oversold Signals: When enabled, the background color changes to highlight overbought or oversold conditions based on the RSI, aiding in visual identification of potential trading opportunities.
Use Case of Midline Crossover Fisher:
Midline Crossover Fisher: The Fisher Transform's midline crossover is a critical signal for traders. A crossover above the midline indicates a bullish market sentiment, suggesting that it might be a good time to consider entering a long position. Conversely, a crossover below the midline suggests bearish sentiment, potentially signaling an opportunity to go short. This is based on the principle that the Fisher Transform makes turning points more evident, and crossing the midline reflects a change in momentum.
Overbought and Oversold Hues:
RSI Overbought and Oversold Background Color: The background color feature for RSI OB (overbought) and OS (oversold) conditions enhances visual cues for market extremes. When the RSI exceeds upper thresholds (Above 70), indicating overbought conditions, the background will turn to warn traders of potential price reversals. Similarly, when the RSI falls below lower thresholds (Below 30), suggesting oversold conditions, green can highlight potential opportunities for buying.
Thus following all of the key points here are some sample backtests on the 1D Chart
Disclaimer: Backtests are based off past results, and are not indicative of the future.
This is using the Midline Crossover:
INDEX:BTCUSD
INDEX:ETHUSD
BINANCE:SOLUSD
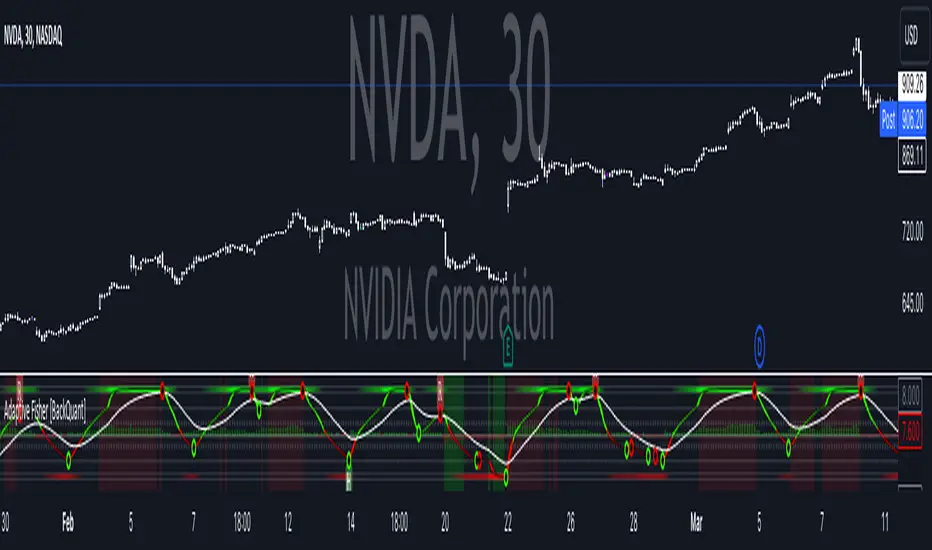
Candles HTF on Heikin Ashi ChartThis script enables calling and/or plotting of traditional Candles sources while loaded on Heikin Ashi charts.
Thanks to @PineCoders for rounding method: www.pinecoders.com
Thanks to @BeeHolder for method to regex normalize syminfo.tickerid.
NOTICE: While this script is meant to be utilized on Heikin Ashi charts it does NOT enable ability to backtest!
NOTICE: For more info on why non standard charts cannot be reliably backtested please see:
NOTICE: This is an example script and not meant to be used as an actual strategy. By using this script or any portion thereof, you acknowledge that you have read and understood that this is for research purposes only and I am not responsible for any financial losses you may incur by using this script!

Bifurcation Point Adaptive (Auto Oscillator ML)Bifurcation Point Adaptive - Auto Oscillator ML
Overview
Bifurcation Point Adaptive (🧬 BPA-ML) represents a paradigm shift in divergence-based trading systems. Rather than relying on static oscillator settings that quickly become obsolete as market dynamics shift, BPA-ML employs multi-armed bandit machine learning algorithms to continuously discover and adapt to the optimal oscillator configuration for your specific instrument and timeframe. This self-learning core is enhanced by a Cognitive Analytical Engine (CAE) that provides market-state intelligence, filtering out low-probability setups before they reach your chart.
The result is a system that doesn't just detect divergences - it understands context, learns from outcomes, and evolves with the market.
What Sets This Apart: Technical Comparison
The TradingView community has many excellent divergence indicators and several claiming "machine learning" capabilities. However, a detailed technical analysis reveals that BPA-ML operates at a fundamentally different level of sophistication.
Machine Learning: Real vs Marketing
Most indicators labeled "ML" or "AI" on TradingView use one of three approaches:
K-Nearest Neighbors (KNN): These indicators find similar historical patterns and assume current price will behave similarly. This is pattern matching, not learning. The system doesn't improve over time or adapt based on outcomes - it simply searches historical data for matches.
Clustering (K-Means): These indicators group volatility or market states into categories (high/medium/low). This is statistical classification, not machine learning. The clusters are recalculated but don't learn which classifications produce better results.
Gaussian Process Regression (GPR): These indicators use kernel weighting to create responsive moving averages. This is advanced curve fitting, not learning. The system doesn't evaluate outcomes or adjust strategy.
BPA-ML's Approach: True Reinforcement Learning
BPA-ML implements multi-armed bandit algorithms - a proven reinforcement learning technique used in clinical trials, A/B testing, and recommendation systems. This is fundamentally different:
Exploration vs Exploitation: The system actively balances trying new configurations (exploration) against using proven winners (exploitation). KNN and clustering don't do this - they simply process current data against historical patterns.
Reward-Based Learning: Every configuration is scored based on actual forward returns, normalized by volatility and clipped to prevent outlier dominance. The system receives a bonus when signals prove profitable. This creates a feedback loop where the indicator literally learns what works for your specific instrument and timeframe.
Four Proven Algorithms: UCB1 (Upper Confidence Bound), Thompson Sampling (Bayesian), Epsilon-Greedy, and Gradient-based learning. Each has different exploration characteristics backed by peer-reviewed research. You're not getting marketing buzzwords - you're getting battle-tested algorithms from academic computer science.
Continuous Adaptation: The learning never stops. As market microstructure evolves, the bandit discovers new optimal configurations. Other "adaptive" indicators recalculate but don't improve - they use the same logic on new data. BPA-ML fundamentally changes which logic it uses based on what's working.
The Configuration Grid: 40 Arms vs Fixed Settings
Traditional divergence indicators use a single oscillator with fixed parameters - typically RSI with length 14. More advanced systems might let you choose between RSI, Stochastic, or CCI, but you're still picking one manually.
BPA-ML maintains a grid of 40 candidate configurations:
- 5 oscillator families (RSI, Stochastic, CCI, MFI, Williams %R)
- 4 length parameters (short, medium, medium-long, long)
- 2 smoothing settings (fast, slow)
The bandit evaluates all 40 continuously and automatically selects the optimal one. When market microstructure changes - say, from trending crypto to ranging forex - the system discovers this and switches configurations without your intervention.
Why This Matters: Markets exhibit different characteristics. Bitcoin on 5-minute charts might favor fast Stochastic (high sensitivity to quick moves), while EUR/USD on 4-hour charts might favor smoothed RSI (filtering noise in steady trends). Manual optimization is guesswork. The bandit discovers these nuances mathematically.
Cognitive Analytical Engine: Beyond Simple Filters
Many divergence indicators include basic filters - perhaps checking if RSI is overbought/oversold or if volume increased. These are single-metric gates that treat all market states the same.
BPA-ML's CAE synthesizes five intelligence layers into a comprehensive market-state assessment:
Trend Conviction Score (TCS): Combines ADX normalization, multi-timeframe EMA alignment, and structural persistence. This isn't just "is ADX above 25?" - it's a weighted composite that captures trending vs ranging regimes with nuance. The threshold itself is adaptive via mini-bandit if enabled.
Directional Momentum Alignment (DMA): ATR-normalized EMA spread creates a regime-aware momentum indicator. The same price move reads differently in high vs low volatility environments. Most indicators ignore this context.
Exhaustion Modeling: Aggregates volume spikes, pin bar formations, extended runs without pullback, and extreme oscillator readings into a unified probability of climax. This multi-factor approach catches exhaustion signals that single metrics miss. High exhaustion can override trend filters - allowing reversal trades at genuine turning points that basic filters would block.
Adversarial Validation: Before approving a bullish signal, the engine quantifies both the bull case AND the bear case. If the opposing case dominates by a threshold, the signal is blocked. This is game-theory applied to trading - most indicators don't check if you're fighting obvious strength in the opposite direction.
Confidence Scoring: Every signal receives a 0-1 quality score blending all CAE components plus divergence strength. You can size positions by confidence - a concept absent in most divergence indicators that treat all signals identically.
Adaptive Parameters: Mini-Bandits
Even the filtering thresholds themselves learn. Most indicators have you set pivot lookback periods, minimum divergence strength, and trend filter strictness manually. These are instrument-specific - what works for one asset fails on another.
BPA-ML's mini-bandits optimize:
- Pivot lookback strictness (balance between catching small structures vs requiring major swings)
- Minimum slope change threshold (filter weak divergences vs allow early entries)
- TCS threshold for trend filtering (how strict counter-trend blocking should be)
These learn the same way the oscillator bandit does - via reward scoring and outcome evaluation. The entire system personalizes to your trading context.
Visual Intelligence: Five Presentation Modes
Most indicators offer basic customization - perhaps choosing colors or line thickness. BPA-ML includes five distinct visual modes, each designed for specific use cases:
Quantum Mode: Renders signals as probability clouds where opacity encodes confidence. High-confidence signals are bold and opaque; low-confidence signals are faint and translucent. This visually guides position sizing in a way that static markers cannot. No other divergence indicator I've found uses confidence-based visual encoding.
Holographic Mode: Multi-layer gradient bands create depth perception showing signal quality zones. Excellent for teaching and presentations.
Cyberpunk Mode: Neon centerlines with particle glow trails. High-contrast for immersive dark-theme trading.
Standard Mode: Professional dashed lines and zones. Clean, presentation-ready.
Minimal Mode: Maximum performance for backtesting and low-powered devices.
The visual system isn't cosmetic - it's part of the decision support infrastructure.
Dashboard: Real-Time Intelligence
Many indicators include dashboards showing current indicator values or basic statistics. BPA-ML's dashboard is a comprehensive control center:
Oscillator Section: Shows which configuration is currently selected, why it's selected (pull statistics, reward scores), and learning progression (warmup, learning, active).
CAE Section: Real-time TCS, DMA, Exhaustion, Adversarial cases, and Confidence scores with visual indicators (emoji-coded states, bar graphs, trend arrows).
Bandit Performance: Algorithm selection, mode (Switch vs Blend), arm distribution, differentiation metrics, learning diagnostics.
State Metrics Grid (Large mode): Normalized readings for trend alignment, momentum, volatility, volume flow, Bollinger position, ROC, directional movement, oscillator bias - all synthesized into a composite market state.
This level of transparency is rare. Most "black box" indicators hide their decision logic. BPA-ML shows you exactly why it's making decisions in real-time, enabling informed discretionary overrides.
Repainting: Complete Transparency
Many divergence indicators don't clearly disclose repainting behavior. BPA-ML offers three explicit timing modes:
Realtime: Shows developing signals on current bar. Repaints by design - this is a preview mode for learning, not for trading.
Confirmed: Signals lock at bar close. Zero repainting. Recommended for live trading.
Pivot Validated: Waits for full pivot confirmation (5+ bar delay). Highest purity, zero repainting, ideal for backtesting divergence quality.
You choose the mode based on your priority - speed vs certainty. The transparency empowers rather than obscures.
Educational Value: Learning Platform
Most indicators are tools - you use them, but you don't learn from them. BPA-ML is designed as a learning platform:
Advisory Mode: Signals always appear, but blocked signals receive warning annotations explaining why CAE would have filtered them. You see the decision logic in action without missing learning opportunities.
Dashboard Transparency: Real-time display of all metrics shows exactly how market state influences decisions.
Comprehensive Documentation: In-indicator tooltips, extensive publishing statement, and user guides explain not just what to click, but why the algorithms work and how to apply them strategically.
Algorithm Comparisons: By trying different bandit algorithms (UCB1 vs Thompson vs Epsilon vs Gradient), you learn the differences between exploration strategies - knowledge applicable beyond trading.
This isn't just a signal generator - it's an educational tool that teaches machine learning concepts, market intelligence interpretation, and systematic decision-making.
What This System Is NOT
To be completely transparent about positioning:
Not a Prediction System: BPA-ML doesn't predict future prices. It identifies structural divergences, assesses current market state, and learns which oscillator configurations historically correlated with better forward returns. The learning is retrospective optimization, not fortune telling.
Not Fully Automated: This is a decision support tool, not a push-button profit machine. You still need to execute trades, manage risk, and apply discretionary judgment. The confidence scores guide position sizing, but you determine final risk allocation.
Not Beginner-Friendly: The sophistication comes with complexity. This system requires understanding of divergence trading, basic machine learning concepts, and market state interpretation. It's designed for intermediate to advanced traders willing to invest time in learning the system.
Not Magic: Even with optimal configurations and intelligent filtering, markets are probabilistic. Losing trades are inevitable. The system improves your probability distribution - it doesn't eliminate risk or guarantee profits.
The Fundamental Difference
Here's the core distinction:
Traditional Divergence Indicators: Detect patterns and hope they work.
"ML" Indicators (KNN/Clustering): Detect patterns and compare to historical similarities.
BPA-ML: Detects patterns, evaluates outcomes, learns which detection methods work best for this specific context, understands market state before suggesting trades, and continuously improves without manual intervention.
The difference isn't incremental - it's architectural. This is trading system infrastructure with embedded intelligence, not just a pattern detector with filters.
Who This Is For
BPA-ML is ideal for traders who:
- Value systematic approaches over discretionary guessing
- Appreciate transparency in decision logic
- Are willing to let systems learn over 200+ bars before judging performance
- Trade liquid instruments on 5-minute to daily timeframes
- Want to learn machine learning concepts through practical application
- Seek professional-grade tools without institutional price tags
It's not ideal for:
- Absolute beginners needing simple plug-and-play systems
- 1-minute scalpers (noise dominates at very low timeframes)
- Traders of illiquid instruments (insufficient data for learning)
- Those seeking magic solutions without understanding methodology
- Impatient optimizers wanting instant perfection
What Makes This Original
The innovation in BPA-ML lies in three interconnected breakthroughs that work synergistically:
1. Multi-Armed Bandit Oscillator Selection
Traditional divergence indicators require manual optimization - you choose RSI with a length of 14, or Stochastic with specific settings, and hope they work. BPA-ML eliminates this guesswork through machine learning. The system maintains a grid of 40 candidate oscillator configurations spanning five oscillator families (RSI, Stochastic, CCI, MFI, Williams %R), four length parameters, and two smoothing settings. Using proven bandit algorithms (UCB1, Thompson Sampling, Epsilon-Greedy, or Gradient-based learning), the system continuously evaluates which configuration produces the best forward returns and automatically switches to the winning arm. This isn't random testing - it's intelligent exploration with exploitation, balancing the discovery of new opportunities against leveraging proven configurations.
2. Cognitive Analytical Engine (CAE)
Divergences occur constantly, but most fail. The CAE solves this by computing a comprehensive market intelligence layer:
Trend Conviction Score (TCS): Synthesizes ADX normalization, multi-timeframe EMA alignment, and structural persistence into a single 0-1 metric that quantifies how strongly the market is trending. When TCS exceeds your threshold, the system knows to avoid counter-trend trades unless other factors override.
Directional Momentum Alignment (DMA): Measures the spread between fast and slow EMAs, normalized by ATR. This creates a regime-aware momentum indicator that adjusts its interpretation based on current volatility.
Exhaustion Modeling: Aggregates volume spikes, pin bar formations, extended runs above/below EMAs, and extreme RSI readings into a probability that the current move is reaching climax. High exhaustion can override trend filters, allowing reversal trades at genuine turning points.
Adversarial Validation: Before approving a bullish signal, the engine quantifies both the bull case (proximity to support EMAs, oversold conditions, volume confirmation) and the bear case (distance to resistance, overbought conditions). If the opposing case dominates by your threshold, the signal is blocked or flagged with a warning.
Confidence Scoring: Every signal receives a 0-1 confidence score blending TCS, momentum magnitude, pullback quality, market state metrics, divergence strength, and adversarial advantage. You can gate signals on minimum confidence, ensuring only high-probability setups reach your attention.
3. Adaptive Parameter Mini-Bandits
Beyond the oscillator itself, BPA-ML uses additional bandit systems to optimize:
- Pivot lookback strictness
- Minimum slope change threshold
- TCS threshold for trend filtering
These parameters are often instrument-specific. The adaptive bandits learn these nuances automatically.
Why These Components Work Together
Each layer serves a specific purpose in the signal generation hierarchy:
Layer 1 - Oscillator Selection: The bandit ensures you're always using the oscillator configuration best suited to current market microstructure.
Layer 2 - Divergence Detection: With the optimal oscillator selected, the engine scans for structural divergences using confirmed pivots.
Layer 3 - CAE Filtering: Raw divergences are validated against market intelligence.
Layer 4 - Spacing & Timing: Quality signals need proper spacing to avoid over-trading.
This isn't a random collection of indicators. It's a decision pipeline where each stage refines signal quality, and the machine learning ensures the entire system stays calibrated to your specific trading context.
Core Components - Deep Dive
Divergence Engine
The foundation is a dual-mode divergence detector:
Regular Divergence: Price makes a higher high while oscillator makes a lower high (bearish), or price makes a lower low while oscillator makes a higher low (bullish). These signal potential reversals.
Hidden Divergence: Price makes a lower high while oscillator makes a higher high (bullish continuation), or price makes a higher low while oscillator makes a lower low (bearish continuation). These signal trend strength.
Pivots are confirmed using symmetric lookback periods. Divergence strength is quantified via slope separation between price and oscillator.
Signal Timing Modes
Realtime (live preview): Shows potential signals on current bar. Repaints by design. Use for learning only.
Confirmed (1-bar delay): Signals lock at bar close. No repainting. Recommended for live trading.
Pivot Validated: Waits for full pivot confirmation (5+ bar delay). Highest purity, best for backtesting.
Multi-Armed Bandit Algorithms
UCB1: Optimism under uncertainty. Excellent balance for most use cases.
Thompson Sampling: Bayesian approach with smooth exploration. Great for long-term adaptation.
Epsilon-Greedy: Simple exploitation with random exploration. Easy to understand.
Gradient-based: Lightweight weight adjustment based on rewards. Fast and efficient.
Bandit Operating Modes
Switch Mode: Uses top-ranked arm directly. Maximum amplitude, crisp signals.
Blend Mode: Softmax mixture with dominant-arm preservation. Ensemble stability while maintaining amplitude for overbought/oversold crossings.
How to Use This Indicator
Initial Setup
1. Apply BPA-ML to your chart
2. Select visual mode (Minimal/Standard/Holographic/Cyberpunk/Quantum)
3. Choose signal timing - "Confirmed (1-bar delay)" for live trading
4. Set Oscillator Type to "Auto (ML)" and enable it
5. Select bandit algorithm - UCB1 recommended
6. Choose Blend mode with temperature 0.4-0.5
CAE Configuration
Start with "Advisory" mode to learn the system. Signals appear with warnings if CAE would have blocked them.
Switch to "Filtering" mode when comfortable - CAE actively blocks low-quality signals.
Enable the three primary filters:
- Strong Trend Filter
- Adversarial Validation
- Confidence Gating
Parameter Guidance by Trading Style
Scalping (1-5 minute charts):
- Algorithm: Thompson or UCB1
- Mode: Blend (temp 0.3-0.4)
- Horizon: 8-12 bars
- Min Confidence: 0.30-0.40
- TCS Threshold: 0.70-0.80
- Spacing: 8-12 any, 16-24 same-side
Day Trading (15min-1H charts):
- Algorithm: UCB1
- Mode: Blend (temp 0.4-0.6)
- Horizon: 12-24 bars
- Min Confidence: 0.35-0.45
- TCS Threshold: 0.80-0.85
- Spacing: 12-20 any, 20-30 same-side
Swing Trading (4H-Daily charts):
- Algorithm: UCB1 or Thompson
- Mode: Blend (temp 0.6-1.0) or Switch
- Horizon: 20-40 bars
- Min Confidence: 0.40-0.55
- TCS Threshold: 0.85-0.95
- Spacing: 20-40 any, 30-60 same-side
Signal Interpretation
Bullish Signals: Green markers below price. Enter long when detected.
Bearish Signals: Red markers above price. Enter short when detected.
Blocked Signals: Orange X markers show filtered signals (Advisory mode).
Confidence Rings: Single ring at 50%+ confidence, double at 70%+. Use for position sizing.
Dashboard Metrics
Oscillator Section: Shows active type, value, state, and parameters.
Cognitive Engine:
- TCS: 0.80+ indicates strong trend
- DMA: Momentum direction and strength
- Exhaustion: 0.75+ warns of reversal
- Bull/Bear Case: Adversarial scoring
- Differential: Net directional advantage
Bandit Performance: Shows algorithm, mode, selected configuration, and learning diagnostics.
Visual Zones
- Bullish Zone: Blue/cyan tint - favorable for longs
- Bearish Zone: Red/magenta tint - favorable for shorts
- Exhaustion Zone: Yellow warning - reduce sizing
Visual Mode Selection
Minimal: Clean triangles, maximum performance
Standard: Dashed lines with zones, professional presentation
Holographic: Gradient bands, excellent for teaching
Cyberpunk: Neon glow trails, high contrast
Quantum: Probability cloud with confidence-based opacity
Calculation Methodology
Oscillator Computation
For each bandit arm: calculate base oscillator, apply smoothing, normalize to 0-100.
Switch mode: use top arm directly.
Blend mode: softmax mixture blended with dominant arm (70/30) to preserve amplitude.
Divergence Detection
1. Identify price and oscillator pivots using symmetric periods
2. Store recent pivots with bar indices
3. Scan for slope disagreements within lookback range
4. Require minimum slope separation
5. Classify as regular or hidden divergence
6. Compute strength score
CAE Metrics
TCS: 0.35×ADX + 0.35×structural + 0.30×alignment
DMA: (EMA21 - EMA55) / ATR14
Exhaustion: Aggregates volume, divergence, RSI extremes, pins, extended runs
Confidence: 0.30×TCS + 0.25×|DMA| + 0.20×pullback + 0.15×state + 0.10×divergence + adversarial
Bandit Rewards
Every horizon period: compute log return normalized by ATR, clip to ±0.5, bonus if signal was positive. Update arm statistics per algorithm.
Ideal Market Conditions
Best Performance:
- Liquid instruments with clear structure
- Trending markets with consolidations
- 5-minute to daily timeframes
- Consistent volume and participation
Learning Requirements:
- Minimum 200 bars for warmup
- Ideally 500-1000 bars for full confidence
- Performance improves as bandit accumulates data
Challenging Conditions:
- Extremely low liquidity
- Very low timeframes (1-minute or below)
- Extended sideways consolidation
- Fundamentally-driven gap markets
Dashboard Interpretation Guide
TCS:
- 0.00-0.50: Weak trend, reversals viable
- 0.50-0.75: Moderate trend, mixed approach
- 0.75-0.85: Strong trend, favor continuation
- 0.85-1.00: Very strong trend, counter-trend high risk
DMA:
- -2.0 to -1.0: Strong bearish
- -0.5 to 0.5: Neutral
- 1.0 to 2.0: Strong bullish
Exhaustion:
- 0.00-0.50: Fresh move
- 0.50-0.75: Mature, watch for reversals
- 0.75-0.85: High exhaustion
- 0.85-1.00: Critical, reversal imminent
Confidence:
- 0.00-0.30: Low quality
- 0.30-0.50: Moderate quality
- 0.50-0.70: High quality
- 0.70-1.00: Premium quality
Common Questions
Why no signals?
- Blend mode: lower temperature to 0.3-0.5
- Loosen OB/OS to 65/35
- Lower min confidence to 0.35
- Reduce spacing requirements
- Use Confirmed instead of Pivot Validated
Why frequent oscillator switching?
- Normal during warmup (first 200+ bars)
- After warmup: may indicate regime shifting market
- Lower temperature in Blend mode
- Reduce learning rate or epsilon
Blend vs Switch?
Use Switch for backtesting and maximum exploitation.
Use Blend for live trading with temperature 0.3-0.5 for stability.
Recalibration frequency?
Never needed. System continuously adapts via bandit learning and weight decay.
Risk Management Integration
Position Sizing:
- 0.30-0.50 confidence: 0.5-1.0% risk
- 0.50-0.70 confidence: 1.0-1.5% risk
- 0.70+ confidence: 1.5-2.0% risk (maximum)
Stop Placement:
- Reversals: beyond divergence pivot plus 1.0-1.5×ATR
- Continuations: beyond recent swing opposite direction
Targets:
- Primary: 2-3×ATR from entry
- Scale at interim levels
- Trail after 1.5×ATR in profit
Important Disclaimers
BPA-ML is an advanced technical analysis tool for identifying high-probability divergence patterns and assessing market state. It is not a complete trading system. Machine learning components adapt to historical patterns, which does not guarantee future performance. Proper risk management, position sizing, and additional confirmation methods are essential. No indicator eliminates losing trades.
Backtesting results may differ from live performance due to execution factors and dynamic bandit learning. Always validate on demo before committing real capital. CAE filtering reduces but does not eliminate false signals. Market conditions change rapidly. Use appropriate stops and never risk excessive capital on any single trade.
— Dskyz, Trade with insight. Trade with anticipation.

Fundamental Macro Timeline & Forecast [100Zabaan]🟢🟢 Fundamental Macro Timeline & Forecast 🟢🟢
This indicator is a macro-level fundamental analysis tool for major Forex currency pairs (USD, EUR, GBP, JPY, CHF, AUD, NZD, CAD). It displays five key economic indicators of both currencies in a table format, presented as an oscillator. The indicator is provided as closed-source and is designed solely for research and analysis purposes (no backtesting, no direct buy/sell signals). It is closed-source to protect our proprietary weighting algorithm for each indicator and to support planned expansion into larger projects; open-sourcing would compromise our business model.
Written in Pine Script™ v6
🟡 Concept of “Red Lines” in Economic Indicators
Central banks and policy authorities define target or “safe” ranges for each economic indicator. A sustained deviation beyond these ranges is considered a “red line” typically triggering monetary or fiscal policy responses. For example, the inflation red line in the United States is around 2%; if monthly or annual inflation exceeds this level, the Federal Reserve may implement contractionary measures (e.g., raising interest rates) to control inflation.
🟡 Indicator Inputs & Settings
Language: Table language (English or Persian; default: English).
Table Design: Layout orientation (horizontal or vertical).
Display Yearly Averages: When enabled, displays both 1-year and 10-year averages for each indicator.
Convert M1 to USD: When enabled, converts M1 money supply values to US dollars.
Market Restriction: Operates only on Forex pairs combining the eight major currencies listed above. Displays a warning if an unsupported symbol is selected.
Timeframes: Operates on timeframes from 1 minute up to Daily, with a recommendation to use Daily or Hourly charts.
🟡 Indicator Output
The indicator renders a dynamic table in the oscillator pane at the bottom of the chart, featuring five main columns:
Current Values: The latest value of each indicator (interest rate, monthly inflation rate, GDP growth rate, M1 money supply, unemployment rate) for both currencies in the selected pair.
Previous Values: The prior period’s value for each indicator.
Average (1 Year): The 1-year average for each indicator (if enabled).
Average (10 Years):** The 10-year average for each indicator (if enabled).
Forecast (%): The percentage likelihood of the base currency (left side of the pair) appreciating against the quote currency (right side), based on the combined impact of the five indicators.
Note: Forecast values range from 0 to 100, and values of exactly 0 or 100 are rare due to inherent uncertainty.
🟡 Forecast Logic
Baseline Assumption: A 50% probability that either currency will appreciate.
Adjustment Based on Deviations from “Red Lines”: Each economic indicator influences the forecast according to its deviation from long-term target ranges:
Inflation: Sustained inflation above the target (e.g., 2% in the US) typically prompts contractionary measures (rate hikes), strengthening the currency.
Interest Rate: Higher interest rates generally attract foreign investment and strengthen the currency.
GDP Growth: Positive GDP growth signals a strong economy and typically strengthens the currency.
Money Supply (M1): High money supply growth can lead to inflation, weakening the currency over the long term.
Unemployment Rate: High unemployment indicates economic weakness and usually weakens the currency.
3. Combining Effects: The individual impacts of each indicator are aggregated to calculate the final probability of the base currency appreciating against the quote currency.
🟡 Practical Example
Assume your chart is set to the **USDJPY** currency pair:
Step 1 (US Inflation): Monthly inflation in the United States is -0.15%. We infer that the Federal Reserve will likely implement expansionary policies (rate cuts or money supply increases) to counter deflation. Consequently:
We reduce the probability of the **US Dollar** appreciating against the Yen from 50% to 45%.
We increase the probability of the **Japanese Yen** appreciating against the Dollar to 55%.
Step 2 (Japan Inflation): Monthly inflation in Japan is 0.4%. We infer that the Bank of Japan will implement contractionary policies (rate hikes) to control inflation. Therefore:
We reduce the probability of the US Dollar appreciating against the Yen from 45% to 40%.
We increase the probability of the Japanese Yen appreciating against the Dollar to 60%.
We then apply the same adjustment process for the remaining three indicators to derive the final Forecast percentage, providing an overall view of the currency pair’s potential movement.
🟡 Important Notes
Supplementary Tool: This indicator is a complementary tool for fundamental analysis only. Forecasts are not definitive and may evolve with different time horizons.
No Backtesting: Designed solely for economic research; it does not include strategy results or backtesting data.
Combined Use:n Employ this indicator alongside other fundamental and technical analysis methods; it is not a standalone solution.
🔴 Developers: Mr. Mohammad sanaei, Mr. Peyman Mahdavi, Mrs. Hamideh Azari, Mr. Mohsen shabani, Mr. Moslem Balasi, Mr. Shahrokh Nakhaei
⭐️⭐️ Feel free to share your feedback in the comments ⭐️⭐️
این اندیکاتور با ترکیب پنج شاخص کلیدی اقتصادی، تصویری جامع از وضعیت بنیادین دو ارز اصلی ارائه میدهد و به معاملهگران کمک میکند تا تصمیمات خود را با توجه به تحولات پولی و مالی کشورها اتخاذ کنند.
🔴 توسعه دهندگان: محمد ثنائی، پیمان مهدوی، حمیده آذری، محسن شعبانی، مسلم بلاسی، شاهرخ نخعی
⭐️⭐️ لطفاً نظرات خود را در کامنتها با ما در میان بگذارید; از خواندن بازخوردهای شما خوشحال میشویم. ⭐️⭐️

Order + Breaker Blocks - Custom TimeframesThis indicator is a Hidden Liquidity Script, being a much more refined and precise version of "Order Blocks" also known as "Supply and Demand" zones.
This script is more refined and precise as this script is the only script that displays the exact body part of blocks on multiple timeframes, showing potentially powerful price reversal zones for taking a long or short.
This is a PRICE ACTION indicator, demonstrating price action that can result in potential good support/resistance levels for taking a long or short trade.
This indicator only displays the body part of order blocks, instead of including wicks that all other indicators do. That makes this script a much more refined version of all other scripts out there.
Not only that, this script can collate multiple timeframes into one indicator, again something other scripts cannot do.
This script is also unique compared to other Hidden Liquidity style scripts in that you have full control over each Order Block so you can see each individual block on a chart, whilst other charts combine them into a zone instead. This refined version gives you precise potential entries and much further refinement as well as more thorough backtesting capabilities.
This script also can highlight order blocks that pass THROUGH a Fair Value Gap. These are known as 'Breaker Blocks'. These powerful blocks can be places of interest as support or resistance for a long or short trade. Note: This script shows the body part of a block only and not the wick.
Breaker Blocks, where significant displacement has occurred in price past a block can be more powerful. This script does not highlight Fair Value Gaps themselves, only order blocks (supply and demand) and breaker blocks through displacement in price (through an FVG). FVGs on their own can be weaker without order blocks behind them hence they are not highlighted.
The BODY of the order block, and the 0.5 of the order block are key regions for considering a trade, treating that level as either resistance or support.
Important: PLEASE NOTE: This indicator will only show timeframes that are higher than or the same as the current chart timeframe.
For Example, only blocks 3 Days or higher will show on a 3D chart. It will not show 12h blocks on a 3D chart. You would need to go to a 12 hour chart with the 12h blocks showing to see all Blocks that are 12h or higher drawn.
This Script differs from others in that you can DEFINE your OWN TIMEFRAMES.
It caters for 4 timeframes. If it is slow loading, deselect the 3 others and show only one.
LTF can take a looong time to load and may not be possible at all on subscriptions with only 20s compute time on their plan.
However if you have a timeframe in mind you have wanted to check out that is not standard, you can do it with this Indicator.
For seconds, use the digit and add an “S” to it. Eg 45 seconds use “45S”
For Mintues and Hours, you must do them in minute format with no letter added. Eg 145 minutes is “145”. 30 minutes is “30”. 6 hours is “360” minutes. Trading View allows up to 24 hours in minute format.
For Days, eg 3 Days use “3D”
For Weeks, eg 5 Weeks, use ‘5W”
For Months, eg 6 Months, use “6M”.
If you don’t use the correct format as specified above it will not work or display anything.
SETTINGS:
There is options to change the colours of the boxes and to differentiate between Order Blocks and stronger Breaker Blocks if desired.
If this is NOT desired, make all color options the same color,.
Shown below is blue Order Blocks (Supply and Demand
Shown below there is Pink Breaker Blocks.
There is options to weaken the colour of blocks that have been tapped by a wick and thus partially used up, also called partially "mitigated".These blocks can be considered weaker support/resistance.
Once a block has had a wick or body close over it entirely, the block can be considered fully "mitigated" and will disappear from the indicator once that candle has closed. This block level can now be considered too weak. You can also choose to not show these partially mitigated blocks at all.
The charts above shows pale Violet blocks as partially mitigated or "tapped" blocks.
The blocks in HOT BRIGHT Violet are untapped and potentially stronger levels for a Long or Short trade. See below the 7h.
Additional SETTINGS:
Further options include, if selected: Counting the number of fair value gaps an order block may pass through. More FVGs an order block (now a breaker block) passes through can strengthen the support of that block level, making a reversal more likely.
There is an option of showing old mitigated order blocks and changing the color of these on the chart. This can aid in backtesting of levels.
Further Settings include:
- an option to remove very thin blocks that may not be strong points.
- an option to denote with a character such as a * blocks that have their EQ 0.5 region wicked - these can be considered weaker.
- an option to denote with an additional * or another character blocks that are barely tapped by a small percent so you know they are still considered quite strong.
- an option to show how many candles form the order block.
Additional Options include:
- an option to show blocks only within a specific price range or percent range of the current price.
- an option to only look X number of bars back.
There is Options regarding labelling, and Border widths on boxes.
It is ESSENTIAL to do your own research and backtesting!
It is recommended to combine these levels with other concepts for added confluence.
Other indicators are NOT included in this script. This is purely a refined order block script for the BODY of a block only.
You can combine Order Blocks and stronger versions known as Breaker Blocks in this script with other indicators or concepts to form a Full Trading Strategy.
Other potential concepts to combine, not shown in this script can include Smart Money Concepts, Market Structure, Fibonnaccis, SMAs, EMAs or any other concept to give added confluence to the support / resistance levels identified in this script that may indicate that the level is stronger.
This indicator is not a trading strategy on its own. It is best used in combination with other concepts to improve the success.
Backtesting this indicator is highly recommended and incorporated into a full trading system of your own design. This only identifies possible key regions based on Price Action Strategies.
This indicator simply makes the identification of these hot levels easier and simpler to find, especially across multiple timeframes.
A strong bright zone on the indicator can be a stronger level than a weak partial block that is in light colours.
Again -Please do your own research and backtesting.
These indicators make finding these levels much much simpler and easier when combined with a full trading strategy.
Any feedback is welcome.

Order + Breaker Blocks MTF - Vees Hidden LiquidityThis indicator is a Hidden Liquidity Script, being a much more refined and precise version of "Order Blocks" also known as "Supply and Demand" zones.
This script is more refined and precise as this script is the only script that displays the exact body part of blocks on multiple timeframes, showing potentially powerful price reversal zones for taking a long or short.
This is a PRICE ACTION indicator, demonstrating price action that can result in potential good support/resistance levels for taking a long or short trade.
This indicator only displays the body part of order blocks, instead of including wicks that all other indicators do. That makes this script a much more refined version of all other scripts out there.
Not only that, this script can collate multiple timeframes into one indicator, again something other scripts cannot do.
This script is also unique compared to other Hidden Liquidity style scripts in that you have full control over each Order Block so you can see each individual block on a chart, whilst other charts combine them into a zone instead. This refined version gives you precise potential entries and much further refinement as well as more thorough backtesting capabilities.
This script also can highlight order blocks that pass THROUGH a Fair Value Gap. These are known as 'Breaker Blocks'. These powerful blocks can be places of interest as support or resistance for a long or short trade. Note: This script shows the body part of a block only and not the wick.
Breaker Blocks, where significant displacement has occurred in price past a block can be more powerful. This script does not highlight Fair Value Gaps themselves, only order blocks (supply and demand) and breaker blocks through displacement in price (through an FVG). FVGs on their own can be weaker without order blocks behind them hence they are not highlighted.
The BODY of the order block, and the 0.5 of the order block are key regions for considering a trade, treating that level as either resistance or support.
Important: PLEASE NOTE: This indicator will only show timeframes that are higher than or the same as the current chart timeframe.
For Example, only blocks 3 Days or higher will show on a 3D chart. It will not show 12h blocks on a 3D chart. You would need to go to a 12 hour chart with the 12h blocks showing to see all Blocks that are 12h or higher drawn.
SETTINGS:
There is options to change the colours of the boxes and to differentiate between Order Blocks and stronger Breaker Blocks if desired.
If this is NOT desired, make all color options the same color,.
Shown below is blue Order Blocks (Supply and Demand
Shown below there is Pink Breaker Blocks.
There is options to weaken the colour of blocks that have been tapped by a wick and thus partially used up, also called partially "mitigated".These blocks can be considered weaker support/resistance.
Once a block has had a wick or body close over it entirely, the block can be considered fully "mitigated" and will disappear from the indicator once that candle has closed. This block level can now be considered too weak. You can also choose to not show these partially mitigated blocks at all.
The charts above shows pale Violet blocks as partially mitigated or "tapped" blocks.
The blocks in HOT BRIGHT Violet are untapped and potentially stronger levels for a Long or Short trade. See below the 7h.
Additional SETTINGS:
Further options include, if selected: Counting the number of fair value gaps an order block may pass through. More FVGs an order block (now a breaker block) passes through can strengthen the support of that block level, making a reversal more likely.
There is an option of showing old mitigated order blocks and changing the color of these on the chart. This can aid in backtesting of levels.
Further Settings include:
- an option to remove very thin blocks that may not be strong points.
- an option to denote with a character such as a * blocks that have their EQ 0.5 region wicked - these can be considered weaker.
- an option to denote with an additional * or another character blocks that are barely tapped by a small percent so you know they are still considered quite strong.
- an option to show how many candles form the order block.
Additional Options include:
- an option to show blocks only within a specific price range or percent range of the current price.
- an option to only look X number of bars back.
There is Options regarding labelling, and Border widths on boxes.
It is ESSENTIAL to do your own research and backtesting!
It is recommended to combine these levels with other concepts for added confluence.
Other indicators are NOT included in this script. This is purely a refined order block script for the BODY of a block only.
You can combine Order Blocks and stronger versions known as Breaker Blocks in this script with other indicators or concepts to form a Full Trading Strategy.
Other potential concepts to combine, not shown in this script can include Smart Money Concepts, Market Structure, Fibonnaccis, SMAs, EMAs or any other concept to give added confluence to the support / resistance levels identified in this script that may indicate that the level is stronger.
This indicator is not a trading strategy on its own. It is best used in combination with other concepts to improve the success.
Backtesting this indicator is highly recommended and incorporated into a full trading system of your own design. This only identifies possible key regions based on Price Action Strategies.
This indicator simply makes the identification of these hot levels easier and simpler to find, especially across multiple timeframes.
A strong bright zone on the indicator can be a stronger level than a weak partial block that is in light colours.
Again -Please do your own research and backtesting.
These indicators make finding these levels much much simpler and easier when combined with a full trading strategy.
Any feedback is welcome.
Order + Breaker Blocks HTFThis indicator is a Hidden Liquidity Script, being a much more refined and precise version of "Order Blocks" also known as "Supply and Demand" zones.
This script is more refined and precise as this script is the only script that displays the exact body part of blocks on multiple timeframes, showing potentially powerful price reversal zones for taking a long or short.
This is a PRICE ACTION indicator, demonstrating price action that can result in potential good support/resistance levels for taking a long or short trade.
This indicator only displays the body part of order blocks, instead of including wicks that all other indicators do. That makes this script a much more refined version of all other scripts out there.
Not only that, this script can collate multiple timeframes into one indicator, again something other scripts cannot do.
This script is also unique compared to other Hidden Liquidity style scripts in that you have full control over each Order Block so you can see each individual block on a chart, whilst other charts combine them into a zone instead. This refined version gives you precise potential entries and much further refinement as well as more thorough backtesting capabilities.
This script also can highlight order blocks that pass THROUGH a Fair Value Gap. These are known as 'Breaker Blocks'. These powerful blocks can be places of interest as support or resistance for a long or short trade. Note: This script shows the body part of a block only and not the wick.
Breaker Blocks, where significant displacement has occurred in price past a block can be more powerful. This script does not highlight Fair Value Gaps themselves, only order blocks (supply and demand) and breaker blocks through displacement in price (through an FVG). FVGs on their own can be weaker without order blocks behind them hence they are not highlighted.
The BODY of the order block, and the 0.5 of the order block are key regions for considering a trade, treating that level as either resistance or support.
Important: PLEASE NOTE: This indicator will only show timeframes that are higher than or the same as the current chart timeframe.
For Example, only blocks 3 Days or higher will show on a 3D chart. It will not show 12h blocks on a 3D chart. You would need to go to a 12 hour chart with the 12h blocks showing to see all Blocks that are 12h or higher drawn.
SETTINGS:
There is options to change the colours of the boxes and to differentiate between Order Blocks and stronger Breaker Blocks if desired.
If this is NOT desired, make all color options the same color,.
Shown below is blue Order Blocks (Supply and Demand)
Shown below there is Pink Breaker Blocks.
There is options to weaken the colour of blocks that have been tapped by a wick and thus partially used up, also called partially "mitigated".These blocks can be considered weaker support/resistance.
Once a block has had a wick or body close over it entirely, the block can be considered fully "mitigated" and will disappear from the indicator once that candle has closed. This block level can now be considered too weak. You can also choose to not show these partially mitigated blocks at all.
The chart above shows pale Violet blocks as partially mitigated or "tapped" blocks.
The blocks in HOT BRIGHT Violet are untapped and potentially stronger levels for a Long or Short trade.
See below and example of a HOT PINK stronger level with a 1,2,3,4,5 Days of blocks in the one area.
See below an example of a weaker pink level. Still valid, but potentially riskier. There is a weaker 5D Block in pale pink and no other days in that same zone.
Additional SETTINGS:
Further options include, if selected: Counting the number of fair value gaps an order block may pass through. More FVGs an order block (now a breaker block) passes through can strengthen the support of that block level, making a reversal more likely.
There is an option of showing old mitigated order blocks and changing the color of these on the chart. This can aid in backtesting of levels.
Further Settings include:
- an option to remove very thin blocks that may not be strong points.
- an option to denote with a character such as a * blocks that have their EQ 0.5 region wicked - these can be considered weaker.
- an option to denote with an additional * or another character blocks that are barely tapped by a small percent so you know they are still considered quite strong.
- an option to show how many candles form the order block.
Additional Options include:
- an option to show blocks only within a specific price range or percent range of the current price.
- an option to only look X number of bars back.
There is Options regarding labelling, and Border widths on boxes.
It is ESSENTIAL to do your own research and backtesting!
It is recommended to combine these levels with other concepts for added confluence.
Other indicators are NOT included in this script. This is purely a refined order block script for the BODY of a block only.
You can combine Order Blocks and stronger versions known as Breaker Blocks in this script with other indicators or concepts to form a Full Trading Strategy.
Other potential concepts to combine, not shown in this script can include Smart Money Concepts, Market Structure, Fibonnaccis, SMAs, EMAs or any other concept to give added confluence to the support / resistance levels identified in this script that may indicate that the level is stronger.
This indicator is not a trading strategy on its own. It is best used in combination with other concepts to improve the success.
Backtesting this indicator is highly recommended and incorporated into a full trading system of your own design. This only identifies possible key regions based on Price Action Strategies.
This indicator simply makes the identification of these hot levels easier and simpler to find, especially across multiple timeframes.
A strong bright zone on the indicator can be a stronger level than a weak partial block that is in light colours.
Again -Please do your own research and backtesting.
These indicators make finding these levels much much simpler and easier when combined with a full trading strategy.
Any feedback is welcome.
Majors Sync | QuantEdgeBIntroducing MajorsSyn c by QuantEdgeB
🔹 Overview
🚀 Dynamic Rotation System for BTC, ETH & SOL
MajorsSync is a powerful, rotation-based strategy designed to systematically identify the leading cryptocurrency among the top three majors: Bitcoin (BTC), Ethereum (ETH), and Solana (SOL).
By analyzing inter-market strength, pairwise trend dominance, and individual trend quality, MajorsSync dynamically shifts exposure toward the asset with the highest potential for outperformance, while de-risking during unfavorable conditions.
✨ Core Objective
📌 To allocate capital to the strongest-performing major—BTC, ETH, or SOL—while avoiding underperformers and unnecessary exposure during uncertain market phases.
🧠 How It Works
Majors Sync uses a multi-tiered decision structure:
🔹 1. Individual Asset Trend Evaluation
Each asset is scored using a Trend Performance Index (TPI). These are proprietary models capturing medium-term momentum and structure for:
• BTC
• ETH
• SOL
🔹 2. Pairwise Relative Strength Matrix
Compute TPI values between the asset pairs:
• ETHBTC → Is ETH stronger than BTC?
• SOLETH → Is SOL stronger than ETH?
• SOLBTC → Is SOL stronger than BTC?
These relative TPI readings help construct a score matrix to rank assets 0–2.
🔹 3. Signal Confirmation
Only when the top-ranked asset has a positive TPI, a Long signal is triggered on that asset.
Otherwise, if no asset meets the threshold, the system remains in Cash/Neutral mode to protect capital.
🧮 Capital Allocation Logic
📊 Allocation always rotates to:
• ✅ The strongest asset with a positive trend
• 🛑 Otherwise, goes neutral/cash (no trade)
This ensures capital is placed in high-probability zones only.
💼 Equity System
🧮 An internal equity engine simulates dynamic capital rotation by reallocating to the top-performing major (BTC, ETH, or SOL) at each bar. This allows for transparent tracking of historical strategy performance.
• 💡 If BTC is the top asset → System follows BTC's price change
• 💡 If ETH becomes dominant → It reallocates to ETH
• 💡 If SOL takes over → Position shifts to SOL
• 📉 No asset qualified? → Strategy holds cash
You also get a Buy & Hold BTC benchmark for direct comparison.
⚠️ This simulation reflects past behavior and is not indicative of future results.
📊 Dashboard & Visuals
The built-in dashboard table displays:
• 🧠 Asset Trends (BTC, ETH, SOL)
• 🧩 Matrix values (e.g., ETH vs BTC, SOL vs ETH)
• 🏁 Final Signal Output (which asset is selected)
• 🔁 Real-time Strategy Equity vs Buy & Hold
💪 Why It Works
Majors Sync blends:
• ✅ Inter-market structure (pairwise dominance)
• ✅ Intra-asset momentum (standalone TPI)
• ✅ Position filtering (only acts on positive signals)
• ✅ Capital efficiency (rotates rather than overtrades)
This design reduces drawdowns, avoids stagnation, and seeks to capture medium-term leadership shifts among the top crypto majors.
📊 MajorSync Backtest Metrics
🔹 Sharpe Ratio
Shows the risk-adjusted return by comparing the strategy's return to its overall volatility. Higher is better — it means you're getting more reward per unit of risk.
🔹 Sortino Ratio
Similar to Sharpe, but focuses only on downside volatility (the bad kind). This makes it a better reflection of how the system handles losses specifically.
🔹 Omega Ratio (Ω)
Measures how often the system generates profitable returns versus unprofitable ones. A value above 1 means it wins more than it loses — and the higher it goes, the better.
🔹 Equity Max Drawdown (Eq.Max DD)
This is the deepest decline from peak equity during the test. Lower drawdown means less risk of big losses.
📌 Disclaimer: Backtest results are based on historical data and past market behavior. Performance is not indicative of future results and should not be considered financial advice. Always conduct your own backtests and research before making any investment decisions. 🚀
🚀 Key Benefits
✔️ Trend-Following + Relative Strength Hybrid
✔️ Rotational Capital Efficiency
✔️ De-risking in Weak Conditions
✔️ Optimized for Swing and Medium-Term Positioning
✔️ Visual Clarity + Smart Allocation
🔧 Settings Overview
• Color Mode – Switch visual palette for the base Trend
• Trend Color – Toggle trend-based bar coloring
• Enable Backtest Table – Show historical performance metrics
• Start Date – Control backtest window
🏁 Conclusion
Majors Sync is your intelligent rotation engine for crypto majors.
Instead of guessing which coin to hold, let the system rotate for you—objectively, consistently, and visually.
📈 Be in BTC when it leads. Switch to ETH or SOL when strength shifts. Sit in cash when needed.
📌 Master the market with precision and confidence | QuantEdgeB
🔹 Disclaimer: Past performance is not indicative of future results. No trading strategy can guarantee success in financial markets.
🔹 Strategic Advice: Always backtest, optimize, and align parameters with your trading objectives and risk tolerance before live trading.