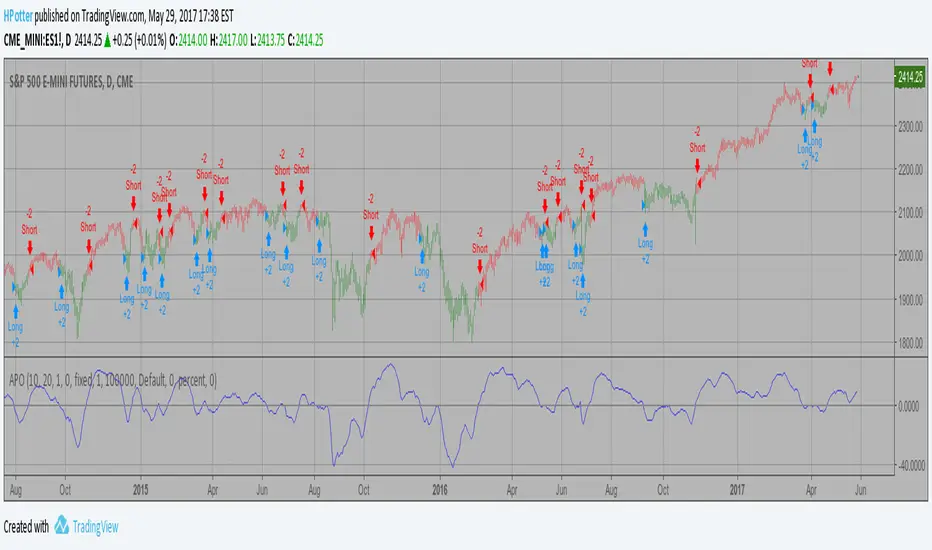
Absolute Price Oscillator (APO) Backtest 2.0 The Absolute Price Oscillator displays the difference between two exponential
moving averages of a security's price and is expressed as an absolute value.
How this indicator works
APO crossing above zero is considered bullish, while crossing below zero is bearish.
A positive indicator value indicates an upward movement, while negative readings
signal a downward trend.
Divergences form when a new high or low in price is not confirmed by the Absolute Price
Oscillator (APO). A bullish divergence forms when price make a lower low, but the APO
forms a higher low. This indicates less downward momentum that could foreshadow a bullish
reversal. A bearish divergence forms when price makes a higher high, but the APO forms a
lower high. This shows less upward momentum that could foreshadow a bearish reversal.
You can change long to short in the Input Settings
WARNING:
- For purpose educate only
- This script to change bars colors.
Поиск скриптов по запросу "bear"

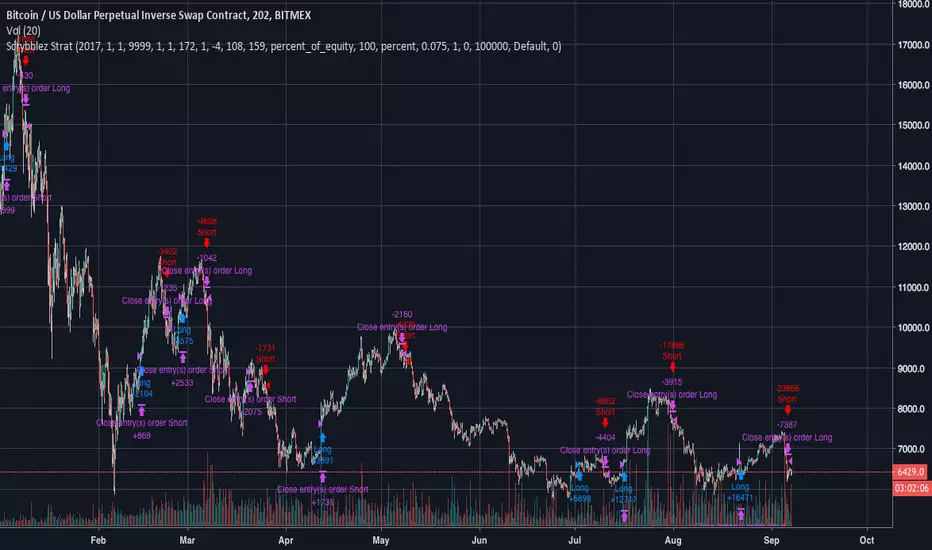
Scrybblez Strategy## Scrybblez Strategy ##
How does this strategy work?
This strategy works particularly well with Bitcoin and can be applied to volatile coins with big swings, but properly configured it will perform decently coins with smaller movements.
Request access for a trial here or by twitter to @scrybblez
It comes preconfigured with settings for 202 minutes, and already takes into account that each transaction will have a commission of 0.075% (Binance and Bitmex both have this comission at the moment) and assumes you'll be starting with a capital of 100,000 and put 100% of this capital into each trade. This works for Bitcoin but fails for some coins when there's not enough liquidity, to have the strategy work with smaller coins change your capital down from 100,000 to 1 or 5 (this will basically be telling Tradingview that you have 1-5 BTCs to trade and not 100,000 BTC).
What timeframes does it work on?
The strategy is particularly setup to work on 202 minutes but will perform well in 1h-6h timeframes.
To use it in different timeframes to its optimum output mainly focus on increasing/decreasing accordingly the following values:
- Bull/Bear EMA Range
- Upper StopLoss band
- Lower StopLoss band
Noise filters play a smaller (but important) role on avoiding too many false entries.
- Bull noise filter
- Bear noise filter
What are all these options I see ?
0.Shorting
Toggle this option on/off depending on if you are in a platform that allows you to short (Bitmex, Bitfinex,...) or a platform that does not allow you to do so (Binance, KuCoin,...).
1. Time function
This strategy comes equipped with a time function that allows you to backtest from any given date to any given date.
Properties:
- From Year
- From Month
- From Day
- To Year
- To Month
- To Day
2. Noise Filtering/Smoothing
To avoid too many false entries the strategy filters noise with several algorithms, you can enable/ disable this Noise filter by turning it on/off with "Use Smoothing" and can configure it's noise cleaning properties with other properties. You can, if you wish, colour your background to easily identify what's the current trend we're on (bear in mind that the indicator does not necessarily exit on Bull/Bear trends if it detects them as temporary or weak ones).
Properties:
- Use Smoothing
- Bull noise filter
- Bear noise filter
- Color Bull/Bear Runs
3. StopLoss Bands
Initially both bands were being used to terminate entries if crossed, but right now they work in conjunction with other internal calculations to determine if we should enter a trade and in minor degree to exit. With the latest changes included in the algorithm, we do not use SL bands to IMMEDIATELY exit positions, but the option is there.
Poperties:
- Upper SL Band
- Lower SL Band
- Use SL Bands to Open Positions.
- Use SL Bands to Close Positions.
4.Ichimoku
By turning this on, you'll plot Ichimoku with Bitcoin settings, you can change it to its original settings by clicking the next option.
Can you give me examples on how well it performs?
Following this strategy from the 1st of January of 2017 until today 7th of September of 2018 would've netted you (comission already substracted) 49286% returns.
Following this strategy from the 1st of September of 2017 until today 7th of September of 2018 would've netted you (comission already substracted) 3941% returns.
Following this strategy from the 1st of January of 2018 until today 7th of September of 2018would've netted you (comission already substracted) 583.96% returns.
Give time to the strategy
BB%/MFI/RSIThe indicator was made by a bear. I have made strategy which uses this indicator.
For any pair.

Grahn Gyllene KorsGrahn Gyllene Kors strategy is an idea that was brought to me and I was asked to create for the client to be used as an early alert signal for when BTC 0.05% is trending. The client has graciously now decided that this should be shared with everyone.
This is an EMA / Trend Explorer useful for identifying trends before EMA's cross and also identifying and experimenting with various EMA lengths and candle trends. There will be a companion Alert study for this released soon in which signals may be sent to the user via sms or email.
EMA Fast and EMA Slow may be adjusted in length and color and their display may be turned on or off.
Bullish X% F/S controls what percentage the EMA Fast should be above EMA Slow before considered bullish and is represented by the Green band on the chart.
Neutral > Y% < is what percentage surrounding the EMA Slow should be considered neutral and is represented by the Yellow band on the chart.
Bearish Z% S/F controls what percentage the EMA Fast should be below EMA Slow before considered bearish and is represented by the Red band on the chart.
Trend Enable determines whether Trend Strength is enforced in addition to EMA divergence.
Bull Strength is the number of candles ranging from 0 to 5 that should be consecutively higher in value before considered to be a trend.
Bear Strength is the number of candles ranging from 0 to 5 that should be consecutively lower in value before considered to be a trend.

WavefinderI made this script to incorporate Stochastic RSI with EMA crossovers and VMACD, it is only to buy and sell (Users can modify it create shorts)
I personally recommend only using this when a downtrend reversal is imminent as it finds the bottom well. Signals generated on a downward moving StochRSI must be ignored. Used best with StochRSI and VMACD indicators.
Thanks to VMACD indicator by Lazy bear.
Use at your own discretion.
The strategy has not been tested in realtime trading, feel free to provide feedback upon use or tracking signals.
Strategy is timeframe dependent (Best at 30min, 2H and 4H) and incorporates risk management.
Modify it according to your wish, I'm just floating an idea which others can improve on.
Current equity usage is 10k and number of contracts is a quotient of the equity and price (adjusted so that all cryptos can be equally compared)
P.S - Also publishing this to make up for the repainting let down on the previous strategies, tried my best on this one.
*version3 used no repaints

Absolute Price Oscillator (APO) Backtest The Absolute Price Oscillator displays the difference between two exponential
moving averages of a security's price and is expressed as an absolute value.
How this indicator works
APO crossing above zero is considered bullish, while crossing below zero is bearish.
A positive indicator value indicates an upward movement, while negative readings
signal a downward trend.
Divergences form when a new high or low in price is not confirmed by the Absolute Price
Oscillator (APO). A bullish divergence forms when price make a lower low, but the APO
forms a higher low. This indicates less downward momentum that could foreshadow a bullish
reversal. A bearish divergence forms when price makes a higher high, but the APO forms a
lower high. This shows less upward momentum that could foreshadow a bearish reversal.
You can change long to short in the Input Settings
Please, use it only for learning or paper trading. Do not for real trading.
Slope Failure (Momentum Stall) STRATEGY//======================================================================================
// SLOPE FAILURE (MOMENTUM STALL) STRATEGY
//--------------------------------------------------------------------------------------
// WHAT THIS STRATEGY DOES
// -----------------------
// This strategy trades **momentum failure**, not trend direction.
//
// Instead of predicting where price will go, it detects when **momentum can no longer
// continue in its current direction** and briefly fades that failure.
//
// Core idea:
// - Momentum expands → slope grows
// - Momentum stalls → slope collapses or flips
// - That stall represents **state transition**, not noise
//
// The system exploits these transitions repeatedly at short horizons.
//
//--------------------------------------------------------------------------------------
// HOW MOMENTUM IS MEASURED
// ------------------------
// 1. Source price (optionally smoothed)
// 2. First derivative (slope = price - price )
// 3. Optional smoothing of the slope itself
//
// The slope represents **instantaneous directional force**, not trend bias.
//
//--------------------------------------------------------------------------------------
// ENTRY LOGIC (SLOPE FAILURE)
// ---------------------------
// • Bull Slope Failure (SHORT):
// - Prior slope was sufficiently positive
// - Current slope collapses to zero or below
// → Upward momentum failed → enter SHORT
//
// • Bear Slope Failure (LONG):
// - Prior slope was sufficiently negative
// - Current slope rises to zero or above
// → Downward momentum failed → enter LONG
//
// Optional:
// - Minimum slope band can be enforced to avoid weak/noisy failures
//
//--------------------------------------------------------------------------------------
// EXIT LOGIC
// ----------
// Primary exits are **force-based**, not price-based:
//
// • Longest Slope Local Turn (optional):
// - Detects when the strongest slope in a recent window has occurred
// - Exits when momentum starts decaying from that extreme
//
// • Percent Stop Loss (optional):
// - Fixed % protection relative to entry price
//
// The strategy does NOT rely on profit targets.
// Winners are exited when **momentum decays**, not when price "looks good".
//
//--------------------------------------------------------------------------------------
// POSITION SIZING
// ---------------
// This strategy supports **percent-of-equity sizing**, computed dynamically:
//
// position size = (account equity × % allocation) / price
//
// This allows:
// - P&L to scale smoothly
// - Drawdowns to remain proportional
// - The same logic to work across symbols and account sizes
//
//--------------------------------------------------------------------------------------
// STRATEGY CHARACTERISTICS
// ------------------------
// • High trade count
// • Win rate near ~45–50%
// • Small, fast losers
// • Slightly larger winners
// • Very low drawdown
//
// This profile is intentionally designed for **scalability**, not prediction.
//
//--------------------------------------------------------------------------------------
// IMPORTANT NOTES
// ---------------
// • This is NOT a trend-following strategy
// • This is NOT a mean-reversion guess
// • This is a momentum **state-transition detector**
//
// The edge comes from structure + exits + sizing — not indicators.
//
//======================================================================================

Combined Signal + Auto Day Plan + Volume📘 TradingView Description — Combined Signal + Auto Day Plan + Volume
Strategy Overview
This strategy combines trend-following signals, daily context levels, and volume confirmation to generate high-probability intraday trading setups.
It is designed to filter noise, identify trend direction early, and avoid trades during low-quality market conditions.
🔷 1. Combined Signal Logic
The strategy merges multiple indicators to produce a single, cleaner signal:
Long Signal
Trend bias is bullish
Momentum histogram (MACD/Custom) shows upward pressure
Price crosses above the midline (WMA/EMA/etc.)
Volume supports the move
Short Signal
Trend bias is bearish
Momentum histogram shows downward pressure
Price crosses below the midline
Volume supports the move
This reduces false breakouts and ensures signals appear only during strong directional moves.
🔶 2. Auto Day Plan Levels (D-1 → D)
The script automatically reads previous day levels and displays them on today’s session:
Previous Day High (PDH)
Previous Day Low (PDL)
Previous Day Close (PDC)
Previous Day Mid / Range Zones
Optional FIB levels or custom zones
These levels act as intraday support/resistance, helping identify breakout, reversal, and retest opportunities.
Behavior:
D-1 levels are plotted from today’s open until today’s close.
Levels do not overlap into the wrong day.
Optional: extend lines to next day (D+1) for planning.
🔷 3. Volume Confirmation
To improve entry accuracy, the script checks for strength in volume:
Volume > X-period average
Volume spike detection
Relative Volume (RVOL) filter
Optional low-volume avoidance
A trade is taken only when the market shows real participation, reducing traps and sideways chop trades.
🔶 4. Entry & Exit Logic
Entry
Long Entry: Combined bull signal + volume confirmation
Short Entry: Combined bear signal + volume confirmation
Exit
Long Exit → Histogram turns down (hist < hist )
Short Exit → Histogram turns up (hist > hist )
Optional:
Auto SL at PDL/PDH
Trailing based on midline
Take profit using FIB or volatility levels
💠 5. Visuals
The chart plots:
Buy/Sell markers
D-1 support/resistance lines
Trend direction midline
Volume confirmation label
Combined signal status
Colors and styles can be customized from the input panel.
🎯 6. Purpose of the Strategy
This is a complete intraday automation tool combining:
✔ Trend
✔ Momentum
✔ Volume strength
✔ Key day levels
The goal is to provide structured, mechanical, rule-based trading — reducing emotional decisions and improving consistency.

Trend Following $BTC - Multi-Timeframe Structure + ReversTREND FOLLOWING STRATEGY - MULTI-TIMEFRAME STRUCTURE BREAKOUT SYSTEM
Strategy Overview
This is an enhanced Turtle Trading system designed for cryptocurrency spot trading. It combines Donchian Channel breakouts with multi-timeframe structure filtering and ATR-based dynamic risk management. The strategy trades both long and short positions using reverse signal exits to maximize trend capture.
Core Features
Multi-Timeframe Structure Filtering
The strategy uses Swing High/Low analysis to identify market structure trends. You can customize the structure timeframe (default: 3 minutes) to match your trading style. Only enters trades aligned with the identified trend direction, avoiding counter-trend positions that often lead to losses.
Reverse Signal Exit System
Instead of using fixed stop-losses or time-based exits, this strategy exits positions only when a reverse entry signal triggers. This approach maximizes trend profits and reduces premature exits during normal market retracements.
ATR Dynamic Pyramiding
Automatically adds positions when price moves 0.5 ATR in your favor. Supports up to 2 units maximum (adjustable). This pyramid scaling enhances profitability during strong trends while maintaining disciplined risk management.
Complete Risk Management
Fixed position sizing at 5000 USD per unit. Includes realistic commission fees of 0.06% (Binance spot rate). Initial capital set at 10,000 USD. All backtest parameters reflect real-world trading conditions.
Trading Logic
Entry Conditions
Long Entry: Close price breaks above the 20-period high AND structure trend is bullish (price breaks above Swing High)
Short Entry: Close price breaks below the 20-period low AND structure trend is bearish (price breaks below Swing Low)
Position Scaling
Long positions: Add when price rises 0.5 ATR or more
Short positions: Add when price falls 0.5 ATR or more
Maximum 2 units including initial entry
Exit Conditions
Long Exit: Triggers when short entry signal appears (price breaks 20-period low + structure turns bearish)
Short Exit: Triggers when long entry signal appears (price breaks 20-period high + structure turns bullish)
Default Parameters
Channel Settings
Entry Channel Period: 20 (Donchian Channel breakout period)
Exit Channel Period: 10 (reserved parameter)
ATR Settings
ATR Period: 20
Stop Loss ATR Multiplier: 2.0
Add Position ATR Multiplier: 0.5
Structure Filter
Swing Length: 300 (Swing High/Low calculation period)
Structure Timeframe: 3 minutes
Adjust these based on your trading timeframe and asset volatility
Position Management
Maximum Units: 2 (including initial entry)
Capital Per Unit: 5000 USD
Visualization Features
Background Colors
Light Green: Bullish market structure
Light Red: Bearish market structure
Dark Green: Long position entry
Dark Red: Short position entry
Optional Display Elements (Default: OFF)
Entry and exit channel lines
Structure high/low reference lines
ATR stop-loss indicator
Next position add level
Entry/exit labels
Alert Message Format
The strategy sends notifications with the following format:
Entry: "5m Long EP:90450.50"
Add Position: "15m Add Long 2/2 EP:91000.25"
Exit: "5m Close Long Reverse Signal"
Where the first part shows your current chart timeframe and EP indicates Entry Price
Backtest Settings
Capital Allocation
Initial Capital: 10,000 USD
Per Entry: 5,000 USD (split into 2 potential entries)
Leverage: 0x (spot trading only)
Trading Costs
Commission: 0.06% (Binance spot VIP0 rate)
Slippage: 0 (adjust based on your experience)
Best Use Cases
Ideal Scenarios
Trending markets with clear directional movement
Moderate to high volatility assets
Timeframes from 1-minute to 4-hour charts
Best suited for major cryptocurrencies with good liquidity
Not Recommended For
Highly volatile choppy/ranging markets
Low liquidity small-cap coins
Extreme market conditions or black swan events
Usage Recommendations
Timeframe Guidelines
1-5 minute charts: Use for scalping, consider Swing Length 100-160
15-30 minute charts: Good for short-term trading, Swing Length 50-100
1-4 hour charts: Suitable for swing trading, Swing Length 20-50
Optimization Tips
Always backtest on historical data before live trading
Adjust swing length based on asset volatility and your timeframe
Different cryptocurrencies may require different parameter settings
Enable visualization options initially to understand entry/exit points
Monitor win rate and drawdown during backtesting
Technical Details
Built on Pine Script v6
No repainting - uses proper bar referencing with offset
Prevents lookahead bias with lookahead=off parameter
Strategy mode with accurate commission and slippage modeling
Multi-timeframe security function for structure analysis
Proper position state tracking to avoid duplicate signals
Risk Disclaimer
This strategy is provided for educational and research purposes only. Past performance does not guarantee future results. Backtesting results may differ from live trading due to slippage, execution delays, and changing market conditions. The strategy performs best in trending markets and may experience drawdowns during ranging conditions. Always practice proper risk management and never risk more than you can afford to lose. It is recommended to paper trade first and start with small position sizes when going live.
How to Use
Add the strategy to your TradingView chart
Select your desired timeframe (1m to 4h recommended)
Adjust parameters based on your risk tolerance and trading style
Review backtest results in the Strategy Tester tab
Set up alerts for automated notifications
Consider paper trading before risking real capital
Tags
Trend Following, Turtle Trading, Donchian Channel, Structure Breakout, ATR, Cryptocurrency, Spot Trading, Risk Management, Pyramiding, Multi-Timeframe Analysis
---
Strategy Name: Trend Following BTC
Version: v1.0
Pine Script Version: v6
Last Updated: December 2025

Trend Following $ZEC - Multi-Timeframe Structure Filter + Revers# Trend Following CRYPTOCAP:ZEC - Strategy Guide
## 📊 Strategy Overview
Trend Following CRYPTOCAP:ZEC is an enhanced Turtle Trading system designed for cryptocurrency spot trading, combining Donchian Channel breakouts, multi-timeframe structure filtering, and ATR-based dynamic risk management for both long and short positions.
---
## 🎯 Core Features
1. Multi-Timeframe Structure Filtering
- Uses Swing High/Low to identify market structure
- Customizable structure timeframe (default: 1 minute)
- Only enters trades in the direction of the trend, avoiding counter-trend positions
2. Reverse Signal Exit
- No fixed stop-loss or fixed-period exits
- Exits only when a reverse entry signal triggers
- Maximizes trend profits, reduces premature exits
3. ATR Dynamic Pyramiding
- Adds positions when price moves 0.5 ATR in favorable direction
- Supports up to 2 units maximum (adjustable)
- Pyramid scaling to enhance profitability
4. Complete Risk Management
- Fixed position size (5000 USD per unit)
- Commission fee 0.06% (Binance spot rate)
- Initial capital 10,000 USD
---
## 📈 Trading Logic
Entry Conditions
✅ Long Entry:
- Close price breaks above 20-period high
- Structure trend is bullish (price breaks above Swing High)
✅ Short Entry:
- Close price breaks below 20-period low
- Structure trend is bearish (price breaks below Swing Low)
Add Position Conditions
- Long: Price rises ≥ 0.5 ATR
- Short: Price falls ≥ 0.5 ATR
- Maximum 2 units including initial entry
Exit Conditions
- Long Exit: When short entry signal triggers (price breaks 20-period low + structure turns bearish)
- Short Exit: When long entry signal triggers (price breaks 20-period high + structure turns bullish)
---
## ⚙️ Parameter Settings
Channel Settings
- Entry Channel Period: 20 (Donchian Channel breakout period)
- Exit Channel Period: 10 (reserved parameter, actually uses reverse signal exit)
ATR Settings
- ATR Period: 20
- Stop Loss ATR Multiplier: 2.0 (reserved parameter)
- Add Position ATR Multiplier: 0.5
Structure Filter
- Swing Length: 160 (Swing High/Low calculation period)
- Structure Timeframe: 1 minute (can change to 5/15/60, etc.)
Position Management
- Maximum Units: 2 (including initial entry)
- Capital Per Unit: 5000 USD
---
## 🎨 Visualization Features
Background Colors
- Light Green: Bullish structure
- Light Red: Bearish structure
- Dark Green: Long entry
- Dark Red: Short entry
Optional Display (Default: OFF)
- Entry/exit channel lines
- Structure high/low lines
- ATR stop-loss line
- Next add position indicator
- Entry/exit labels
---
## 📱 Alert Message Format
Strategy sends notifications on entry/exit with the following format:
- Entry: `1m Long EP:428.26`
- Add Position: `15m Add Long 2/2 EP:429.50`
- Exit: `1m Close Long Reverse Signal`
Where:
- `1m`/`15m` = Current chart timeframe
- `EP` = Entry Price
---
## 💰 Backtest Settings
Capital Allocation
- Initial Capital: 10,000 USD
- Per Entry: 5,000 USD (split into 2 entries)
- Leverage: 0x (spot trading)
Trading Costs
- Commission: 0.06% (Binance spot VIP0)
- Slippage: 0
---
## 🎯 Use Cases
✅ Best Scenarios
- Trending markets
- Moderate volatility assets
- 1-minute to 4-hour timeframes
⚠️ Not Suitable For
- Highly volatile choppy markets
- Low liquidity small-cap coins
- Extreme market conditions (black swan events)
---
## 📊 Usage Recommendations
Timeframe Suggestions
| Timeframe | Trading Style | Suggested Parameter Adjustment |
|-----------|--------------|-------------------------------|
| 1-5 min | Scalping | Swing Length 100-160 |
| 15-30 min | Short-term | Swing Length 50-100 |
| 1-4 hour | Swing Trading | Swing Length 20-50 |
Optimization Tips
1. Adjust swing length based on backtest results
2. Different coins may require different parameters
3. Recommend backtesting on 1-minute chart first before live trading
4. Enable labels to observe entry/exit points
---
## ⚠️ Risk Disclaimer
1. Past Performance Does Not Guarantee Future Results
- Backtest data is for reference only
- Live trading may be affected by slippage, delays, etc.
2. Market Condition Changes
- Strategy performs better in trending markets
- May experience frequent stops in ranging markets
3. Capital Management
- Do not invest more than you can afford to lose
- Recommend setting total capital stop-loss threshold
4. Commission Impact
- Frequent trading accumulates commission fees
- Recommend using exchange discounts (BNB fee reduction, etc.)
---
## 🔧 Troubleshooting
Q: No entry signals?
A: Check if structure filter is too strict, adjust swing length or timeframe
Q: Too many labels displayed?
A: Turn off "Show Labels" option in settings
Q: Poor backtest performance?
A:
1. Check if the coin is suitable for trend-following strategies
2. Adjust parameters (swing length, channel period)
3. Try different timeframes
Q: How to set alerts?
A:
1. Click "Alert" in top-right corner of chart
2. Condition: Select "Strategy - Trend Following CRYPTOCAP:ZEC "
3. Choose "Order filled"
4. Set notification method (Webhook/Email/App)
---
## 📞 Contact Information
Strategy Name: Trend Following CRYPTOCAP:ZEC
Version: v1.0
Pine Script Version: v6
Last Updated: December 2025
---
## 📄 Copyright Notice
This strategy is for educational and research purposes only.
All risks of using this strategy for live trading are borne by the user.
Commercial use without authorization is prohibited.
---
## 🎓 Learning Resources
To understand the strategy principles in depth, recommended reading:
- "The Complete TurtleTrader" - Curtis Faith
- "Trend Following" - Michael Covel
- TradingView Pine Script Official Documentation
---
Happy Trading! Remember to manage your risk 📈

Strategia S&P 500 vs US10Y Yield (od 2000)This strategy explores the macroeconomic relationship between the equity market (S&P 500) and the debt market (10-Year Treasury Yield). Historically, rapid spikes in bond yields often exert downward pressure on equity valuations, leading to corrections or bear markets.
The goal of this strategy is capital preservation. It attempts to switch to cash when yields are rising too aggressively and re-enter the stock market when the bond market stabilizes.

Strategia S&P 500 vs US10Y YieldThis strategy explores the macroeconomic relationship between the equity market (S&P 500) and the debt market (10-Year Treasury Yield). Historically, rapid spikes in bond yields often exert downward pressure on equity valuations, leading to corrections or bear markets.
The goal of this strategy is capital preservation. It attempts to switch to cash when yields are rising too aggressively and re-enter the stock market when the bond market stabilizes.

Advanced Breakout System v2.0Advanced Breakout System v2.0
Developed by: Mohammed Bedaiwi
This script hunts for high-probability breakouts by combining price consolidation zones, volume spikes vs. average volume, smart money flow (OBV), and a Momentum Override for explosive moves that skip consolidation. Additionally, it automatically identifies and plots Support and Resistance levels with price labels to help you visualize market structure.
The system follows a "Watch & Confirm" logic: it first prints a WATCH setup, then a BUY only if price confirms strength.
💡 JUSTIFICATION OF CONCEPTS (MASHUP & ORIGINALITY)
This script is an original mashup combining several analytical concepts to address common breakout failures:
Volatility Compression Engine: Uses built-in functions like ta.highest() and ta.lowest() to mathematically define the setup phase where price volatility is compressed below a user-defined threshold.
Volume Spike Confirmation: The breakout must be confirmed by a volume increase greater than a moving average of volume, signaling strong market interest.
Smart Volume Filter (OBV): This is the key component. By checking if ta.obv is above its own Moving Average, we confirm that accumulation has been occurring during the consolidation period, suggesting institutional positioning before the price break.
Multi-Exit Risk System: Employs dynamic exits (EMA cross, volume dump, bearish pattern) instead of static stop-losses to manage risk adaptively based on real-time market action.
Market Structure Visualization: The script also includes a Support & Resistance engine to plot key swing pivots and price labels for visual context.
✅ STRATEGY RESULTS & POLICY COMPLIANCE
To ensure non-misleading and transparent backtesting results, this strategy is published with the following fully compliant properties:
Dataset Compliance: The backtest is performed on the CMTL Daily (1D) chart across a long history, generating 201 total trades. This significantly exceeds the minimum requirement of 100 trades, providing a robust test dataset.
Risk Control: The strategy uses a conservative order size set to 2% of equity (default_qty_value=2), strictly adhering to the sustainable risk recommendation of 5-10% of equity per trade.
Transaction Costs: Realistic trading conditions are modeled using 0.07% commission and 3 ticks slippage to prevent the overestimation of profitability.
⚙️ VISUAL GUIDE & SIGNAL LOGIC
Key Color Legend (Visual Guide):
WATCH – Setup (Yellow Arrow Down): Potential breakout setup detected.
BUY – Confirmation (Green Arrow Up): Confirmed breakout, triggered when price trades above the high of the WATCH candle.
SELL – Break (Orange Arrow): Short-term trend weakness, triggered when price closes below the Fast EMA (9).
SELL – Dump (Dark Red Arrow): Distribution / volume dump, triggered by a bearish candle with abnormally high volume.
SELL – Pattern (Purple Arrow): Bearish price-action pattern (such as a bearish engulfing).
Support & Resistance Lines (Red/Green): Small horizontal lines plotted at key swing points with exact price labels.
⌨️ INPUTS (DEFAULT SETTINGS)
Entry settings: Consolidation Lookback (default 20) = bars used to detect consolidation. Consolidation Range % (default 12%) = max allowed range size. Volume Spike Multiplier (default 1.2) = factor above average volume to count as a spike. Force Signal on Big Moves (default ON) = forces a WATCH signal on high-momentum moves.
Exit settings: Enable Fast Exit (EMA 9) toggles the SELL – Break signal. Dump Volume Multiplier defines what counts as “dump” volume.
Support & Resistance: Adjustable Pivot Left/Right bars control the sensitivity of the support and resistance lines.
⚠️ Disclaimer Trading involves significant risk of loss. This script is for educational and informational purposes only and is not financial advice or a recommendation to buy or sell any asset. BUY and SELL signals are rule-based and derived from historical behavior and do not guarantee future performance. Always use your own analysis and risk management. This is an open-source strategy; users are encouraged to test it across different symbols and timeframes.

ALT Risk Metric StrategyHere's a professional write-up for your ALT Risk Strategy script:
ALT/BTC Risk Strategy - Multi-Crypto DCA with Bitcoin Correlation Analysis
Overview
This strategy uses Bitcoin correlation as a risk indicator to time entries and exits for altcoins. By analyzing how your chosen altcoin performs relative to Bitcoin, the strategy identifies optimal accumulation periods (when alt/BTC is oversold) and profit-taking opportunities (when alt/BTC is overbought). Perfect for traders who want to outperform Bitcoin by strategically timing altcoin positions.
Key Innovation: Why Alt/BTC Matters
Most traders focus solely on USD price, but Alt/BTC ratios reveal true altcoin strength:
When Alt/BTC is low → Altcoin is undervalued relative to Bitcoin (buy opportunity)
When Alt/BTC is high → Altcoin has outperformed Bitcoin (take profits)
This approach captures the rotation between BTC and alts that drives crypto cycles
Key Features
📊 Advanced Technical Analysis
RSI (60% weight): Primary momentum indicator on weekly timeframe
Long-term MA Deviation (35% weight): Measures distance from 150-period baseline
MACD (5% weight): Minor confirmation signal
EMA Smoothing: Filters noise while maintaining responsiveness
All calculations performed on Alt/BTC pairs for superior market timing
💰 3-Tier DCA System
Level 1 (Risk ≤ 70): Conservative entry, base allocation
Level 2 (Risk ≤ 50): Increased allocation, strong opportunity
Level 3 (Risk ≤ 30): Maximum allocation, extreme undervaluation
Continuous buying: Executes every bar while below threshold for true DCA behavior
Cumulative sizing: L3 triggers = L1 + L2 + L3 amounts combined
📈 Smart Profit Management
Sequential selling: Must complete L1 before L2, L2 before L3
Percentage-based exits: Sell portions of position, not fixed amounts
Auto-reset on re-entry: New buy signals reset sell progression
Prevents premature full exits during volatile conditions
🤖 3Commas Automation
Pre-configured JSON webhooks for Custom Signal Bots
Multi-exchange support: Binance, Coinbase, Kraken, Bitfinex, Bybit
Flexible quote currency: USD, USDT, or BUSD
Dynamic order sizing: Automatically adjusts to your tier thresholds
Full webhook documentation compliance
🎨 Multi-Asset Support
Pre-configured for popular altcoins:
ETH (Ethereum)
SOL (Solana)
ADA (Cardano)
LINK (Chainlink)
UNI (Uniswap)
XRP (Ripple)
DOGE
RENDER
Custom option for any other crypto
How It Works
Risk Metric Calculation (0-100 scale):
Fetches weekly Alt/BTC price data for stability
Calculates RSI, MACD, and deviation from 150-period MA
Normalizes MACD to 0-100 range using 500-bar lookback
Combines weighted components: (MACD × 0.05) + (RSI × 0.60) + (Deviation × 0.35)
Applies 5-period EMA smoothing for cleaner signals
Color-Coded Risk Zones:
Green (0-30): Extreme buying opportunity - Alt heavily oversold vs BTC
Lime/Yellow (30-70): Accumulation range - favorable risk/reward
Orange (70-85): Caution zone - consider taking initial profits
Red/Maroon (85-100+): Euphoria zone - aggressive profit-taking
Entry Logic:
Buys execute every candle when risk is below threshold
As risk decreases, position sizing automatically scales up
Example: If risk drops from 60→25, you'll be buying at L1 rate until it hits 50, then L2 rate, then L3 rate
Exit Logic:
Sells only trigger when in profit AND risk exceeds thresholds
Sequential execution ensures partial profit-taking
If new buy signal occurs before all sells complete, sell levels reset to L1
Configuration Guide
Choosing Your Altcoin:
Select crypto from dropdown (or use CUSTOM for unlisted coins)
Pick your exchange
Choose quote currency (USD, USDT, BUSD)
Risk Metric Tuning:
Long Term MA (default 150): Higher = more extreme signals, Lower = more frequent
RSI Length (default 10): Lower = more volatile, Higher = smoother
Smoothing (default 5): Increase for less noise, decrease for faster reaction
Buy Settings (Aggressive DCA Example):
L1 Threshold: 70 | Amount: $5
L2 Threshold: 50 | Amount: $6
L3 Threshold: 30 | Amount: $7
Total L3 buy = $18 per candle when deeply oversold
Sell Settings (Balanced Exit Example):
L1: 70 threshold, 25% position
L2: 85 threshold, 35% position
L3: 100 threshold, 40% position (final exit)
3Commas Setup
Bot Configuration:
Create Custom Signal Bot in 3Commas
Set trading pair to your altcoin/USD (e.g., ETH/USD, SOL/USDT)
Order size: Select "Send in webhook, quote" to use strategy's dollar amounts
Copy Bot UUID and Secret Token
Script Configuration:
Paste credentials into 3Commas section inputs
Check "Enable 3Commas Alerts"
Save and apply to chart
TradingView Alert:
Create Alert → Condition: "alert() function calls only"
Webhook URL: api.3commas.io
Enable "Webhook URL" checkbox
Expiration: Open-ended
Strategy Advantages
✅ Outperform Bitcoin: Designed specifically to beat BTC by timing alt rotations
✅ Capture Alt Seasons: Automatically accumulates when alts lag, sells when they pump
✅ Risk-Adjusted Sizing: Buys more when cheaper (better risk/reward)
✅ Emotional Discipline: Systematic approach removes fear and FOMO
✅ Multi-Asset: Run same strategy across multiple altcoins simultaneously
✅ Proven Indicators: Combines RSI, MACD, and MA deviation - battle-tested tools
Backtesting Insights
Optimal Timeframes:
Daily chart: Best for backtesting and signal generation
Weekly data is fetched internally regardless of display timeframe
Historical Performance Characteristics:
Accumulates heavily during bear markets and BTC dominance periods
Captures explosive altcoin rallies when BTC stagnates
Sequential selling preserves capital during extended downtrends
Works best on established altcoins with multi-year history
Risk Considerations:
Requires capital reserves for extended accumulation periods
Some altcoins may never recover if fundamentals deteriorate
Past correlation patterns may not predict future performance
Always size positions according to personal risk tolerance
Visual Interface
Indicator Panel Displays:
Dynamic color line: Green→Lime→Yellow→Orange→Red as risk increases
Horizontal threshold lines: Dashed lines mark your buy/sell levels
Entry/Exit labels: Green labels for buys, Orange/Red/Maroon for sells
Real-time risk value: Numerical display on price scale
Customization:
All threshold lines are adjustable via inputs
Color scheme clearly differentiates buy zones (green spectrum) from sell zones (red spectrum)
Line weights emphasize most extreme thresholds (L3 buy and L3 sell)
Strategy Philosophy
This strategy is built on the principle that altcoins move in cycles relative to Bitcoin. During Bitcoin rallies, alts often bleed against BTC (high sell, accumulate). When Bitcoin consolidates, alts pump (take profits). By measuring risk on the Alt/BTC chart instead of USD price, we time these rotations with precision.
The 3-tier system ensures you're always averaging in at better prices and scaling out at better prices, maximizing your Bitcoin-denominated returns.
Advanced Tips
Multi-Bot Strategy:
Run this on 5-10 different altcoins simultaneously to:
Diversify correlation risk
Capture whichever alt is pumping
Smooth equity curve through rotation
Pairing with BTC Strategy:
Use alongside the BTC DCA Risk Strategy for complete portfolio coverage:
BTC strategy for core holdings
ALT strategies for alpha generation
Rebalance between them based on BTC dominance
Threshold Calibration:
Check 2-3 years of historical data for your chosen alt
Note where risk metric sat during major bottoms (set buy thresholds)
Note where it peaked during euphoria (set sell thresholds)
Adjust for your risk tolerance and holding period
Credits
Strategy Development & 3Commas Integration: Claude AI (Anthropic)
Technical Analysis Framework: RSI, MACD, Moving Average theory
Implementation: pommesUNDwurst
Disclaimer
This strategy is for educational purposes only. Cryptocurrency trading involves substantial risk of loss. Altcoins are especially volatile and many fail completely. The strategy assumes liquid markets and reliable Alt/BTC price data. Always do your own research, understand the fundamentals of any asset you trade, and never risk more than you can afford to lose. Past performance does not guarantee future results. The authors are not financial advisors and assume no liability for trading decisions.
Additional Warning: Using leverage or trading illiquid altcoins amplifies risk significantly. This strategy is designed for spot trading of established cryptocurrencies with deep liquidity.
Tags: Altcoin, Alt/BTC, DCA, Risk Metric, Dollar Cost Averaging, 3Commas, ETH, SOL, Crypto Rotation, Bitcoin Correlation, Automated Trading, Alt Season
Feel free to modify any sections to better match your style or add specific backtesting results you've observed! 🚀Claude is AI and can make mistakes. Please double-check responses. Sonnet 4.5

BTC DCA Risk Metric StrategyBTC DCA Risk Strategy - Automated Dollar Cost Averaging with 3Commas Integration
Overview
This strategy combines the proven Oakley Wood Risk Metric with an intelligent tiered Dollar Cost Averaging (DCA) system, designed to help traders systematically accumulate Bitcoin during periods of low risk and take profits during high-risk conditions.
Key Features
📊 Multi-Component Risk Assessment
4-Year SMA Deviation: Measures Bitcoin's distance from its long-term mean
20-Week MA Analysis: Tracks medium-term momentum shifts
50-Day/50-Week MA Ratio: Captures short-to-medium term trend strength
All metrics are normalized by time to account for Bitcoin's maturing market dynamics
💰 3-Tier DCA Buy System
Level 1 (Low Risk): Conservative entry with base allocation
Level 2 (Lower Risk): Increased allocation as opportunity improves
Level 3 (Extreme Low Risk): Maximum allocation during rare buying opportunities
Buys execute every bar while risk remains below thresholds, enabling true DCA accumulation
📈 Progressive Profit Taking
Sell Level 1: Take initial profits as risk increases
Sell Level 2: Scale out further positions during elevated risk
Sell Level 3: Final exit during extreme market conditions
Sell levels automatically reset when new buy signals occur, allowing flexible re-entry
🤖 3Commas Integration
Fully automated webhook alerts for Custom Signal Bots
JSON payloads formatted per 3Commas API specifications
Supports multiple exchanges (Binance, Coinbase, Kraken, Gemini, Bybit)
Configurable quote currency (USD, USDT, BUSD)
How It Works
The strategy calculates a composite risk metric (0-1 scale):
0.0-0.2: Extreme buying opportunity (green zone)
0.2-0.5: Favorable accumulation range (yellow zone)
0.5-0.8: Neutral to cautious territory (orange zone)
0.8-1.0+: High risk, profit-taking zone (red zone)
Buy Logic: As risk decreases, position sizes increase automatically. If risk drops from L1 to L3 threshold, the strategy combines all three tier allocations for maximum exposure.
Sell Logic: Sequential profit-taking ensures you capture gains progressively. The system won't advance to Sell L2 until L1 completes, preventing premature full exits.
Configuration
Risk Metric Parameters:
All calculations use Bitcoin price data (any BTC chart works)
Time-normalized formulas adapt to market maturity
No manual parameter tuning required
Buy Settings:
Set risk thresholds for each tier (default: 0.20, 0.10, 0.00)
Define dollar amounts per tier (default: $10, $15, $20)
Fully customizable to your risk tolerance and capital
Sell Settings:
Configure risk thresholds for profit-taking (default: 1.00, 1.50, 2.00)
Set percentage of position to sell at each level (default: 25%, 35%, 40%)
3Commas Setup:
Create a Custom Signal Bot in 3Commas
Copy Bot UUID and Secret Token into strategy inputs
Enable 3Commas Alerts checkbox
Create TradingView alert: Condition → "alert() function calls only", Webhook → api.3commas.io
Backtesting Results
Strengths:
Systematically buys dips without emotion
Averages down during extended bear markets
Captures explosive bull run profits through tiered exits
Pyramiding (1000 max orders) allows true DCA behavior
Considerations:
Requires sufficient capital for multiple buys during prolonged downtrends
Backtest on Daily timeframe for most reliable signals
Past performance does not guarantee future results
Visual Design
The indicator pane displays:
Color-coded risk metric line: Changes from white→red→orange→yellow→green as risk decreases
Background zones: Green (buy), yellow (hold), red (sell) areas
Dashed threshold lines: Clear visual markers for each buy/sell level
Entry/Exit labels: Green buy labels and orange/red sell labels mark all trades
Credits
Original Risk Metric: Oakley Wood
Strategy Development & 3Commas Integration: Claude AI (Anthropic)
Modifications: pommesUNDwurst
Disclaimer
This strategy is for educational and informational purposes only. Cryptocurrency trading carries substantial risk of loss. Always conduct your own research and never invest more than you can afford to lose. The authors are not financial advisors and assume no responsibility for trading decisions made using this tool.

Gyspy Bot Trade Engine - V1.2B - Strategy 12-7-25 - SignalLynxGypsy Bot Trade Engine (MK6 V1.2B) - Ultimate Strategy & Backtest
Brought to you by Signal Lynx | Automation for the Night-Shift Nation 🌙
1. Executive Summary & Architecture
Gypsy Bot (MK6 V1.2B) is not merely a strategy; it is a massive, modular Trade Engine built specifically for the TradingView Pine Script environment. While most strategies rely on a single dominant indicator (like an RSI cross or a MACD flip) to generate signals, Gypsy Bot functions as a sophisticated Consensus Algorithm.
The engine calculates data from up to 12 distinct Technical Analysis Modules simultaneously on every bar closing. It aggregates these signals into a "Vote Count" and only executes a trade entry when a user-defined threshold of concurring signals is met. This "Voting System" acts as a noise filter, requiring multiple independent mathematical models—ranging from volume flow and momentum to cyclical harmonics and trend strength—to agree on market direction before capital is committed.
Beyond entries, Gypsy Bot features a proprietary Risk Management suite called the Dump Protection Team (DPT). This logic layer operates independently of the entry modules, specifically scanning for "Moon" (Parabolic) or "Nuke" (Crash) volatility events to force-exit positions, overriding standard stops to preserve capital during Black Swan events.
2. ⚠️ The Philosophy of "Curve Fitting" (Must Read)
One must be careful when applying Gypsy Bot to new pairs or charts.
To be fully transparent: Gypsy Bot is, by definition, a very advanced curve-fitting engine. Because it grants the user granular control over 12 modules, dozens of thresholds, and specific voting requirements, it is extremely easy to "over-fit" the data. You can easily toggle switches until the backtest shows a 100% win rate, only to have the strategy fail immediately in live markets because it was tuned to historical noise rather than market structure.
To use this engine successfully, you must adopt a specific optimization mindset:
Ignore Raw Net Profit: Do not tune for the highest dollar amount. A strategy that makes $1M in the backtest but has a 40% drawdown is useless.
Prioritize Stability: Look for a high Profit Factor (1.5+), a high Percent Profitable, and a smooth equity curve.
Regular Maintenance is Mandatory: Markets shift regimes (e.g., from Bull Trend to Crab Range). Parameters that worked perfectly in 2021 may fail in 2024. Gypsy Bot settings should be reviewed and adjusted at regular intervals (e.g., quarterly) to ensure the voting logic remains aligned with current market volatility.
Timeframe Recommendations:
Gypsy Bot is optimized for High Time Frame (HTF) trend following. It generally produces the most reliable results on charts ranging from 1-Hour to 12-Hours, with the 4-Hour timeframe historically serving as the "sweet spot" for most major cryptocurrency assets.
3. The Voting Mechanism: How Entries Are Generated
The heart of the Gypsy Bot engine is the ActivateOrders input (found in the "Order Signal Modifier" settings).
The engine constantly monitors the output of all enabled Modules.
Long Votes: GoLongCount
Short Votes: GoShortCount
If you have 10 Modules enabled, and you set ActivateOrders to 7:
The engine will ONLY trigger a Buy Entry if 7 or more modules return a valid "Buy" signal on the same closed candle.
If only 6 modules agree, the trade is rejected.
This allows you to mix "Leading" indicators (Oscillators) with "Lagging" indicators (Moving Averages) to create a high-probability entry signal that requires momentum, volume, and trend to all be in alignment.
4. Technical Deep Dive: The 12 Modules
Gypsy Bot allows you to toggle the following modules On/Off individually to suit the asset you are trading.
Module 1: Modified Slope Angle (MSA)
Logic: Calculates the geometric angle of a moving average relative to the timeline.
Function: It filters out "lazy" trends. A trend is only considered valid if the slope exceeds a specific steepness threshold. This helps avoid entering trades during weak drifts that often precede a reversal.
Module 2: Correlation Trend Indicator (CTI)
Logic: Based on John Ehlers' work, this measures how closely the current price action correlates to a straight line (a perfect trend).
Function: It outputs a confidence score (-1 to 1). Gypsy Bot uses this to ensure that we are not just moving up, but moving up with high statistical correlation, reducing fake-outs.
Module 3: Ehlers Roofing Filter
Logic: A sophisticated spectral filter that combines a High-Pass filter (to remove long-term drift) with a Super Smoother (to remove high-frequency noise).
Function: It attempts to isolate the "Roof" of the price action. It is excellent at catching cyclical turning points before standard moving averages react.
Module 4: Forecast Oscillator
Logic: Uses Linear Regression forecasting to predict where price "should" be relative to where it is.
Function: When the Forecast Oscillator crosses its zero line, it indicates that the regression trend has flipped. We offer both "Aggressive" and "Conservative" calculation modes for this module.
Module 5: Chandelier ATR Stop
Logic: A volatility-based trend follower that hangs a "leash" (ATR multiple) from the highest high (for longs) or lowest low (for shorts).
Function: Used here as an entry filter. If price is above the Chandelier line, the trend is Bullish. It also includes a "Bull/Bear Qualifier" check to ensure structural support.
Module 6: Crypto Market Breadth (CMB)
Logic: This is a macro-filter. It pulls data from multiple major tickers (BTC, ETH, and Perpetual Contracts) across different exchanges.
Function: It calculates a "Market Health" percentage. If Bitcoin is rising but the rest of the market is dumping, this module can veto a trade, ensuring you don't buy into a "fake" rally driven by a single asset.
Module 7: Directional Index Convergence (DIC)
Logic: Analyzes the convergence/divergence between Fast and Slow Directional Movement indices.
Function: Identifies when trend strength is expanding. A buy signal is generated only when the positive directional movement overpowers the negative movement with expanding momentum.
Module 8: Market Thrust Indicator (MTI)
Logic: A volume-weighted breadth indicator. It uses Advance/Decline data and Up/Down Volume data.
Function: This is one of the most powerful modules. It confirms that price movement is supported by actual volume flow. We recommend using the "SSMA" (Super Smoother) MA Type for the cleanest signals on the 4H chart.
Module 9: Simple Ichimoku Cloud
Logic: Traditional Japanese trend analysis using the Tenkan-sen and Kijun-sen.
Function: Checks for a "Kumo Breakout." Price must be fully above the Cloud (for longs) or below it (for shorts). This is a classic "trend confirmation" module.
Module 10: Simple Harmonic Oscillator
Logic: Analyzes the harmonic wave properties of price action to detect cyclical tops and bottoms.
Function: Serves as a counter-trend or early-reversal detector. It tries to identify when a cycle has bottomed out (for buys) or topped out (for sells) before the main trend indicators catch up.
Module 11: HSRS Compression / Super AO
Logic: Two options in one.
HSRS: Hirashima Sugita Resistance Support. Detects volatility compression (squeezes) relative to dynamic support/resistance bands.
Super AO: A combination of the Awesome Oscillator and SuperTrend logic.
Function: Great for catching explosive moves that result from periods of low volatility (consolidation).
Module 12: Fisher Transform (MTF)
Logic: Converts price data into a Gaussian normal distribution.
Function: Identifies extreme price deviations. This module uses Multi-Timeframe (MTF) logic to look at higher-timeframe trends (e.g., looking at the Daily Fisher while trading the 4H chart) to ensure you aren't trading against the major trend.
5. Global Inhibitors (The Veto Power)
Even if 12 out of 12 modules vote "Buy," Gypsy Bot performs a final safety check using Global Inhibitors. If any of these are triggered, the trade is blocked.
Bitcoin Halving Logic:
Hardcoded dates for past and projected future Bitcoin halvings (up to 2040).
Trading is inhibited or restricted during the chaotic weeks immediately surrounding a Halving event to avoid volatility crushes.
Miner Capitulation:
Uses Hash Rate Ribbons (Moving averages of Hash Rate).
If miners are capitulating (Shutting down rigs due to unprofitability), the engine flags a "Bearish" regime and can flip logic to Short-only or flat.
ADX Filter (Flat Market Protocol):
If the Average Directional Index (ADX) is below a specific threshold (e.g., 20), the market is deemed "Flat/Choppy." The bot will refuse to open trend-following trades in a flat market.
CryptoCap Trend:
Checks the total Crypto Market Cap chart. If the broad market is in a downtrend, it can inhibit Long entries on individual altcoins.
6. Risk Management & The Dump Protection Team (DPT)
Gypsy Bot separates "Entry Logic" from "Risk Management Logic."
Dump Protection Team (DPT)
This is a specialized logic branch designed to save the account during Black Swan events.
Nuke Protection: If the DPT detects a volatility signature consistent with a flash crash, it overrides all other logic and forces an immediate exit.
Moon Protection: If a parabolic pump is detected that violates statistical probability (Bollinger deviations), DPT can force a profit take before the inevitable correction.
Advanced Adaptive Trailing Stop (AATS)
Unlike a static trailing stop (e.g., "trail by 5%"), AATS is dynamic.
Penthouse Level: If price is at the top of the HSRS channel (High Volatility), the stop loosens to allow for wicks.
Dungeon Level: If price is compressed at the bottom, the stop tightens to protect capital.
Staged Take Profits
TP1: Scalp a portion (e.g., 10%) to cover fees and secure a win.
TP2: Take the bulk of profit.
TP3: Leave a "Runner" position with a loose trailing stop to catch "Moon" moves.
7. Recommended Setup Guide
When applying Gypsy Bot to a new chart, follow this sequence:
Set Timeframe: 4 Hours (4H).
Reset: Turn OFF Trailing Stop, Stop Loss, and Take Profits. (We want to see raw entry performance first).
Tune DPT: Adjust "Dump/Moon Protection" inputs first. These have the highest impact on net performance.
Tune Module 8 (MTI): This module is a heavy filter. Experiment with the MA Type (SSMA is recommended).
Select Modules: Enable/Disable modules 1-12 based on the asset's personality (Trending vs. Ranging).
Voting Threshold: Adjust ActivateOrders. A lower number = More Trades (Aggressive). A higher number = Fewer, higher conviction trades (Conservative).
Final Polish: Re-enable Stop Losses, Trailing Stops, and Staged Take Profits to smooth the equity curve and define your max risk per trade.
8. Technical Specs
Engine Version: Pine Script V6
Repainting: This strategy uses Closed Candle data for all Risk Management and Entry decisions. This ensures that Backtest results align closely with real-time behavior (no repainting of historical signals).
Alerts: This script generates Strategy alerts. If you require visual-only alerts, see the source code header for instructions on switching to "Study" (Indicator) mode.
Disclaimer:
This script is a complex algorithmic tool for market analysis. Past performance is not indicative of future results. Use this tool to assist your own decision-making, not to replace it.
9. About Signal Lynx
Automation for the Night-Shift Nation 🌙
Signal Lynx focuses on helping traders and developers bridge the gap between indicator logic and real-world automation. The same RM engine you see here powers multiple internal systems and templates, including other public scripts like the Super-AO Strategy with Advanced Risk Management.
We provide this code open source under the Mozilla Public License 2.0 (MPL-2.0) to:
Demonstrate how Adaptive Logic and structured Risk Management can outperform static, one-layer indicators
Give Pine Script users a battle-tested RM backbone they can reuse, remix, and extend
If you are looking to automate your TradingView strategies, route signals to exchanges, or simply want safer, smarter strategy structures, please keep Signal Lynx in your search.
License: Mozilla Public License 2.0 (Open Source).
If you make beneficial modifications, please consider releasing them back to the community so everyone can benefit.

XAUUSD 1m SMC Zones (BOS + Flexible TP Modes + Trailing Runner)//@version=6
strategy("XAUUSD 1m SMC Zones (BOS + Flexible TP Modes + Trailing Runner)",
overlay = true,
initial_capital = 10000,
pyramiding = 10,
process_orders_on_close = true)
//━━━━━━━━━━━━━━━━━━━
// 1. INPUTS
//━━━━━━━━━━━━━━━━━━━
// TP / SL
tp1Pips = input.int(10, "TP1 (pips)", minval = 1)
fixedSLpips = input.int(50, "Fixed SL (pips)", minval = 5)
runnerRR = input.float(3.0, "Runner RR (TP2 = SL * RR)", step = 0.1, minval = 1.0)
// Daily risk
maxDailyLossPct = input.float(5.0, "Max daily loss % (stop trading)", step = 0.5)
maxDailyProfitPct = input.float(20.0, "Max daily profit % (stop trading)", step = 1.0)
// HTF S/R (1H)
htfTF = input.string("60", "HTF timeframe (minutes) for S/R block")
// Profit strategy (Option C)
profitStrategy = input.string("Minimal Risk | Full BE after TP1", "Profit Strategy", options = )
// Runner stop mode (your option 4)
runnerStopMode = input.string( "BE only", "Runner Stop Mode", options = )
// ATR trail settings (only used if ATR mode selected)
atrTrailLen = input.int(14, "ATR Length (trail)", minval = 1)
atrTrailMult = input.float(1.0, "ATR Multiplier (trail)", step = 0.1, minval = 0.1)
// Pip size (for XAUUSD: 1 pip = 0.10 if tick = 0.01)
pipSize = syminfo.mintick * 10.0
tp1Points = tp1Pips * pipSize
slPoints = fixedSLpips * pipSize
baseQty = input.float (1.0, "Base order size" , step = 0.01, minval = 0.01)
//━━━━━━━━━━━━━━━━━━━
// 2. DAILY RISK MANAGEMENT
//━━━━━━━━━━━━━━━━━━━
isNewDay = ta.change(time("D")) != 0
var float dayStartEquity = na
var bool dailyStopped = false
equityNow = strategy.initial_capital + strategy.netprofit
if isNewDay or na(dayStartEquity)
dayStartEquity := equityNow
dailyStopped := false
dailyPnL = equityNow - dayStartEquity
dailyPnLPct = dayStartEquity != 0 ? (dailyPnL / dayStartEquity) * 100.0 : 0.0
if not dailyStopped
if dailyPnLPct <= -maxDailyLossPct
dailyStopped := true
if dailyPnLPct >= maxDailyProfitPct
dailyStopped := true
canTradeToday = not dailyStopped
//━━━━━━━━━━━━━━━━━━━
// 3. 1H S/R ZONES (for direction block)
//━━━━━━━━━━━━━━━━━━━
htOpen = request.security(syminfo.tickerid, htfTF, open)
htHigh = request.security(syminfo.tickerid, htfTF, high)
htLow = request.security(syminfo.tickerid, htfTF, low)
htClose = request.security(syminfo.tickerid, htfTF, close)
// Engulf logic on HTF
htBullPrev = htClose > htOpen
htBearPrev = htClose < htOpen
htBearEngulf = htClose < htOpen and htBullPrev and htOpen >= htClose and htClose <= htOpen
htBullEngulf = htClose > htOpen and htBearPrev and htOpen <= htClose and htClose >= htOpen
// Liquidity sweep on HTF previous candle
htSweepHigh = htHigh > ta.highest(htHigh, 5)
htSweepLow = htLow < ta.lowest(htLow, 5)
// Store last HTF zones
var float htResHigh = na
var float htResLow = na
var float htSupHigh = na
var float htSupLow = na
if htBearEngulf and htSweepHigh
htResHigh := htHigh
htResLow := htLow
if htBullEngulf and htSweepLow
htSupHigh := htHigh
htSupLow := htLow
// Are we inside HTF zones?
inHtfRes = not na(htResHigh) and close <= htResHigh and close >= htResLow
inHtfSup = not na(htSupLow) and close >= htSupLow and close <= htSupHigh
// Block direction against HTF zones
longBlockedByZone = inHtfRes // no buys in HTF resistance
shortBlockedByZone = inHtfSup // no sells in HTF support
//━━━━━━━━━━━━━━━━━━━
// 4. 1m LOCAL ZONES (LIQUIDITY SWEEP + ENGULF + QUALITY SCORE)
//━━━━━━━━━━━━━━━━━━━
// 1m engulf patterns
bullPrev1 = close > open
bearPrev1 = close < open
bearEngulfNow = close < open and bullPrev1 and open >= close and close <= open
bullEngulfNow = close > open and bearPrev1 and open <= close and close >= open
// Liquidity sweep by previous candle on 1m
sweepHighPrev = high > ta.highest(high, 5)
sweepLowPrev = low < ta.lowest(low, 5)
// Local zone storage (one active support + one active resistance)
// Quality score: 1 = engulf only, 2 = engulf + sweep (we only trade ≥2)
var float supLow = na
var float supHigh = na
var int supQ = 0
var bool supUsed = false
var float resLow = na
var float resHigh = na
var int resQ = 0
var bool resUsed = false
// New resistance zone: previous bullish candle -> bear engulf
if bearEngulfNow
resLow := low
resHigh := high
resQ := sweepHighPrev ? 2 : 1
resUsed := false
// New support zone: previous bearish candle -> bull engulf
if bullEngulfNow
supLow := low
supHigh := high
supQ := sweepLowPrev ? 2 : 1
supUsed := false
// Raw "inside zone" detection
inSupRaw = not na(supLow) and close >= supLow and close <= supHigh
inResRaw = not na(resHigh) and close <= resHigh and close >= resLow
// QUALITY FILTER: only trade zones with quality ≥ 2 (engulf + sweep)
highQualitySup = supQ >= 2
highQualityRes = resQ >= 2
inSupZone = inSupRaw and highQualitySup and not supUsed
inResZone = inResRaw and highQualityRes and not resUsed
// Plot zones
plot(supLow, "Sup Low", color = color.new(color.lime, 60), style = plot.style_linebr)
plot(supHigh, "Sup High", color = color.new(color.lime, 60), style = plot.style_linebr)
plot(resLow, "Res Low", color = color.new(color.red, 60), style = plot.style_linebr)
plot(resHigh, "Res High", color = color.new(color.red, 60), style = plot.style_linebr)
//━━━━━━━━━━━━━━━━━━━
// 5. MODERATE BOS (3-BAR FRACTAL STRUCTURE)
//━━━━━━━━━━━━━━━━━━━
// 3-bar swing highs/lows
swHigh = high > high and high > high
swLow = low < low and low < low
var float lastSwingHigh = na
var float lastSwingLow = na
if swHigh
lastSwingHigh := high
if swLow
lastSwingLow := low
// BOS conditions
bosUp = not na(lastSwingHigh) and close > lastSwingHigh
bosDown = not na(lastSwingLow) and close < lastSwingLow
// Zone “arming” and BOS validation
var bool supArmed = false
var bool resArmed = false
var bool supBosOK = false
var bool resBosOK = false
// Arm zones when first touched
if inSupZone
supArmed := true
if inResZone
resArmed := true
// BOS after arming → zone becomes valid for entries
if supArmed and bosUp
supBosOK := true
if resArmed and bosDown
resBosOK := true
// Reset BOS flags when new zones are created
if bullEngulfNow
supArmed := false
supBosOK := false
if bearEngulfNow
resArmed := false
resBosOK := false
//━━━━━━━━━━━━━━━━━━━
// 6. ENTRY CONDITIONS (ZONE + BOS + RISK STATE)
//━━━━━━━━━━━━━━━━━━━
flatOrShort = strategy.position_size <= 0
flatOrLong = strategy.position_size >= 0
longSignal = canTradeToday and not longBlockedByZone and inSupZone and supBosOK and flatOrShort
shortSignal = canTradeToday and not shortBlockedByZone and inResZone and resBosOK and flatOrLong
//━━━━━━━━━━━━━━━━━━━
// 7. ORDER LOGIC – TWO PROFIT STRATEGIES
//━━━━━━━━━━━━━━━━━━━
// Common metrics
atrTrail = ta.atr(atrTrailLen)
// MINIMAL MODE: single trade, BE after TP1, optional trailing
// HYBRID MODE: two trades (Scalp @ TP1, Runner @ TP2)
// Persistent tracking
var float longEntry = na
var float longTP1 = na
var float longTP2 = na
var float longSL = na
var bool longBE = false
var float longRunEntry = na
var float longRunTP1 = na
var float longRunTP2 = na
var float longRunSL = na
var bool longRunBE = false
var float shortEntry = na
var float shortTP1 = na
var float shortTP2 = na
var float shortSL = na
var bool shortBE = false
var float shortRunEntry = na
var float shortRunTP1 = na
var float shortRunTP2 = na
var float shortRunSL = na
var bool shortRunBE = false
isMinimal = profitStrategy == "Minimal Risk | Full BE after TP1"
isHybrid = profitStrategy == "Hybrid | Scalp TP + Runner TP"
//━━━━━━━━━━ LONG ENTRIES ━━━━━━━━━━
if longSignal
if isMinimal
longEntry := close
longSL := longEntry - slPoints
longTP1 := longEntry + tp1Points
longTP2 := longEntry + slPoints * runnerRR
longBE := false
strategy.entry("Long", strategy.long)
supUsed := true
supArmed := false
supBosOK := false
else if isHybrid
longRunEntry := close
longRunSL := longRunEntry - slPoints
longRunTP1 := longRunEntry + tp1Points
longRunTP2 := longRunEntry + slPoints * runnerRR
longRunBE := false
// Two separate entries, each 50% of baseQty (for backtest)
strategy.entry("LongScalp", strategy.long, qty = baseQty * 0.5)
strategy.entry("LongRun", strategy.long, qty = baseQty * 0.5)
supUsed := true
supArmed := false
supBosOK := false
//━━━━━━━━━━ SHORT ENTRIES ━━━━━━━━━━
if shortSignal
if isMinimal
shortEntry := close
shortSL := shortEntry + slPoints
shortTP1 := shortEntry - tp1Points
shortTP2 := shortEntry - slPoints * runnerRR
shortBE := false
strategy.entry("Short", strategy.short)
resUsed := true
resArmed := false
resBosOK := false
else if isHybrid
shortRunEntry := close
shortRunSL := shortRunEntry + slPoints
shortRunTP1 := shortRunEntry - tp1Points
shortRunTP2 := shortRunEntry - slPoints * runnerRR
shortRunBE := false
strategy.entry("ShortScalp", strategy.short, qty = baseQty * 50)
strategy.entry("ShortRun", strategy.short, qty = baseQty * 50)
resUsed := true
resArmed := false
resBosOK := false
//━━━━━━━━━━━━━━━━━━━
// 8. EXIT LOGIC – MINIMAL MODE
//━━━━━━━━━━━━━━━━━━━
// LONG – Minimal Risk: 1 trade, BE after TP1, runner to TP2
if isMinimal and strategy.position_size > 0 and not na(longEntry)
// Move to BE once TP1 is touched
if not longBE and high >= longTP1
longBE := true
// Base SL: BE or initial SL
float dynLongSL = longBE ? longEntry : longSL
// Optional trailing after BE
if longBE
if runnerStopMode == "Structure trail" and not na(lastSwingLow) and lastSwingLow > longEntry
dynLongSL := math.max(dynLongSL, lastSwingLow)
if runnerStopMode == "ATR trail"
trailSL = close - atrTrailMult * atrTrail
dynLongSL := math.max(dynLongSL, trailSL)
strategy.exit("Long Exit", "Long", stop = dynLongSL, limit = longTP2)
// SHORT – Minimal Risk: 1 trade, BE after TP1, runner to TP2
if isMinimal and strategy.position_size < 0 and not na(shortEntry)
if not shortBE and low <= shortTP1
shortBE := true
float dynShortSL = shortBE ? shortEntry : shortSL
if shortBE
if runnerStopMode == "Structure trail" and not na(lastSwingHigh) and lastSwingHigh < shortEntry
dynShortSL := math.min(dynShortSL, lastSwingHigh)
if runnerStopMode == "ATR trail"
trailSLs = close + atrTrailMult * atrTrail
dynShortSL := math.min(dynShortSL, trailSLs)
strategy.exit("Short Exit", "Short", stop = dynShortSL, limit = shortTP2)
//━━━━━━━━━━━━━━━━━━━
// 9. EXIT LOGIC – HYBRID MODE
//━━━━━━━━━━━━━━━━━━━
// LONG – Hybrid: Scalp + Runner
if isHybrid
// Scalp leg: full TP at TP1
if strategy.opentrades > 0
strategy.exit("LScalp TP", "LongScalp", stop = longRunSL, limit = longRunTP1)
// Runner leg
if strategy.position_size > 0 and not na(longRunEntry)
if not longRunBE and high >= longRunTP1
longRunBE := true
float dynLongRunSL = longRunBE ? longRunEntry : longRunSL
if longRunBE
if runnerStopMode == "Structure trail" and not na(lastSwingLow) and lastSwingLow > longRunEntry
dynLongRunSL := math.max(dynLongRunSL, lastSwingLow)
if runnerStopMode == "ATR trail"
trailRunSL = close - atrTrailMult * atrTrail
dynLongRunSL := math.max(dynLongRunSL, trailRunSL)
strategy.exit("LRun TP", "LongRun", stop = dynLongRunSL, limit = longRunTP2)
// SHORT – Hybrid: Scalp + Runner
if isHybrid
if strategy.opentrades > 0
strategy.exit("SScalp TP", "ShortScalp", stop = shortRunSL, limit = shortRunTP1)
if strategy.position_size < 0 and not na(shortRunEntry)
if not shortRunBE and low <= shortRunTP1
shortRunBE := true
float dynShortRunSL = shortRunBE ? shortRunEntry : shortRunSL
if shortRunBE
if runnerStopMode == "Structure trail" and not na(lastSwingHigh) and lastSwingHigh < shortRunEntry
dynShortRunSL := math.min(dynShortRunSL, lastSwingHigh)
if runnerStopMode == "ATR trail"
trailRunSLs = close + atrTrailMult * atrTrail
dynShortRunSL := math.min(dynShortRunSL, trailRunSLs)
strategy.exit("SRun TP", "ShortRun", stop = dynShortRunSL, limit = shortRunTP2)
//━━━━━━━━━━━━━━━━━━━
// 10. RESET STATE WHEN FLAT
//━━━━━━━━━━━━━━━━━━━
if strategy.position_size == 0
longEntry := na
shortEntry := na
longBE := false
shortBE := false
longRunEntry := na
shortRunEntry := na
longRunBE := false
shortRunBE := false
//━━━━━━━━━━━━━━━━━━━
// 11. VISUAL ENTRY MARKERS
//━━━━━━━━━━━━━━━━━━━
plotshape(longSignal, title = "Long Signal", style = shape.triangleup,
location = location.belowbar, color = color.lime, size = size.tiny, text = "L")
plotshape(shortSignal, title = "Short Signal", style = shape.triangledown,
location = location.abovebar, color = color.red, size = size.tiny, text = "S")

🔥 Ribas Waves Strategy PRO++📝 Strategy Description: Ribas Waves Strategy PRO++
The Ribas Waves Strategy PRO++ is a powerful trading system based on the identification of Wolfe Waves patterns, designed to capture high-probability reversal points with precise entries and smart risk management.
This advanced version is fully customizable, allowing traders to adapt entry confirmations, trend filters, and risk/reward ratios to their preferred trading style and market conditions.
⚙️ Key Features:
✅ Automatic detection of both Bullish and Bearish Wolfe Wave patterns
✅ Entry confirmation options:
No confirmation (pure Wolfe pattern)
Directional candle (bullish or bearish close)
Engulfing candle (bullish/bearish)
Inside bar + breakout
✅ Optional EMA trend filter
✅ Configurable take profit via:
Risk multiple (R-multiple: e.g., 3x risk)
Percentage of risk (e.g., 300% of stop-loss distance)
✅ Toggle to show or hide wave labels and structure on chart
✅ Entry cooldown to prevent overlapping trades
✅ Visual display of current strategy position: 📈 Long / 📉 Short / ⛔️ Flat
📌 How to Use:
Set pivot sensitivity based on the asset's volatility (default: 7)
Choose your preferred entry confirmation method
Enable or disable the EMA trend filter
Adjust your take profit logic (R-multiple or % of risk)
Run a backtest or use live alerts for execution
💡 Author Recommendations:
Best suited for volatile markets such as crypto, indices, and forex.
For more trades, disable confirmation filters or use “Directional Candle” mode.
Use higher timeframes or combine with volume/context filters for increased accuracy.
Regularly backtest different settings to optimize your edge on specific assets.

BTC Dynamic Volatility Trend Backtested from 2017 to present, this strategy has delivered a staggering 7100%+ cumulative return. It doesn't just track the market; it dominates it. By capturing major trends and strictly limiting drawdowns, it has significantly outperformed the standard 'Buy & Hold' BTC strategy, proving its ability to generate massive alpha across multiple bull and bear cycles.
自 2017 年至今,本策略实现了惊人的 7100%+ 累计收益率。它不仅仅是跟随市场,更是超越了市场。通过精准捕捉主升浪并严格控制回撤,该策略在穿越多轮牛熊周期后,大幅度跑赢了比特币‘买入持有’(Buy & Hold)的基准收益,展现了极致的阿尔法(Alpha)捕捉能力。"
Introduction :Simplicity is the ultimate sophistication. This strategy is designed specifically for Bitcoin (BTC), capturing its unique characteristics: high volatility, frequent fakeouts, and massive trend persistence. It abandons complex indicators in favor of a robust logic: "Follow the Trend, Filter the Noise, Let Profits Run."
Core Logic
Trend Filter (Fibonacci EMA 144): We use the 144-period Exponential Moving Average as the baseline. Longs are only taken above this line, and shorts only below. This keeps you on the right side of the major trend.
Volatility Breakout (Donchian Channel 20): Entries are triggered only when price breaks the 20-day high (for longs) or low (for shorts). This confirms momentum and avoids trading in chop.
Dynamic Risk Management (ATR Chandelier Exit):
Instead of fixed % stops, we use Average True Range (ATR) to calculate stop losses.
The Ratchet Mechanism: The stop loss moves up with the price but never moves down (for longs). This locks in profits automatically as the trend develops and exits immediately when volatility turns against you.
Why Use This Strategy?
Zero Repainting: All signals are confirmed.
No Curve Fitting: Uses classic parameters (144, 20) that have worked for decades.
Mental Peace: The strategy handles the exit. You don't need to guess where to sell. It holds through minor corrections and exits only when the trend truly reverses.
Settings
Leverage %: Adjust your position size based on equity (default 100% = 1x).
Timeframe: Recommended for 4H charts.
中文版 (Chinese Version)
简介 :大道至简。本策略专为 比特币 (BTC) 设计,针对其高波动、假突破多但趋势爆发力强的特点,摒弃了复杂的过度拟合指标,回归交易本质:“顺大势,滤噪音,截断亏损,让利润奔跑”。
核心逻辑
趋势过滤器 (斐波那契 EMA 144): 使用 144 周期指数移动平均线作为多空分水岭。价格在均线之上只做多,之下只做空。这能有效过滤掉大部分震荡市的噪音。
波动率突破 (唐奇安通道 20): 只有当价格突破过去 20 根 K 线的最高价(做多)或最低价(做空)时才进场。这确保了我们只在趋势确立的瞬间入场。
动态风控 (ATR 吊灯止损):
拒绝固定点数止损,使用 ATR(平均真实波幅)根据市场热度动态计算安全距离。
棘轮机制: 止损线会跟随价格上涨而上移,但绝不会下移(做多时)。这实现了自动化的“利润锁定”,既能扛住正常的波动回调,又能在大势反转时果断离场。
策略优势
绝不重绘: 所有信号均为收盘确认或实时触价。
拒绝拟合: 使用经过数十年市场验证的经典参数组合。
心态管理: 策略全自动管理出场。你不需要纠结何时止盈,它会帮你吃到完整的鱼身,直到趋势结束。
使用建议
资金管理: 可通过参数调整仓位占比(默认 100% = 1倍杠杆)。
推荐周期: 建议在4小时 图表上运行效果最佳。
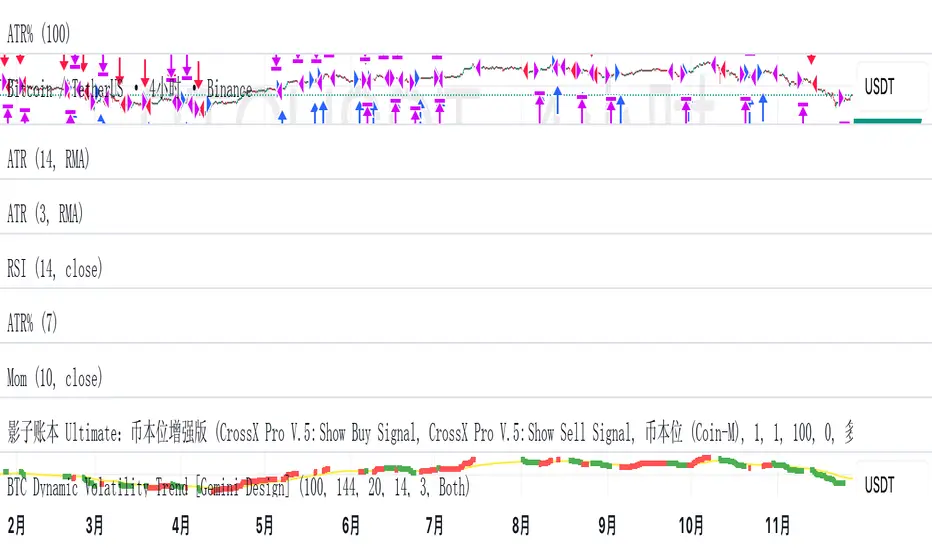
The Truth Sniper: Breathing Edition**Overview**
This is a highly advanced trend-following strategy designed to filter out market noise ("Fakeouts") and manage risk using a dynamic "Breathing Ratchet" mechanism. It combines traditional trend analysis with institutional money flow logic to identify the true market direction.
**Key Features**
**1. The Conflict Zone (Gray Zone Filter)**
Most strategies fail during low-volume accumulation or distribution phases. This algorithm introduces a "Conflict Zone" logic:
* **True Rally (Green):** Price is above EMA50 AND Money Flow (VFI) is positive.
* **True Drop (Red):** Price is below EMA50 AND Money Flow (VFI) is negative.
* **Conflict (Gray Background):** When Price and Money Flow disagree (e.g., Price rising on negative volume), the background turns Gray. **Trading is disabled** in these zones to avoid bull/bear traps.
**2. Breathing Stop-Loss Mechanism (Volatility Adjusted)**
The Stop Loss isn't static. It "breathes" based on market heat (Volume/RSI):
* **High Heat (High Volatility):** The SL loosens its grip, moving towards the bottom of the Fibonacci zone to allow price fluctuation without premature exits.
* **Low Heat (Low Volatility):** The SL tightens aggressively towards the price to lock in profits during slow momentum.
**3. The Ratchet Lock (Slippage Prevention)**
To ensure maximum profit retention, the "Breathing" mechanism is governed by a **Ratchet Logic**:
* **For Longs:** The Stop Loss can ONLY move UP. If the "Breathing" calculation suggests lowering the stop (due to increased volatility), the Ratchet blocks it, keeping the SL at the highest historical level.
* **For Shorts:** The Stop Loss can ONLY move DOWN.
**4. Fibonacci Exit Zones**
Exits are calculated based on a 60-day dynamic High/Low lookback, creating "Zones" (0-23.6%, 23.6-38.2%, etc.) that the price must conquer. The SL trails these zones mechanically.
**Visual Guide**
* **Lime/Red Background:** Active Trade Zone (Confirmed Trend).
* **Gray Background:** Conflict Zone (Stay Out / Hold).
* **Purple 'X':** The exact price level where the Stop Loss was hit (Fixed marker).
* **Stepline:** The active Stop Loss level (Visible only during open trades).
**Disclaimer**
This script is for educational and research purposes only. Always manage your risk.

Trend Signal MomentumOVERVIEW
Signal Trend Momentum is a hybrid strategy that combines multiple confirmations and filters to obtain better potential trading signals. Each confirmation and filter in Signal Trend Momentum aims to avoid possible false and trap signals.
HYBRID CONCEPTS
Smart Money Concept – This indicator forms market structure and Bullish & Bearish Order Block areas to make it easier to identify market trends and strong areas where price reversals often occur. Its purpose is to simplify recognizing market direction and serve as the first confirmation.
MSS + BOS (Market Structure Shift + Break of Structure) – This indicator serves as additional confirmation for the Smart Money Concept. With the presence of two types of market structure, the market trend direction becomes clearer and more convincing.
RSI Momentum Signal – This indicator becomes the third confirmation. When the Market Trend is clear and convincing, supported by the formation of Bearish and Bullish Order Blocks, the role of the Momentum Signal here becomes crucial as it provides trend momentum based on overbought and oversold areas.
Momentum Position – This indicator becomes the next confirmation based on buyer and seller VOLUME in the market. If buyer volume is higher, the momentum position will be depicted on the chart with an upward arrow, and conversely, if seller volume is higher, it will be depicted with a downward arrow.
SnR (Support and Resistance) – This final indicator is Support and Resistance, which will serve as the last and more convincing confirmation. Support and Resistance will strengthen the Order Block areas formed by the Smart Money Concept indicator. A Bullish Order Block + Support creates a higher possibility for an upward trend in the market, conversely, a Bearish Order Block + Resistance creates a higher possibility for a downward trend in the market.
The combination of these several indicators will provide a strong market direction + persistent buyer and seller areas, as well as depict momentum based on volume + RSI which serve as additional confirmations.
These additional confirmations will produce stronger signals and help avoid false and trap signals in the market.
HOW TO USE
A SHORT SIGNAL will be strong if there is a Downtrend Market Structure + Bearish Order Block + Resistance + Oversold RSI Momentum + Strong Seller Volume Momentum.
A LONG SIGNAL will be strong if there is an Uptrend Market Structure + Bullish Order Block + Support + Overbought RSI Momentum + Strong Buyer Volume Momentum.
CONCLUSION
Signal Trend Momentum is a combination of several powerful indicators designed to produce stronger, clearer, and easier-to-read signals.
This strategy is highly suitable for traders seeking more convincing trade signals based on multiple confirmations from the combined indicators, thereby creating a strong signal with a higher probability.

JYL Trend Pro V1.0 BETAJYL Trend Pro V1.0 is a rule‑based trend‑following strategy built on a proprietary smoothed price engine.
It focuses on clear trend states and position management rather than classic indicators, and can be used on both long and short side depending on the user’s settings.
Three Signal Modes
1. Stable Mode
Stable mode is the “classic” version of the system.
It reacts only when the trend state clearly flips, and then manages the position with simple rules:
First strong bullish state → open / add to long
First strong bearish state → open / add to short
When the trend weakens but does not fully reverse, the strategy can reduce position size (partial exit)
When the trend flips in the opposite direction, the strategy fully exits the existing position
This mode is designed for traders who prefer fewer signals and smoother equity curves.
2. Impulsive Mode
Impulsive mode keeps the same core logic, but allows the strategy to react earlier and manage exits more actively:
Opportunistic early entries around strong moves
Protective “early stop” logic for those aggressive entries
Segment‑based partial exits after extended bullish or bearish runs
Fast full exits when momentum fades quickly or the trend flips
This mode is aimed at users who accept more trade frequency in exchange for faster reactions.
3. IMP+ Mode (Impulsive Plus)
IMP+ is the advanced version of Impulsive mode. It keeps all core behavior and adds extra controls for power‑users:
Adjustable presets for how early the system can enter a move
Adjustable presets for how quickly early entries are cut if they fail
Smarter add‑ons after a bullish / bearish segment, so adds can occur either at the next strong signal or on a “pullback‑type” bar inside the ongoing trend
Flexible multi‑level partial‑exit packages after a strong run
Additional “emergency exit” logic that can flatten positions when price opens too close to the previous bar after a strong trend segment
All of these options are exposed as presets in the Inputs tab, so users can experiment without touching code.
Signals & Usage
The strategy prints clear labels on the chart:
LONG / SHORT – open or add to position
REDUCE SIZE – partial profit‑taking or risk reduction
SELL LONG / SHORT COVER – full exit of long / short positions
A trade‑direction filter lets you run the system as long‑only, short‑only, or long & short.
This script is provided for educational and research purposes only.
It is not financial advice and does not guarantee any future performance. Always test on a demo account, adjust risk to your own situation, and consult your broker or advisor before trading live.
Internally, this strategy is based on the private JYL Trend Pro rule set and risk‑management framework.
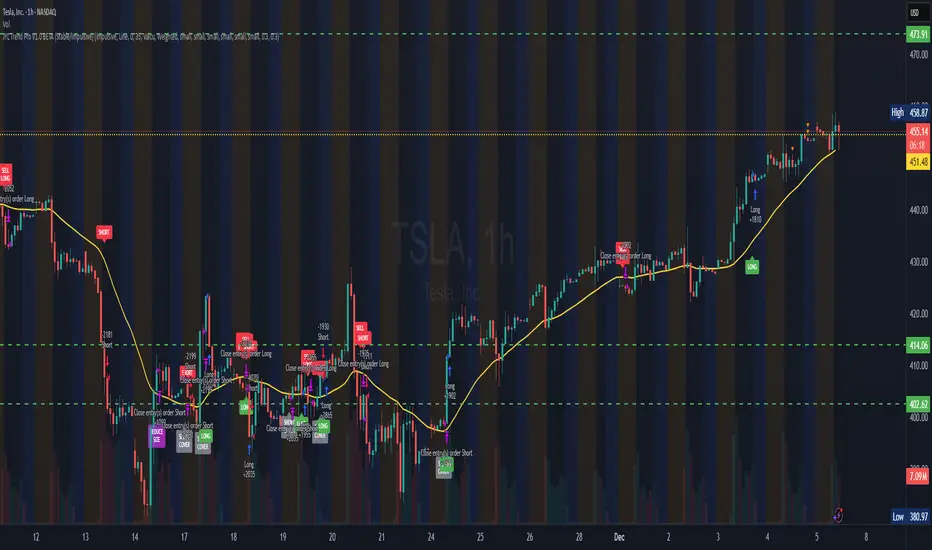
JYL Trend Pro V1.0 BETANASDAQ:TSLA
JYL Trend Pro V1.0 is a rule‑based trend‑following strategy built on a proprietary smoothed price engine.
It focuses on clear trend states and position management rather than classic indicators, and can be used on both long and short side depending on the user’s settings.
Three Signal Modes
1. Stable Mode
Stable mode is the “classic” version of the system.
It reacts only when the trend state clearly flips, and then manages the position with simple rules:
First strong bullish state → open / add to long
First strong bearish state → open / add to short
When the trend weakens but does not fully reverse, the strategy can reduce position size (partial exit)
When the trend flips in the opposite direction, the strategy fully exits the existing position
This mode is designed for traders who prefer fewer signals and smoother equity curves.
2. Impulsive Mode
Impulsive mode keeps the same core logic, but allows the strategy to react earlier and manage exits more actively:
Opportunistic early entries around strong moves
Protective “early stop” logic for those aggressive entries
Segment‑based partial exits after extended bullish or bearish runs
Fast full exits when momentum fades quickly or the trend flips
This mode is aimed at users who accept more trade frequency in exchange for faster reactions.
3. IMP+ Mode (Impulsive Plus)
IMP+ is the advanced version of Impulsive mode. It keeps all core behavior and adds extra controls for power‑users:
Adjustable presets for how early the system can enter a move
Adjustable presets for how quickly early entries are cut if they fail
Smarter add‑ons after a bullish / bearish segment, so adds can occur either at the next strong signal or on a “pullback‑type” bar inside the ongoing trend
Flexible multi‑level partial‑exit packages after a strong run
Additional “emergency exit” logic that can flatten positions when price opens too close to the previous bar after a strong trend segment
All of these options are exposed as presets in the Inputs tab, so users can experiment without touching code.
Signals & Usage
The strategy prints clear labels on the chart:
LONG / SHORT – open or add to position
REDUCE SIZE – partial profit‑taking or risk reduction
SELL LONG / SHORT COVER – full exit of long / short positions
A trade‑direction filter lets you run the system as long‑only, short‑only, or long & short.
This script is provided for educational and research purposes only.
It is not financial advice and does not guarantee any future performance. Always test on a demo account, adjust risk to your own situation, and consult your broker or advisor before trading live.
Internally, this strategy is based on the private JYL Trend Pro rule set and risk‑management framework.
