WaveTrend with Pump Candle Rejection [Reuter]This is my first script, a strategy I tested on the ADABTC pair, 30m Time Frame.
To made this strat I used the Wave Trend Oscillator from LazyBear and some calculations to measure the confirmation candle and the previous candle.
The idea for this strat is to enter the market on a lower level through the wt1-wt2, catching a possible bounce back. For us to not get so much in trouble, I made a candle meter, so we don`t enter on a pumped candle.
It`s a simple script, you can apply to other pair and markets, but you need to play around with the settings to match the best conditions. Still have to see if I can minimize the bear market buys with other indicator.
If you liked my idea and it helped you give this strat a like!
BTC: 3HDgosPC7s45D2nAC6pUfFuyt5ZS94wrBQ
Nano: xrb_3qr1aa4ey6odbxr1hrrthehg3oif58sgreopbj4i74d7wqs1bmbxmmuaicse
Поиск скриптов по запросу "bear"

CB Signals - Holla-724 BITMEX BTC/USD Long/Short (Paid Algo)This algo uses a number of strategies developed from 7 yrs of trading this concept in the FX markets. I have modified it for Leverage trading on BITMEX exchange.
You may view detail summary of live performance of this Algo dating from Jan 1st 2018 - Nov 9th 2018 (In one of Bitcoin's worst bear markets) below by clicking the "Performance Summary" Tab :
To signup for this algo please visit the link below:
www.cryptoblood.io

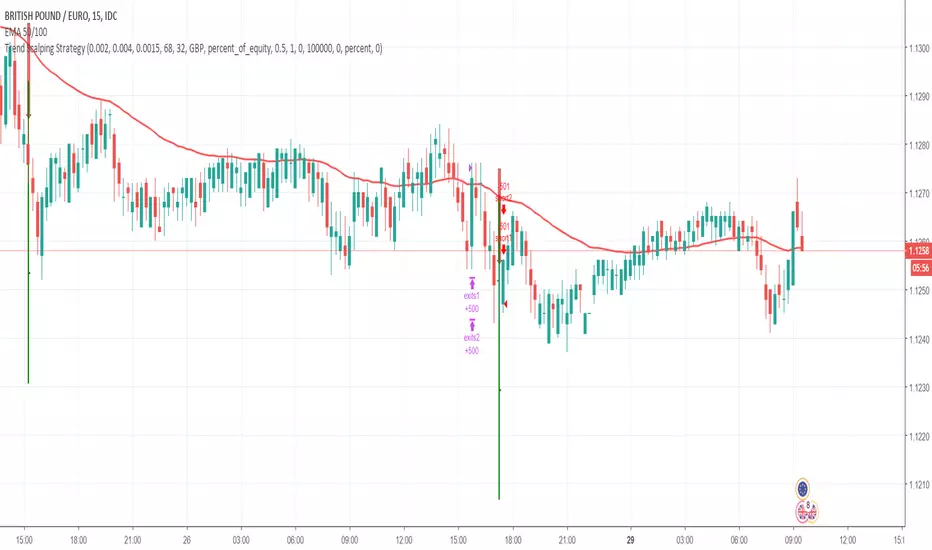
Trend Scalping Strategy - ForexHi all,
I have created the attached strategy for my own use primarily but thought I would share it as my experience to date is that it is profitable in particular circumstances, so thought I would open this out to the community to see if it can be successfully applied on any other pairs and timeframes.
I have protected the source code at this time - mainly because it needs massive tidying up! If I ever get time to do this then I will
The concept of the strategy is based upon the slingshot method - the strategy fundamentally does the following:
- Tests each candle for a new short term trend based upon EMAs
- If there is a new trend, check the RSI and ensure it isnt above the upper RSI threshold (for long positions) and below the lower RSI threshold (for short positions)
- If it passes the RSI check, entry is valid and draws a bar on the chart to show the opening entry position, stop loss position, take profit 1 and take profit 2 positions.
I have backtested this across 28 pairs on the M15 timeframe, comprising of a total of 140,000 candles (35,000 hours of trading). Across this period, 18 of the 28 pairs I looked at were profitable, with overall significant profit if live traded across the 28.
I have live tested 5 pairs on the same timeframe:
- GBPJPY
- GBPUSD
- GBPEUR
- CADJPY
- EURJPY
These pairs have to date given a rough ROR (Return on Risk) position of approx 60% average per trade.
All of the above has been done with the following inputs:
- RSI Upper - 68
- RSI Lower - 32
- Stop Loss - 0.0015
- TP1 - 0.002
- TP2 - 0.004
The SL and TPs are based on a decimal entry of a percentage movement - i.e. the Stop loss above reflects a 0.15% movement, etc etc. Obviously if this were to be tested on longer time frames it is likely that these would need to be larger figures.
I have also tested this live with great success on the S&P 500 and the FTSE, with the following settings:
Indicator Timeframe TP1 TP2 SL Upper Lower
FTSE M5 0.0015 0.004 0.001 70 30
SPX M5 0.0015 0.004 0.001 75 35
Three key notes on trading this below - THESE ARE VERY IMPORTANT!
- This is NOT a high strike rate strategy. Strike rate on profitable pairs is between approx 45 and 55% (although I have seen as low as 35% and still seen significant profit). This has two natural conclusions - risk management is VITAL (I risk 0.5% on each trade, but this may in fact be high for this strategy), and be prepared for potentially significant drawdowns. I have seen certainly drawdowns of 20 consecutive losing trades (counting TP1 and TP2 as 2 trades) and probably longer, which obviously means drawdowns of 10% or greater. The other thing to bear in mind is that with this kind of strike rate, you shouldnt be setting TP1 at a 1:1 risk reward or lower.
- Take Profit 1 is easy - straight Stop and Limit orders. Take Profit 2 is a trailing stop with a start point of the limit for TP1, with then a trailing stop of this distance. This means that should you win on TP1, TP2 is a risk free trade but also trails in for profit if TP2 isnt reached (which it normally isnt). DO NOT set TP2 as a standard stop and limit, this rapidly makes this strategy unprofitable. The point here is that if you reach TP1 you are in some form of trend where you want to capture as much profit as you can.
- Do not enter a trade mid candle. The strategy is based upon the close of the trending candle not the "live" price during this candle, so no need to rush into a trade. If you enter mid candle you will find more often than not that the indicator wasnt for a valid trade by the candle close.
Also, standard disclaimer - past performance is no guarantee of future performance, and if you choose to use this strategy/indicator you do so 100% at your own risk. As a minimum, pick your pairs carefully - I have found particular unprofitability with this strategy with the AUD and NZD pairs so I have ruled these out completely at present, although with different timeframes and inputs these may of course be profitable.
I hope this is helpful for someone...I'd welcome any feedback or other setups where this is profitable.
Moving forward, I want to do some more work on this strategy to rule out some of the more negative trades, and I primarily intend to do this using pivots - however this will be an as and when I get chance.
multi Stochastic strategy (J)www.tradingview.com(STOCH)
The Stochastic Oscillator ( STOCH ) is a range bound momentum oscillator. The Stochastic indicator is designed to display the location of the close compared to the high/low range over a user defined number of periods. Typically, the Stochastic Oscillator is used for three things; Identifying overbought and oversold levels, spotting divergences and also identifying bull and bear set ups or signals.

multi Stoch + MACD + CCI strategy (J)The Stochastic Oscillator (STOCH) is a range bound momentum oscillator. The Stochastic indicator is designed to display the location of the close compared to the high/low range over a user defined number of periods. Typically, the Stochastic Oscillator is used for three things; Identifying overbought and oversold levels, spotting divergences and also identifying bull and bear set ups or signals.
www.tradingview.com(STOCH)
MACD is an extremely popular indicator used in technical analysis. MACD can be used to identify aspects of a security's overall trend. Most notably these aspects are momentum, as well as trend direction and duration. What makes MACD so informative is that it is actually the combination of two different types of indicators. First, MACD employs two Moving Averages of varying lengths (which are lagging indicators) to identify trend direction and duration. Then, MACD takes the difference in values between those two Moving Averages (MACD Line) and an EMA of those Moving Averages (Signal Line) and plots that difference between the two lines as a histogram which oscillates above and below a center Zero Line. The histogram is used as a good indication of a security's momentum.
www.tradingview.com(Moving_Average_Convergence/Divergence)
The Commodity Channel Index (CCI) is a momentum oscillator used in technical analysis primarily to identify overbought and oversold levels by measuring an instrument's variations away from its statistical mean. CCI is a very well-known and widely-used indicator that has gained level of popularity in no small part of its versatility. Besides overbought/oversold levels, CCI is often used to find reversals as well as divergences. Originally, the indicator was designed to be used for identifying trends in commodities, however it is now used in a wide range of financial instruments.
www.tradingview.com(CCI)

Volume Ratio (VR) Strategy (J)Thanks to the following script.
Definition:
Volume ratio can be obtained in a similar way to RSI .
Volume Ratio (%) = 100 - 100/(1+vr)
The parameter "vr" is defined as
vr=(A+U/2)/(D+U/2)
A=Total volume of the periods when the price advance.
D=Total volume of the periods when the price declined.
U=Total volume of the periods when the price unchanged.
After substitution, following expression can be derived and the denominator represents total volume of all periods.
Volume Ratio (%) = 100 x (A+U/2)/(A+D+U)
Notes:
A similar method to interpret RSI can be employed.
1) Overbought level over 70% and oversold level under 30%. These levels need to be adjusted according to the periods, time frames and issues.
2) Bullish picture over 50% line and bearish picture under 50% line.
3) Crossing oversold level to the upside can be taken as a confirmation of bullish reversal. - and vice versa for a bearish reversal.
4) After a long-term bearish market, the increase of volume can happen in the early stage of a bullish market.
5) Buying opportunity can be suggested when the volume ratio is declining and the price is either advancing or leveling off.

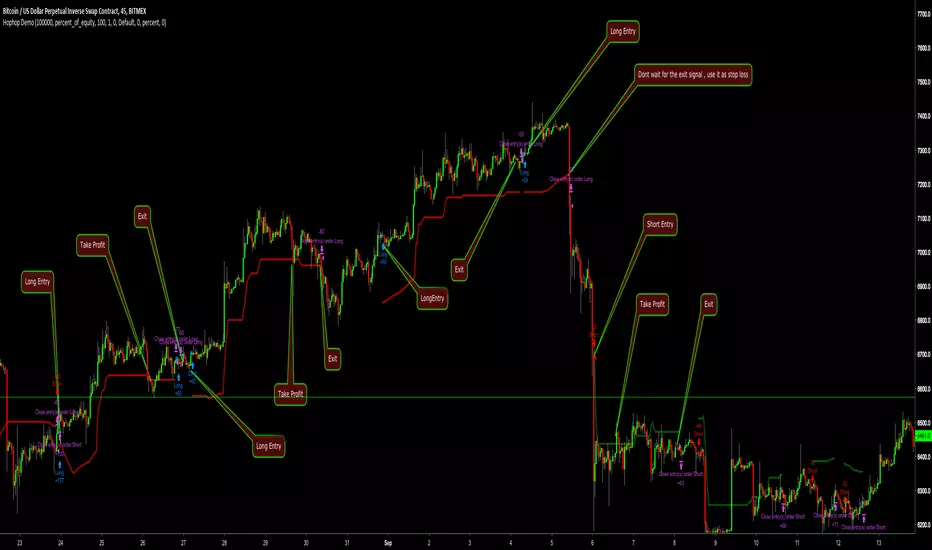
Hophop Strategy DemoThis is the demo of hophop strategy that can only be executed for the pairs and timeframes listed below
"BTCUSD"
"XBTUSD"
"ETHUSD"
"ETHBTC"
"ETHXBT"
"XRPUSD"
"XRPBTC"
"XRPXBT"
"10"
"30"
"45"
"60"
"120"
"240"
I have added dynamic trailing stop loss that can be used as a stop loss when trade is not in profit alternatively you can use it as a take profit points if you don't want to close the trade aggressively
For those who hasnt worked with strategy before
Blue arrow : Long
Red arrow: Short
Purple arrow: Close active trade
if strategy is on a long trade and active trade is in profit, you can use the red line as stop loss or take profit
if strategy is on a long trade and active trade is in loss, you can use the red line as stop loss if active trade hasn't closed already
if strategy is on a short trade and active trade is in profit, you can use the green line as stop loss or take profit
if strategy is on a short trade and active trade is in loss, you can use the green line as stop loss if active trade hasn't closed already
In full version active stop loss/take profit is embedded to strategy and they are configurable according to your risk appetite
Strategy results are for the dates between 01.01.2018 - 01.10.2018 . ( which includes volatile bear market and choppy sideways market )
TAI - Trend Analysis Indicator Low-Transition = Low trend transitioning to a high trend, buy
High-Transition = High trend transitioning to a low trend, sell
Uses some source code form VFI (Creds to Lazy Bear) and a certain sequence of fibonacci numbers and Simple moving Averages.
Basically worked on this the whole summer :) Here's the result.

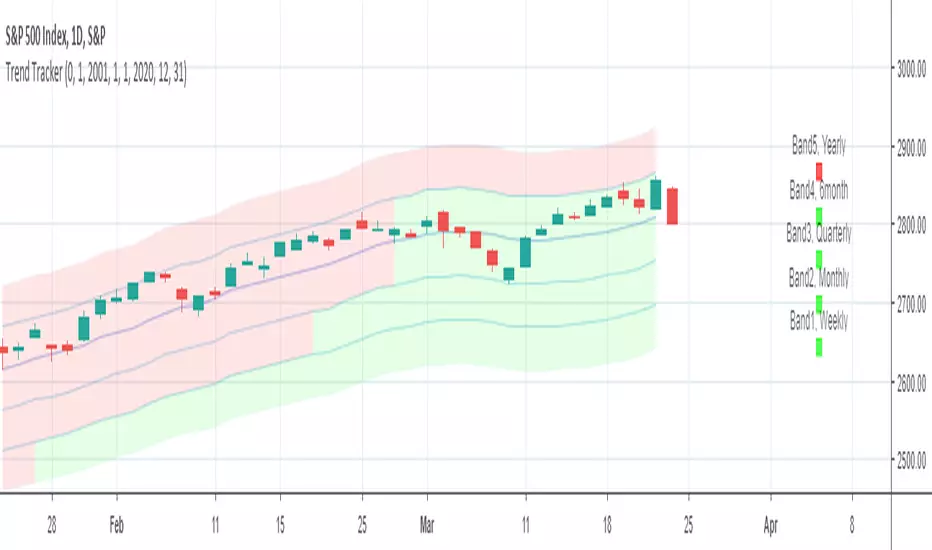
Trend tracker by ClefsphereThis script attempts to identify the trend and go with it. Green colored squares are bullish, Black squares are bearish. Script is written to show back-test results. Dates of back-test period can be adjusted. Strategy is for Long trades only, but closed trades could possibly be considered for Short trades. Coded with latest PineScript version 3.
For more information and to request for use, go to: marketcast.wordpress.com
Thanks for your interest and support!
Disclaimer: This information is not trading advice and is for educational purposes only. Past performance is not a guarantee of future results.
TradeSpot Pro || Accompanying Strategy indicatorTradeSpot Pro
Overview
This script is an accompaniment to the existing TradeSpot Pro || All Purpose Advanced Trading Indicator
This script is for swing trading with longs, primarily on Binance / Kucoin / Coinbase and other crypto exchanes but is not limited to those markets. The details of what logic is behind the script can be found on the indicator version linked above.
Bags? This script has been tweaked and modified to completely destroy bear markets despite being focused on longs, see the BTCUSD image or PM me for any chart of your liking. I dislike indicators that show an amazing looking run in a bull market but in bear markets they fall apart - well with TradeSpot Pro that is not the case, it is completely market agnostic
Access
For details of access please join the TradeSpot community server where we can sort you out: discord.gg
Alternatively PM me if you would like to directly purchase the strategy and paired indicator.

08-18 EMA Watson [BACKTEST][STRATEGY] BTC/USDTHello, it has been a while since I published something, I have been working on webdev in the last months but Here I Am again with a brand new strategy, I called it EMA Watson lol (no I'm not a fan)!
Recently Bitcoin has been outperforming almost all altcoins so I made a script for trading Bitcoin against USDT. This script should be used on a pair that is in an uptrend, just like BTC/USDT today. The script is coded in such a way that it won't make any trade if the trend goes bearish.
This is a simple buy and sell strategy, that can be used for manual trading or for a trading bot. The strategy is based upon the Exponential Moving Average trading rules, and I added my personnal touch of course.
I give access for free, just leave a comment.
More info about the script, such as inputs description, how to configure the script, strategy explanation, alert configuration can be found here : blockchainfiesta.com
The Alert Setup (indicator) script should be uploaded soon on my profile.
--------------------------------------------------------------------------------------------------------------
Commission Work: TradingView development, Reverse Engineering, Pine Script. contact@blockchainfiesta.com. You can also send me a message in TradingView or Discord
If you have too much crypto and want to help me out:
BTC address: 19sVQvCDmVfEACq7BiMnWSMqFPZ8qfSQ2K
ETH address: 0xc8a5d3a63a05db0c2363ea1c08b37a01cce9ebfb
Smart Money Index (SMI) Backtest Attention:
If you would to use this indicator on the ES, you should have intraday data 60min in your account.
Smart money index (SMI) or smart money flow index is a technical analysis indicator demonstrating investors sentiment.
The index was invented and popularized by money manager Don Hays. The indicator is based on intra-day price patterns.
The main idea is that the majority of traders (emotional, news-driven) overreact at the beginning of the trading day
because of the overnight news and economic data. There is also a lot of buying on market orders and short covering at the opening.
Smart, experienced investors start trading closer to the end of the day having the opportunity to evaluate market performance.
Therefore, the basic strategy is to bet against the morning price trend and bet with the evening price trend. The SMI may be calculated
for many markets and market indices (S&P 500, DJIA, etc.)
The SMI sends no clear signal whether the market is bullish or bearish. There are also no fixed absolute or relative readings signaling
about the trend. Traders need to look at the SMI dynamics relative to that of the market. If, for example, SMI rises sharply when the
market falls, this fact would mean that smart money is buying, and the market is to revert to an uptrend soon. The opposite situation
is also true. A rapidly falling SMI during a bullish market means that smart money is selling and that market is to revert to a downtrend
soon. The SMI is, therefore, a trend-based indicator.
Some analysts use the smart money index to claim that precious metals such as gold will continually maintain value in the future.
You can change long to short in the Input Settings
WARNING:
- For purpose educate only
- This script to change bars colors.

CTC BTFD V3In cryptocurrency trading, It is normal that the price will retrace more than 70% in bear market. The bear market, the coin will be accumulated for the next bull market to come. To benefit in this situation, we need to buy low. The price must be low enough before we can enter the market.
This CTC BTFD Grid system is designed to proof the concept. It works exceptionally well on nearly all crypto. The ruls is simple. buy the fucking dip. Wait for 50% retracement or more before enter the market.

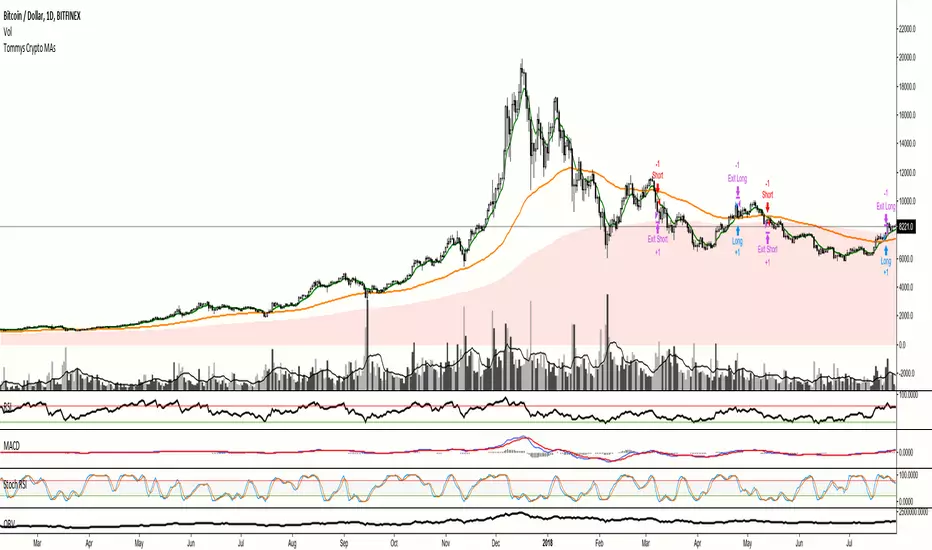
Tommys MA Strategy for CryptoA simple MA-based crossover strategy for crypto. The same as my script for stocks except with different default values. Please note that you have to play around with settings for each asset you wish to use this on to find optimal settings. And optimal settings for a bear market can differ greatly from optimal settings for a bull market, so keep that in mind.
BKT Atlas 002Control date and testing period with inputs
Control bet / equity level with properties
Trades on red histogram
All weather, great in bull markets, solid in bear markets

NGRN MACD-X & RSI v4 STRATEGYMACD-X, RSI & Volume Indicator Strategy - Version 4
Overview
This strategy and it's associated study were modeled after the famous Philakone described algorithms on his now defunct instructional video series.
This indicator allows for full customisation of parameters and interaction between three indicators that allow users to shape their trading methods to their desired goals. This associated strategy also allows users to backtest the study alerts script and find the best settings towards that end.
MACD + RSI + VOLUME - are of the most powerful and widely usded indicators, MACD/Histogram crosses, coupled with RSI & Volume increases/decreases will detects areas of deeply oversold / overbought and buys/sells on the reversal
Features
Full customisation - All parameters are open for customising to allow the trader to build their own strategy and adapt from market to market.
Clean/Simple UI - Facilitating ease of use.
Enable Buying OR Selling, - or have them both active at the same time.
Toggle off and on ALTERNATING Buy and Sell feature (pyramiding) - to allow for consecutive DCA style buys or SCALING out of an entry (partial sell).
Customizable Stop-Loss plot - to enable users to create a STOP-LOSS alert option or other alert(s) based on the plot location.
Toggle Auto Stop-Loss sell option - to enable users choose whether or not to automatically issue a sell signal when close crosses stop loss plot, or choose to toggle off if not profitable.
Customizable Take-Profit plot - to enable users to create a TAKE-PROFIT alert option or other alert(s) based on the plot location.
Study and associated Strategy - to use the TradingView ‘Strategy Tester’ back-testing features to find the best alert settings for specific coins in bear, bull and sideways markets.
Changes Version 4
Improved STOP-LOSS plot draw.
Added the option to automatically sell when stop-loss cross triggered or have the option disabled, in the event a better profit can be achieved.
Added new TAKE-PROFIT plot (aqua line) to visually guide users where to place the TAKE-PROFIT parameter as well as give users options to create alerts based on the TAKE-PROFIT plot.
Access
Full Access is 0.1 ETH , one time fee for LIFETIME access to the STUDY indicator, STRATEGY and future updates as well as support and SETTINGS for various markets on the Binance Exchange.
Settings
SCREENSHOT LINKS:
BUY SETTINGS: prntscr.com
SELL SETTINGS: prntscr.com

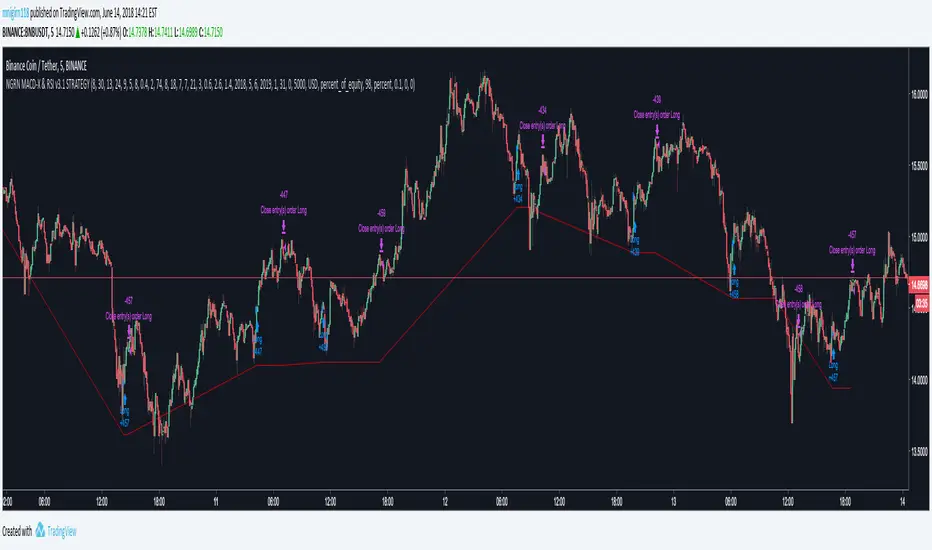
NGRN MACD-X & RSI v3.1 STRATEGYMACD-X, RSI & Volume Indicator Strategy - Version 3.1
Overview
This strategy and it's associated study were modeled after the famous Philakone described algorithms on his now defunct instructional video series.
This indicator allows for full customisation of parameters and interaction between three indicators that allow users to shape their trading methods to their desired goals. This associated strategy also allows users to backtest the study alerts script and find the best settings towards that end.
MACD + RSI + VOLUME - are of the most powerful and widely usded indicators, MACD/Histogram crosses, coupled with RSI & Volume increases/decreases will detects areas of deeply oversold / overbought and buys/sells on the reversal
Features
Full customisation - All parameters are open for customising to allow the trader to build their own strategy and adapt from market to market.
Clean/Simple UI - Facilitating ease of use.
Enable Buying or Selling, - or have them both active at the same time.
Toggle off and on ALTERNATING Buy and Sell feature (pyramiding) - to allow for consecutive dollar cost averaging style buys or SCALING out of an entry (partial sell).
Customizable Stop-Loss plot - to enable users to create a STOP-LOSS alert option or other alert(s) based on the plot location. See settings screenshot.
Study and associated Strategy - to use the TradingView ‘Strategy Tester’ back-testing features to find the best alert settings for specific coins in bear, bull and sideways markets.
Changes Version 3.1
UI consolidates reduntant script inputs making the script easier to use.
Fixes STOP-LOSS algorithm.
Adds a STOP-LOSS Plot (red line) to enable users to create a STOP-LOSS alert option or other alert(s) based on the plot location. See settings screenshot.
Access
Full Access is 0.1 ETH , one time fee for LIFETIME access to the STUDY indicator, STRATEGY and future updates as well as support and SETTINGS for various markets on the Binance Exchange.
Settings
BUY SETTINGS: prntscr.com
SELL SETTINGS: prntscr.com
STOP-LOSS SETTINGS : prntscr.com
EMA Mega Cross StrategyBased on Anvamsi's script which uses 12/26 EMA crosses for entry/exit signals. I also add the following features:
* Optimized default parameters for ETH 4hr chart
* Use EMA 55/200 relationship to filter out signals
* Use RSI vs EMA of RSI to filter out signals
* Use 26/55 EMA relationship to filter out signals
* Use volume climax technique as an additional exit strategy
* Uses bull/bear RSI divs as an additional exit strategy
* Adds bull RSI div quick flip plays when nothing else is going on for extra $$
This very experimental and my first major script. I've kept it invite only because the only people using this should have a direct line of communication open with me at this point.
NOTE #1:
You can get 2018 ETH trade profitability to reach 100% if you change line 97 from:
if (shortEMA and (rsi1 <= ema(rsi1,RSIEMALength)) and shorttrend and (ema(close,26) < ema(close,55)))
to:
if (shortEMA and (rsi1 <= ema(rsi1,RSIEMALength)) and shorttrend)
Basically, you remove an extra filter from the short strategy. It's novel to see profitability hit 100% but if you look at performance from 2017, it increases the max draw down by a lot!
NOTE #2:
I couldn't get RSI bear div quick flips to work so they are disabled. The remaining short strategy is in effect.
NOTE #3:
The profitability is good for long-only, if you check Strategy Tester->Performance Summary.
NOTE #4:
I am not an expert trader (mainly due to psychological factors i think) but i can program and have a good understanding of signal processing from working with analog synthesizers. Use this at your own risk. I am not liable if you lose all of your money!
NOTE #5:
Code is really messy. Old code commented out everywhere. :/

Ichimoku Cloud Strategy for Crypto V2.0Version 2.0
This updated strategy uses additional entry/exit rules based on trend.
This version will only enter short positions if the trend is bearish. While still agressive on bullish signals, it will close long positions earlier if it detects a false bull signal or keep them open should the trend continue to be bullish.
If you prefer a more aggressive strategy check out version 1.0
Do not run this strategy on a timeframe < 1h, best timeframe will be 4h.
Happy Trading!!
If you find this strategy useful, please consider a donation to:
BTC: 1PGuWcQwb4WZyFYX4ehyqcJWcbX42jW7Y6
ETH: 0x912aD30Ff9A49c69D51ECeE5A65A7E7d5321ED0C

Point and Figure Pyramiding StrategyPoint and Figure version of our private pyramiding strategy, with kaiji_
Configurable P&F parameters, reversible bull/bear signals, adjustable stop loss/trailing stops.

Kagi Pyramiding StrategyKagi pyramiding version of our private strategy, with kaiji_
Configurable absolute reversal amounts, stop loss and trailing stop values, reversible bull/bear signal logic.

My Custom indicator & Strategy for trading BTC in 5min UTHello,
If your goal is to make some BTC, this script might be for you.
I tested it on the ETH/BTC Binance chart.
About the indicator :
In short, it will help you for several things :
Avoid losing BTC when the trend goes bearish.
Earn BTC during any bullish trend.
Earn BTC when the market is in trading range by bouncing off trend lines, while anticipating a new potential trend.
I based my algorithm on several technical tools such as volume, RSI, pivot, for a total of 6 boolean conditions mixed together with AND and OR gates, resulting in those entry points (shapes)
About the Strategy :
I only used long entries and exits. No shorting.
The commission rate is set to 0.05% (binance)
The backtesting results in only 40€ of net profit for a 1000€ inital capital, it may seem litle BUT during the testing period (18 days, 40 trades) the coin (ETH) dropped in BTC value ( -25% ). You make 4% while a simple Holder would lose -25%, which is 29% difference.
Since I worked hard on this script, I'll grant access to only those willing to make a small donation, that'd really help me reach my goal of making a living with trading. I will also give you any info you want and give you everything need to set up alerts. Thank you very much.
