Binary Trader Option Buy Premium StrategyThis is a private invite-only indicator designed exclusively for option buyers. It is built to highlight potential high-probability trade opportunities with clear visual signals on the chart. The tool simplifies decision-making by combining multiple conditions into straightforward buy and sell markers, helping traders stay disciplined and focused during live markets.
⚡ Key Highlights:
Clean buy/sell signal plotting directly on the chart.
Works seamlessly on intraday timeframes.
Designed to assist option buyers in identifying potential trade setups.
Simple visual alerts for quick decision-making.
This indicator is strictly invite-only and access is limited to approved users.
Author’s Instructions
This is an invite-only indicator and cannot be accessed without prior approval.
Access is provided exclusively to members of the Binary Trader Option Buying Course.
Unauthorized sharing, resale, or redistribution of this indicator is strictly prohibited.
To request access, please contact the author after course enrollment.
This indicator is for educational and research purposes only and should not be considered financial advice.
Поиск скриптов по запросу "binary"

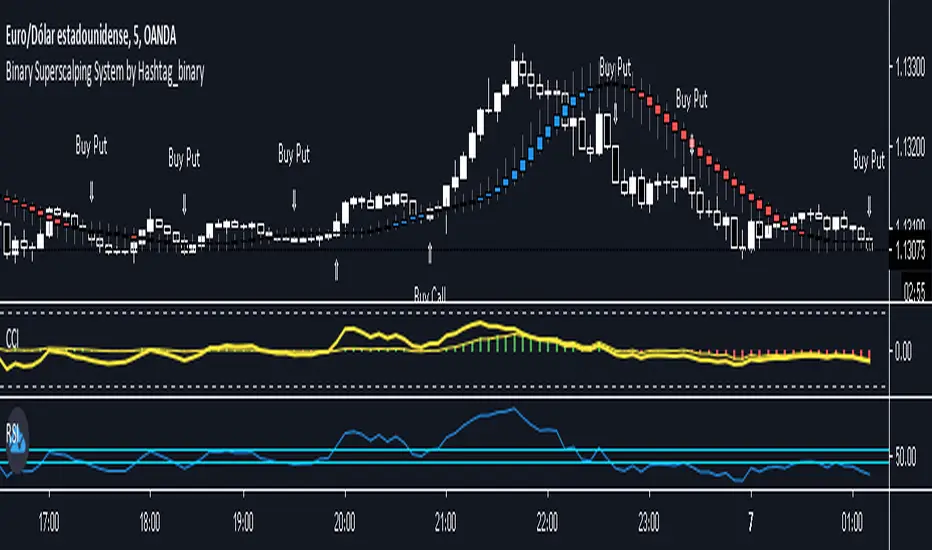
Binary Superscalping System by Hashtag_binaryBinary Superscalping Systyemis a trend momentum strategy designed for scalping and trading with binary options. This trading system is very accurate with the 80% profitable trades.
- Markets: Forex (EUR/USD, GBP/USD, AUD/USD, USD/CHF, USD/CAD, NZF/USD, USD/JPY,) Indicies (S&P500, Dow Jones, DAX, FTSE100) and Gold.
- Time Frame 5 min, 15min, 30min.
- Expiry Time (4-6 candles).
Buy Call or Buy:
- Trend CCI (170) crossed the zero line upwards (green bar >0);
- Entry CCI (34) crosses upward the zero line ;
- RSI (Relative Strength Index) indicator value is greater than 55 level;
- Heiken Ashi Smoothed indicator is color blue (optional).
Buy Put or Sell
- Trend CCI (170) crossed the zero line downwards (red bar <0);
- Entry CCI (34) crosses downward the zero line ;
- RSI indicator value is lower than 45 level;
- Heiken Ashi Smoothed indicator is color red (optiona).
Exit position for Scalping options:
- Entry CCI (34) crosses in opposite direction trend CCI (170),
- Profit Target:5 min time frame 7-10 pips, 15 min time frame (9-14 pips), 30 min time frame (15- 18 pips).
- Make Profit at fibopivot levels.
- Initial stop loss on the previous swing.
binary RSI(lir)
binary RSI oscillator is a powerful oscillator which shows the major trend according to momentum and volume

binary RSI(lir)binary RSI oscillator is a powerful oscillator which shows the major trend according to momentum and volume,

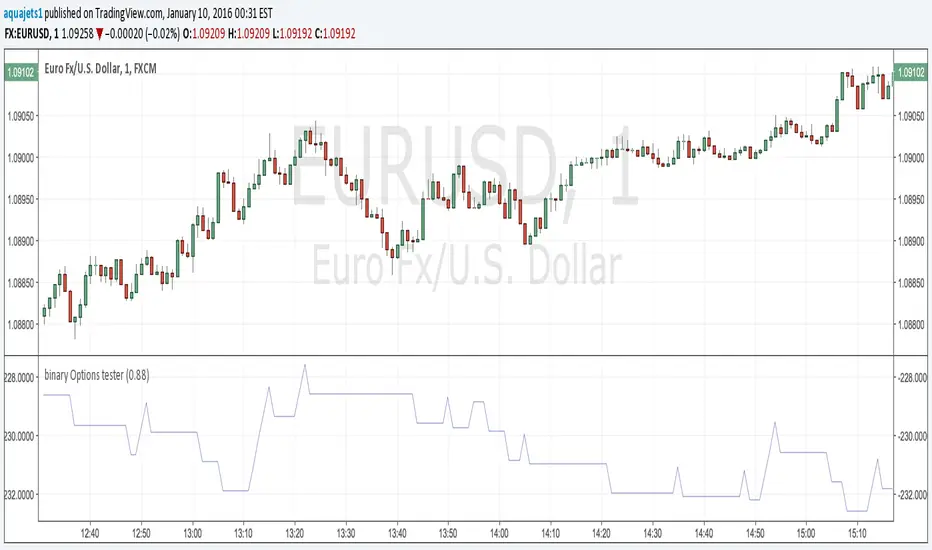
Binary Options Tester w/ Vdubus money managementAdded implementation of vdubus's money management strategy to binary options tester. As before, the entry/exit strategy is just there for an example, modify go_down and go_up for your strategy as the short and long entry points. Also as before, do not use present variables (i.e. close, close , ema_6_min in the example) in go_up and go_down, as this is akin to having future information. Calling past forms of compound present variables (ema(close,6) ) is fine.

Binary Options Strategy Testing ScriptThis is a script for testing binary options trading strategies. To test a strategy, modify the 'go_down' or 'go_up' booleans. These SHOULD NOT access any current values (for example, 'ohlc4' or 'close '), or the backtesting will not be an accurate representation of the forward values.
Modify the fraction_return input to be the return rate of the option on success. This is assumed to be a true 100 or 0 option- i.e. if the choice is not correct, there is a 100% loss.
The strategy in place is merely an example, and as you can see, has a very negative rate of return when implemented as a strategy.
Please comment in your code if you use this in any future posts. Thanks!
Binary Option Arrows (example) [TheMightyChicken]An example of binary option arrows for candlestick patterns bearish and bullish harami. With results as colored background and an option to choose your expiration (one candle by default). It's just an example for those who has their own strategy and wants to make nice arrows in their chart. All you need to do is rewrite piece of script in lines 9:13 - feel free to ask me for any help, but I believe it's all clear.
Disclaimer: It's just an example how to script arrows for binary option and I am not responsible for any loss of money by using this particular strategy.
I wish happy and successful trading! ;)


Binary Option Ultimate Backtester-V.1[tanayroy]The Binary Option strategy backtester gives the user extensive power to test any kind of strategy with advance trade management rules.
The strategy tester accepts external scripts as strategy sources. You can add your strategy and test it for historical stats.
Few assumption regarding strategy tester:
We are opening position at next candle after signal come
We are taking the position at opening price
Our call will be profitable if we get a green candle and put will be profitable if we get a red candle
We can open only one trade at a time. So if we are in trade, subsequent signals will be ignored.
How to make your strategy code compatible for strategy backtesting?
In your strategy code file add following lines:
Signal = is_call ? 1 : is_put ? -1 : 0
plot(Signal, title="🔌Connector🔌", display = display.none)
Is_call and is_put is your buy and sell signal. Plot the signal without displaying it in the chart. The new TradingView feature display = display.none, will not display the plot.
All Input options
Group: STRATEGY
Add Your Binary Strategy: External strategy to back test.
Trade Call/Put: Select CALL, to trade Call, PUT, to trade Put. Default is BOTH, Trading Call and Put both.
Number of Candles to Hold: How many candles to hold per trade. Default 1. If you want to hold the option for 30 minutes and you are testing your strategy in 15m intervals, use 2 candle holding periods.
GROUP: MARTINGALE
Martingale Level: Select up to 15 Martingale. Select 1 for no Martingale.
Use Martingale At Strategy Level: Instead of using Martingale per trade basis, using Martingale per signal basis. Like if we make a loss in the first signal, instead of starting martingale immediately we’ll wait for the next signal to put the martingale amount. For example if you start with $1 and you lose, at the next signal you will invest $2 to recover your losses.
Strategy Martingale Level: Select up to 15 Martingale at strategy signal level. Only workable if Use Martingale At Strategy Level is selected.
Type of Trade: Martingale trade type. Only workable if we are using Martingale Level more than 1.
It can be:
“SAME”: If you are trading CALL and incur a loss, you are taking CALL in subsequent Martingale levels.
“OPSITE”: if you are trading CALL and incur a loss, you are taking PUT in subsequent Martingale levels.
“FOLLOW CANDLE COLOR”: You are following candle color in Martingale levels, i.e if the loss candle is RED, you are taking PUT in subsequent candles.
“OPPOSITE CANDLE COLOR”: You are taking opposite candle color trade, i.e if the loss candle is RED, you are taking CALL in subsequent candle.
GROUP: TRADE MANAGEMENT
Initial Investment Per Option: Initial investment amount per trade
Payout: Per trade payout in percentage
Use Specific Session: Select to test trade on specific session.
Trading Session: Select trading session. Only workable if Use Specific Session is selected.
Use Date Range: Select to use test trades between dates.
Start Time: Select Start Time. Only workable if Use Date Range is selected.
End Time: Select end Time. Only workable if Use Date Range is selected.
Early Quit: Select to quit trade for the day after consecutive win or loss
Quit Trading after Consecutive Win: Number of consecutive wins. Only workable if early Early Quit is selected.
Quit Trading after Consecutive Loss: Number of consecutive losses. Only workable if early Early Quit is selected.
Buy/Sell Flip: Use buy signal for sell and sell signal for buy.
GROUP:STATS
Show Recent Stats: Show win trades in last 3,5,10,15,25 and 30 trades.
Show Daily Stats: Day wise win trades and total trades.
Show Monthly Stats: Month wise win trades and total trades.
Result and stat output:
Back tester without any strategy.
Strategy added with default option.
Stats with 7 Martingales. You can test up to 15.
Optional Stats:
Example Strategy code used :
//@version=5
indicator("Binary Option Strategy",overlay = true)
length = input.int(7, minval=1)
src = input(close, title="Source")
mult = input.float(3.0, minval=0.001, maxval=50, title="StdDev")
basis = ta.sma(src, length)
dev = mult * ta.stdev(src, length)
upper = basis + dev
lower = basis - dev
fab_candle_upcross=(high< upper and low>basis)
fab_candle_downcross= (high< basis and low>lower)
up_cross=ta.barssince(ta.crossover(close,basis))
down_cross=ta.barssince(ta.crossunder(close,basis))
is_first_up=false
is_first_down=false
if fab_candle_upcross
for a=1 to up_cross
if fab_candle_upcross
is_first_up:=false
break
else
is_first_up:=true
if fab_candle_downcross
for a=1 to down_cross
if fab_candle_downcross
is_first_down:=false
break
else
is_first_down:=true
//strategy for buying call
is_call=(is_first_up or is_first_down ) and close>open
//strategy for selling call
is_put=(is_first_up or is_first_down ) and close

Binary KillerThis Binary Options strategy is for the 1-minute timeframe and utilized the martingale strategy. If it does not win the first one, and there is a signal to re-enter, 2.5x your trade amount and enter. (The most I have seen this strategy lose is four times in a row.) If you follow the signals, you are looking at a very high win percentage (relative term) when you combine the re-entries for the win.
1. Set alerts on ONCE PER BAR, do not set for bar end.
2. Once the alert signals, go to the chart and watch to make sure the signal CLOSES at the end of the candlestick. (While you are doing this you should have your binary options broker up, setting up your trade. Make sure you start your trade small. Nobody ever went broke taking a profit)
3. Set your trade time for 1 minute, enter as soon as the candle CLOSES, and the signal is confirmed. (It will go away if it is not a confirmed entry, DO NOT enter if the signal goes away)
4. If the trade is losing, look for a re-entry signal, enter at the close of the candle. Continue as long as you get signals or until you win.
*Trade this at your own risk, it is a risky strategy, know your limits, and do not overtrade. Get a few wins and get off.
Try not to mess with the settings too much, these are optimized for every forex pair.
This indicator is a combination of Bolinger Bands, Stoch, and RSI methods to ensure the best possible entry.

Binary Option Turbo M1 by MercalonaAuto risk
You are diving into a high-risk investment. We are not responsible for losses, the only certainty is that they will come, the most important thing is to manage them. Test this script on a demo account, and use the backtest. Make sure you are familiar with it before using real money. Use all your experience and other assistance for better accuracy. Do not risk more than 5% per day. Try to use a maximum of 1-2%.
Recommendations
It is highly recommended whenever trying to make entries in stronger areas
Try to make entries when the graph is in trend and with good movements. It is better to lose an entry than to lose money.
Check if the chart is already with good accuracy before making your entry. At least 65%.
Try to make entries when the payout is above 75%. This will help you with risk / return.
About the Script
This script was developed to identify good entry areas quickly and safely. We recommend using in binary option, where the next candle is successful. Although it can also be used in other markets, using a larger timeframe, such as 1h or 4h.
How it works?
This script is based on trends, up and down, where up trend, we look for "CAL" entries in retractions, and down trends, the entries will be "PUT". Always operate in favor of the trend for better accuracy. A session filter is also displayed. The Filter is based on the New York and London session. In these periods there is a greater market volatility, where it is recommended to operate and avoid losses. In addition, there is also a (no trend) filter. Where it shows whether the chart is volatile or not, even during open market sessions.
What is the final result?
This script will show good entries areas. These areas are represented with lines. The lines closest to the current price are thinner lines. And the lines far from price are thicker. The thick lines represent stronger areas and are resistant to price. This means that there is a greater possibility of reversal when prices touch these lines.
Settings (mode)
There are 2 configuration modes:
1. MODERATELY
2. AGGRESSIVE
Using the "MODERATELY" mode, the signals are rarer, here we expect the price to hit the best areas indicated. To place the entry. Here we expect greater accuracy.
In "AGGRESSIVE" mode, we don't expect good entries. Whenever the price hits entry areas it will be considered an entry. In this case, the accuracy is less, since the areas do not have a great potential for reversion.
Settings (Length)
Here the number of bars can be configured for the calculation of support and resistance areas. A low amount may not be enough to check for good areas. And a very large area can be confused with areas that really matter. Try to check the best quantity for the chart you want to trade.
Settings (Win Rate Limit)
Place the limit of analyzed signals in this field. It is restricted to the “Win Rate Max Bars” field, which will be explained below. If the configured limit is not reached, the cause is that there were not enough signals within the configured bar limit. ATTENTION: Understand that a high value will cause a slow calculation of the script.
Settings (Win Rate Max Bars)
This is information is used to limit the number of bars in the “Win Rate” calculation. ATTENTION: Understand that a high value will cause a slow calculation of the script.
Settings (Sessions)
There are 2 other configurations. New York session and London session. You can see how it works reading below.
Indicator “Stars of Recommendation”
The indicator has 3 stars of recommendation.
NO TRADE (There is no positive point to take chances)
In Session (At least 1 open market, this is a positive point to take chances)
In Trend (There is a good probability of assertiveness when it is on trend)
More than one identified area. (Generally, when there is more than one area, the more distant areas become stronger and stronger. This is a positive point when the price reaches them.)
Good luck ❤️
Please feedback us.
We hope this helps you!

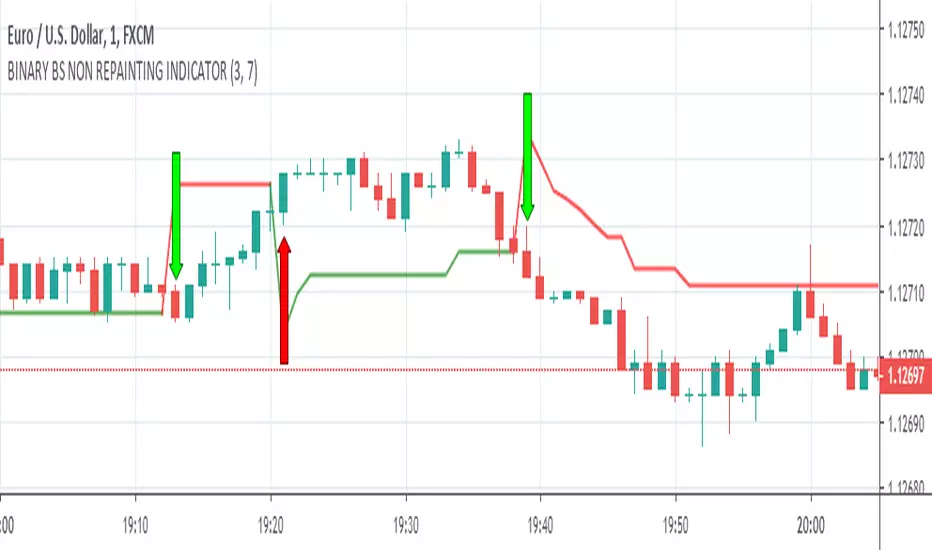
BINARY BS NON REPAINTING INDICATOR
Hello Binary Options traders, do you worry about loss in binary, now no need to worry, search my page in Fb, named "IQ Option Traders PK " ,like my page and send me a message, i will send you details of my strategy free of cost.
or comment below i will respond you.
thanks
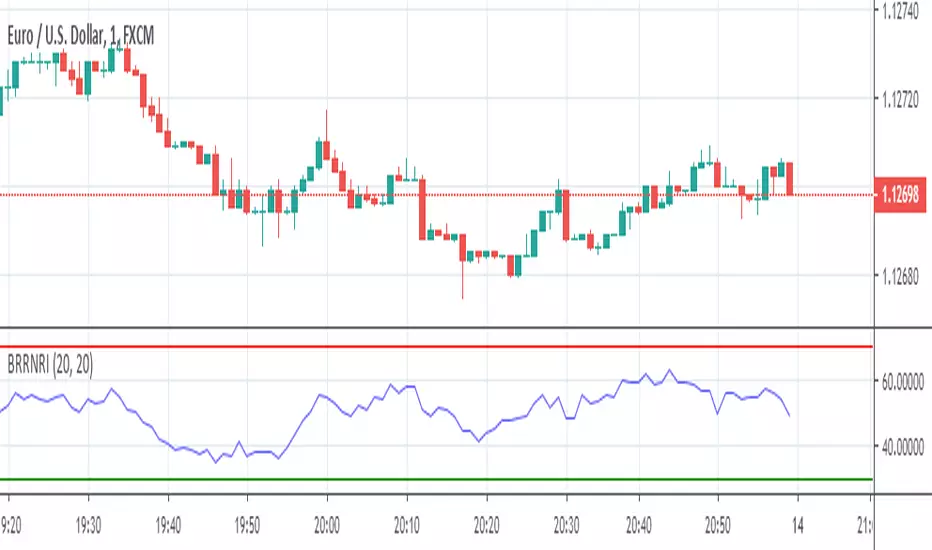
BINARY RR NON REPAINTING INDICATOR
Hello Binary Options traders, do you worry about loss in binary? now no need to worry, search my page in Fb, named "IQ Option Traders PK " ,like my page and send me a message, i will send you details of my strategy free of cost.
or comment below i will respond you.
thanks
Binary Option Strategy Tester with Martingale-Basic V.2In Binary options, strategy testing is a bit different. The strategy result depends upon expiry intervals and payout ratio.
My previous script was a try to resolve this but has some bugs in specific choices. The new version overcame those and added some new features useful for binary option strategy testing.
Assumption:
We are opening position at next candle after signal come
Chart interval is option expiry time.
We are taking the position at opening price
Our call will be profitable if we get a green candle and put will be profitable if we get a red candle
We can open only one trade at a time. So if we are in trade, subsequent signals will be ignored.
All Input Options:
Test Call/Put individually or both. Default BOTH
Select up to 5 Martingale levels. Default 2
Type of Martingale Trade. Default “SAME”
“SAME”: If you are trading CALL and incur a loss, you are taking CALL in subsequent Martingale levels.
“OPSITE”: if you are trading CALL and incur a loss, you are taking PUT in subsequent Martingale levels.
“FOLLOW CANDLE COLOR”: You are following candle color in Martingale levels, i.e if the loss candle is RED, you are taking PUT in subsequent candles.
“OPPOSITE CANDLE COLOR”: You are taking opposite candle color trade, i.e if the loss candle is RED, you are taking CALL in subsequent candle.
Select Specific Trading Session. Please select “USE SPECIFIC SESSION”. Default: TRUE
Put the investment amount per option. Default: 10
Payout ratio. Default: 80%
The strategy is taken from Vdub Binary Options SniperVX v1 (by @vdubus). I have deleted extra parts and kept only the necessary parts.
Result Table
Signal and Win Levels:
Signal and Loss:
Please note that Binary options trading is very risky. You must be aware of the risk and be willing to accept them in order to invest in binary options. Only invest what you can afford to lose. The past performance of any trading system, strategy, or methodology is not necessarily indicative of future results.

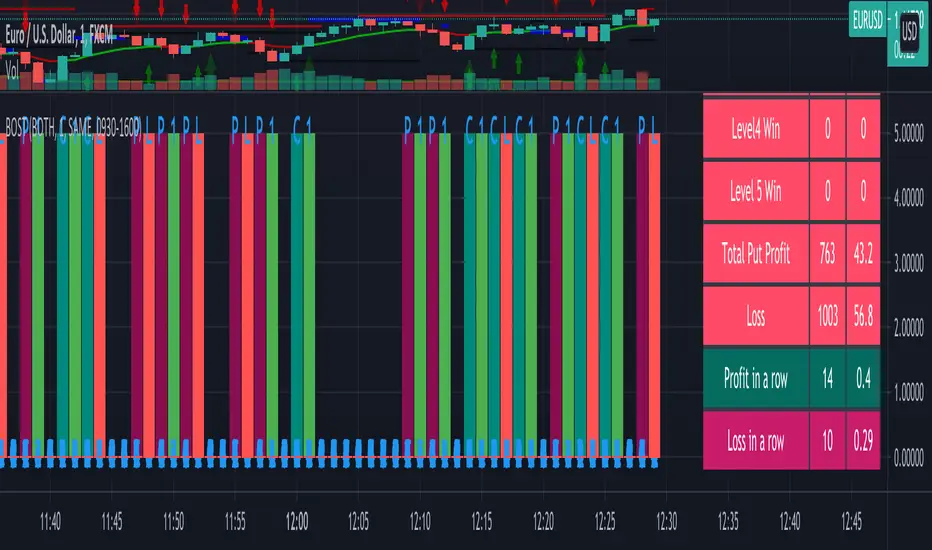
Binary Option Strategy Tester with MartingaleIn Binary options, strategy testing is a bit different. The script is just a try to test Binary options strategies.
Assumption:
We are opening position at next candle after signal come
We are taking the position at opening price
Our call will be profitable if we get a green candle and put will be profitable if we get a red candle
We can open only one trade at a time. So if we are in trade, subsequent signals will be ignored.
The script is not counting your profit or loss, it just counting the winning and losing trades.
Input Options:
Choose long only or short only test. Default is both.
You can continue your trade with Martingale Level, up to 5. Default is 1 (no Martingale)
You can choose Martingale trade type
SAME: if call subsequent trade will be call only and vice versa
OPPOSITE: if call subsequent trade will be put
FOLLOW CANDLE COLOR: Subsequent trade will follow previous candle color
OPPOSITE CANDLE COLOR: Subsequent trade will opposite of previous candle color
You can choose trading session to test. Default is false.
The strategy is taken from Vdub Binary Options SniperVX v1 (by @vdubus) . I have deleted extra parts and kept only the necessary part.
Without Martingale
Result Table
With Martingale
I am very new to Pine script, so waiting for your comments and review.
Binary Options Signals Provider M1-H4 [TradingFinder]🔵 Introduction
Binary Options trading is highly sensitive to timing, precision, and short-term price reactions. Unlike other trading styles, entries in binary markets must be executed at exact moments when price behavior, momentum, and liquidity conditions align within a very limited time window.
This Screener is designed to generate Binary Options trading signals based on pure price action analysis, market structure, and liquidity behavior rather than lagging indicators. The signals are not random alerts; they are produced only when price reacts at critical decision points defined by supply and demand zones.
The core logic focuses on how price behaves when it reaches areas of concentrated orders, where liquidity absorption or injection typically leads to fast directional moves. These reactions are evaluated through candlestick structure, momentum shifts, and false breakout behavior, which are essential for short-duration binary setups.
By combining order blocks, Fair Value Gaps, imbalances, and breaker structures with strict candlestick confirmation, this indicator identifies high-probability Long and Short Binary Options signals suitable for short-term expirations across multiple timeframes.
Rather than predicting the market, the indicator reacts to real-time order flow and liquidity interaction, making it a structured and disciplined tool for traders who rely on precise execution in Binary Options environments.
Long Signal :
Short Signal :
🔵 How to Use
The first step is to identify valid structural zones such as order blocks, Fair Value Gaps, imbalances, or breaker structures. These zones represent areas where order flow has previously shown a strong directional response and where future reactions are likely to occur.
Once a zone is identified, the indicator continuously monitors price behavior as it approaches and interacts with that area. A signal is generated only when price reaches a valid zone, liquidity behavior becomes evident, and a confirming candlestick structure forms in alignment with the expected direction.
This approach ensures that Binary Options signals are issued only during moments of active market participation, where short-term directional moves have the highest probability of success.
🟣 Long Signal
A Long Binary Options signal is generated when price reaches a validated demand zone, such as a bullish order block, an unfilled bullish Fair Value Gap, a lower-structure imbalance, or a bullish breaker.
As price enters the demand area, the indicator evaluates whether sell-side liquidity is being absorbed. This is reflected through changes in candlestick structure and momentum behavior.
Confirmation occurs when bullish price action patterns form, including structures such as :
Pin Bars with long lower wicks
Bullish Engulfing patterns
Rejection candles
False breakouts of local lows
Short-term momentum continuation after liquidity sweep
When these conditions align within or near the demand zone, the indicator issues a Long signal, indicating a high-probability bullish reaction suitable for Binary Options execution with short expirations.
🟣 Short Signal
A Short Binary Options signal is generated when price reaches a validated supply zone, such as a bearish order block, a bearish Fair Value Gap, an upper-structure imbalance, or a bearish breaker.
In these areas, price often collects buy-side liquidity above nearby highs before reversing. The indicator monitors this behavior and waits for clear bearish confirmation through candlestick structure and momentum shift.
Bearish confirmation patterns include :
Pin Bars with long upper wicks
Bearish Engulfing patterns
Rejection candles
Indecision followed by strong bearish displacement
False breakouts of local highs
Once price confirms rejection or liquidity exhaustion within or near the supply zone, the indicator generates a Short signal, highlighting a short-term bearish opportunity optimized for Binary Options trading.
🔵 Settings
Last Candle in Signal Direction: When On, a signal is issued only if the last candle moves in the direction required by the signal.
Signal in Nearly Zone : When enabled, the signal becomes valid even if the candle is near the zone rather than strictly inside it. When disabled, only signals formed inside the zone are allowed.
Table on Chart : This setting enables or disables the on chart screener table. When enabled, the table displays signal status, correlation information, and symbol data directly on the chart. When disabled, the chart remains clean with no table overlay.
Number of Symbols : This option controls how many symbol pairs are displayed in the screener table. Users can choose between four or six pairs depending on screen size and personal preference.
Table Size : This setting adjusts the visual scale of the screener table. Smaller sizes are suitable for minimal layouts, while larger sizes improve readability when monitoring multiple pairs simultaneously.
Table Mode : This setting offers two layout styles for the signal table.
Basic mode displays symbols in a single vertical column, using more vertical space and providing straightforward readability.
Extended mode arranges symbols in pairs side by side, optimizing screen space with a more compact and efficient layout.
Table Position : This option defines where the screener table is placed on the chart. The table can be positioned in any corner or central area to avoid overlapping with price action or other indicators.
🔵 Conclusion
Binary Options trading requires precise timing, disciplined execution, and a clear understanding of short-term market behavior. This indicator is built on the principle that high-quality binary signals emerge not from prediction, but from real-time price reactions at key liquidity zones. By combining supply and demand analysis with structural elements such as order blocks, Fair Value Gaps, imbalances, and breaker structures, the indicator filters out random price movements and focuses only on moments when the market is actively responding to order flow.
Signals are generated exclusively when price reaches a validated zone, liquidity behavior becomes evident, and a confirming candlestick forms at the correct location. This structured process helps reduce emotional or impulsive entries and maintains consistency in execution. Rather than acting as a standalone decision-maker, the indicator functions as a confirmation and timing tool, assisting traders in identifying high-probability Long and Short Binary Options setups across multiple timeframes while remaining aligned with the underlying mechanics of price and liquidity.
Платный скрипт

Binary Options Gold Scalping [TradingFinder] 1 & 5 Min Strategy🔵 Introduction
In binary options trading, price movements are often driven by the market’s tendency to reach key liquidity zones. These areas include Liquidity, Fair Value Gaps (FVGs), and Order Blocks (OBs), zones where a large number of pending orders are concentrated.
When price reaches one of these zones, it typically enters a Liquidity Sweep phase to collect available liquidity. After this process, the market often reacts sharply, either reversing direction or continuing its move with renewed momentum. Understanding this cycle forms the foundation of most smart money-based binary options strategies.
In this analytical approach, a Liquidity Sweep is usually seen as a False Breakout, often recognized through a distinctive candle confirmation pattern. The pattern appears when price briefly breaks a level to trigger stops, then quickly returns within range. This formation is one of the most reliable reversal signals for short-term trades and plays a central role in many binary options strategies.
After a liquidity sweep, price often returns to Fair Value Gap (FVG) or Order Block (OB) areas to restore balance in the market. These are zones where institutional orders are typically placed, and reactions around them can create high-probability trade setups. In binary options trading, this quick reaction following a sweep and retrace into an FVG or OB provides one of the best entry opportunities for short-term trades.
By combining the concepts of Liquidity Sweep, Fair Value Gap, and Order Block, traders can build a precise binary options strategy based on smart money behavior, allowing them to identify market reversals with greater confidence and enter at the optimal moment.
Bullish Setup :
Bearish Setup :
🔵 How to Use
This indicator is built on the Smart Money Concept (SMC) framework and serves as a core tool for accurately detecting Liquidity Sweeps, Order Blocks, and Fair Value Gaps in binary options trading.
Its logic is simple yet powerful : when price reaches high-interest liquidity zones and shows reversal signs, the indicator issues an entry signal immediately after a Candle Confirmation is complete.
Signals only activate when both the market structure and the candle confirmation pattern align, ensuring high accuracy in spotting genuine reversals.
🟣 Long Position
A bullish signal appears when the market, after a downward move, reaches sell-side liquidity zones where liquidity has built up below previous lows. In such conditions, a bullish Order Block or Fair Value Gap often exists in the same region, acting as a potential reversal point.
When the indicator detects the presence of liquidity, an imbalance zone (FVG), and a valid candle confirmation simultaneously, it triggers a green Call signal.
In a binary options strategy, the best entry moment is immediately after the candle confirmation closes, as this is when the probability of reversal is highest and the market tends to react strongly within the next few candles.
In the example below, after the liquidity sweep and candle confirmation, price quickly rallied, resulting in a Binary Win setup.
🟣 Short Position
A bearish signal occurs when price, after an upward move, reaches an area of buy-side liquidity and collects liquidity above recent highs. At this stage, the market is typically overbought and ready to reverse. If a bearish Order Block or Fair Value Gap exists in the same area and a candle confirmation pattern forms, the indicator displays a red Put signal.
This setup is highly accurate because multiple structural confirmations occur simultaneously : liquidity has been absorbed, price is rebalancing, and the confirmation candle has closed.
In binary options trading, this is the ideal moment to enter a Put (Sell) position, as the price reaction to the downside is usually quick and decisive.
In the example chart, the indicator generated a bearish signal right after the candle confirmation and completion of the liquidity sweep, price then dropped within minutes, resulting in another Binary Win.
🔵 Settings
Time Frame : Select the desired timeframe for analysis. If left blank, the indicator uses the chart’s current timeframe.
Swing Period : Defines how many candles are used to detect structural pivots (swing highs and lows). A higher value increases accuracy but reduces the number of signals.
Candle Pattern : Enables candle-based confirmation logic. When turned on, the indicator issues signals only if a valid reversal pattern is detected. You can also choose the confirmation filter strength, tighter filters show fewer but more precise signals.
🔵 Conclusion
A deep understanding of Liquidity Sweeps, Order Blocks, and Fair Value Gaps can make a decisive difference between ordinary and professional traders in the binary options market.
This indicator, combining smart money logic with candle confirmation, is one of the most precise tools for detecting true market reversals. When liquidity is collected and structural reversal signs emerge, the indicator automatically recognizes the price reaction and generates a reliable Call or Put signal.
Using this tool alongside market structure analysis and FVG detection allows traders to enter high-probability setups while filtering out false breakouts. For that reason, this binary options strategy is not only suitable for short-term trading but also valuable for understanding deeper smart-money behavior across timeframes.
Ultimately, success with this system comes down to two key principles: understanding the logic of the liquidity sweep and waiting for the candle confirmation to close. When these two conditions align, the indicator can pinpoint the best entry points with remarkable precision, helping you build a structured, intelligent, and profitable binary options strategy.

Binary Options 1 Minute Signals [TradingFinder] 1 Min Strategy🔵 Introduction
At first sight, price movement in binary options appears random, but behind every move lies a clear logic of liquidity and market imbalance. The market is always driven by the hunt for liquidity and the continuous rebalancing that takes place around Fair Value Gaps (FVGs) and Order Blocks (OBs). These zones are where institutional activity is concentrated and where Smart Money creates the most significant reactions.
When price approaches a key liquidity zone, it often performs a Liquidity Sweep to capture orders resting around previous highs or lows. This move usually presents itself as a False Breakout. Price briefly breaks a level to trigger stop losses and collect liquidity, then quickly reverses direction. Understanding this false breakout behavior is essential for identifying high probability reversals in binary options trading.
After the liquidity sweep, price typically retraces into a Fair Value Gap or Order Block, where the market seeks balance and new orders are introduced. This interaction between liquidity, imbalance, and institutional order flow forms the core logic of every Smart Money trading model.
By focusing on Liquidity Sweeps, False Breakouts, and the structure of FVGs and OBs, traders can read the true intention behind price movements. What seems like random volatility becomes a structured cycle of liquidity collection and reaction, offering clear opportunities for precision-based binary entries.
Bullish Setup :
Bearish Setup :
🔵 How to Use
This indicator works within the Smart Money framework and focuses on the connection between Liquidity Sweep, False Breakout, Fair Value Gap (FVG) and Order Block (OB).
It is created to help traders identify the moment when the market finishes collecting liquidity and begins to show signs of reversal.
The indicator studies how price behaves around zones where liquidity is concentrated, such as previous highs and lows or areas with visible inefficiency. When a clear reaction forms and a valid candle pattern confirms the shift in direction, the indicator generates a signal that represents the activity of Smart Money.
This tool does not respond to random volatility or noise. It waits for structure, liquidity and confirmation to align together before providing an entry. As a result, every signal has a logical base related to institutional order flow rather than ordinary price fluctuations. This approach allows traders to focus only on the movements that reflect true liquidity behavior.
🟣 Long Setup
A bullish setup takes place when the market moves downward and reaches a sell-side liquidity zone located below previous swing lows. In this area, price performs a Liquidity Sweep by moving under key levels to trigger stop losses and capture liquidity from trapped sellers.
This movement usually appears as a False Breakout because the market breaks below a level for a short moment and then quickly moves back inside the range.
Around this zone, a bullish Order Block or Fair Value Gap (FVG) often exists, showing where institutional demand is active.
When the indicator detects the presence of liquidity collection together with a valid bullish confirmation candle near an OB or FVG, it creates a Call signal.
This marks the moment when Smart Money is shifting from selling pressure to accumulation, and a strong bullish move often follows. For binary entries, the best opportunity usually comes immediately after the confirmation candle closes.
The reaction tends to happen quickly because the liquidity grab has completed and new institutional buying pressure is entering the market. This type of setup often provides a clean and precise entry with a high probability of success.
🟣 Short Setup
A bearish setup happens when the market rises and enters a buy-side liquidity area above previous highs. Here, the market performs a Liquidity Sweep to trigger stop losses placed above those highs and to absorb liquidity from trapped buyers.
This pattern forms what traders recognize as a False Breakout because the price only breaks the level temporarily before reversing in the opposite direction. A bearish Order Block or Fair Value Gap (FVG) often appears around this zone, showing where institutional selling interest exists.
Once the liquidity sweep completes and a bearish confirmation candle closes, the indicator produces a Put signal that reflects the shift from buying to selling pressure by Smart Money.
This moment often leads to a fast downward reaction as the market rebalances and fills the nearby inefficiency.
The most effective entry for binary trading is right after the confirmation candle closes, when the false breakout and liquidity collection are both completed. The price usually reacts sharply as the market transitions from liquidity hunting to a new directional move. This setup represents a structured view of how liquidity drives market cycles and how Smart Money creates precise reversals through controlled imbalance and reaction.
🔵 Settings
Time Frame : Defines the timeframe used for analysis. If left blank, the indicator automatically uses the chart’s current timeframe.
Swing Period : Determines how many candles are used to identify structural turning points such as swing highs and swing lows. Higher values increase accuracy but reduce the number of signals.
Signal Type : Specifies the type of signal generated by the indicator. The option All shows every signal, Main Signal displays only the primary one, and Alternative Signal produces a secondary signal that appears one candle after the main signal for additional confirmation.
Candle Pattern : Enables candle pattern logic for reversal confirmation. When active, the indicator issues a signal only when a valid candle formation confirms the market reaction.
Candle LookBack Check : Verifies that the last few candles move in the opposite direction of the signal to be generated. This condition acts as a confirmation filter, ensuring that the signal appears only after a clear counter-move in price.
Last Candle Direction : Considers the direction of the most recent candle in the analysis. It helps determine whether the final candle moves with or against the current trend.
Last Candle Shadow Ratio : Sets the ratio between the last candle’s wick and body to refine confirmation accuracy. Higher values require longer wicks, indicating stronger rejection and a more reliable reversal pattern.
🔵 Conclusion
Trading with Smart Money logic means understanding how liquidity moves through the market.
Each Liquidity Sweep, False Breakout, Fair Value Gap (FVG) and Order Block (OB) reflects the process of collecting and redistributing orders.
This indicator captures that sequence and turns it into precise, structured signals for binary entries. When liquidity is absorbed and a candle confirmation appears, the market reveals its true direction.
At that moment, traders can act with confidence, following institutional flow instead of reacting to random price moves.
Success with this system comes from patience, confirmation, and a clear reading of liquidity behavior, the core principles behind every Smart Money reversal.

Binary Options Fast Scalping [TradingFinder] M1 & M5 Signals🔵 Introduction
In the structure of financial markets, spiky moments and sudden price movements play a key role in Liquidity Grabs and Market Structure Resets. These movements usually occur after the accumulation of orders in Buy Side or Sell Side Liquidity zones and are accompanied by rapid breaks in the form of Break of Structure (BoS) or Change of Character (CHoCH).
At this stage, the market temporarily moves in the direction of liquidity to trigger counter orders and then enters a Retracement or Pullback phase, a point where professional traders using the Smart Money Concept (SMC) look for candle confirmation to enter with precision.
This strategy is built upon the same logic : an initial spiky move as a signal of institutional or liquidity driven algorithms, followed by a controlled pullback toward areas such as the Order Block, Fair Value Gap (FVG), or Imbalance Zone, and finally an entry based on a strong confirmation candle (Engulf, Rejection, Breaker) that defines the true direction of order flow.
This combination of price behavior, especially on lower timeframes such as M1 or M5, provides an ideal setup for fast Scalping, Micro Structure Trading, and even short term directional prediction in Binary Options Trading.
Since the main focus of this method is on identifying liquidity phases, structural confirmations, and momentum confirmation candles, the trader can design entries with high probability and logical stop loss placement using the concepts of Fractal Market Structure and Multi Timeframe Confirmation.
In the scalping version, the main objective is to capture the move toward the next liquidity pool or opposite demand and supply zone, while in the binary version, only the prediction of the next candle’s direction matters. This strategy inherently operates based on Smart Money Behavior, Liquidity Engineering, and Order Flow Dynamics, allowing the extraction of fast and profitable moves from the internal logic of market structure.
🔵 How to Use
The operational logic of this strategy is based on Liquidity Sweep, Pullback, and Confirmation Candle. The trader should first identify the initial Impulse Move, which is often accompanied by liquidity absorption around Buy Side or Sell Side Liquidity areas. After that, the market enters the Retracement phase and returns to structural zones such as the Order Block or the Fair Value Gap (FVG).
At this point, a position is taken only when a confirmation candle (Engulf, Breaker, or Rejection Candle) closes in the direction of continuation and aligns with the new structure (BOS or CHoCH). Applying this model on lower timeframes offers the highest precision for fast Scalping or for predicting the next candle’s direction in Binary Option trading.
🟣 Bullish Setup
In the bullish setup, the market first forms a spiky upward move with a sudden increase in momentum, indicating the activation of liquidity flow in the Buy Side Liquidity zone. This movement is usually accompanied by a Break of Structure (BOS) to the upside and marks the beginning of the Impulse Move phase. After this move, the price enters the Pullback phase and returns to structural areas such as the Bullish Order Block, Fair Value Gap (FVG), or Mitigation zone.
At this stage, the trader waits for a bullish confirmation candle (Bullish Engulf or Breaker Candle) to validate the end of the retracement. Entry is made at the close of the confirmation candle or on a minor pullback, with the stop loss placed below the Swing Low or below the pullback zone. The target is set at the next Buy Side Liquidity or Equal Highs. In the binary version, only the direction of the next candle matters and the entry takes place immediately after the confirmation candle.
🟣 Bearish Setup
In the bearish setup, the market first forms a spiky downward move, signaling increased selling pressure and liquidity absorption at the Sell Side Liquidity zone. This movement is accompanied by a Break of Structure (BOS) to the downside and represents the beginning of a bearish momentum phase. After the spike, the price enters the Retracement phase and returns to the Bearish Order Block or bearish Fair Value Gap zone. Within these areas, the formation of a bearish confirmation candle (Bearish Engulf, Breaker, or Rejection Candle) validates the continuation of the downtrend.
The entry is taken at the close of the confirmation candle, with the stop loss placed above the Swing High or above the pullback zone, and the target set toward the next Sell Side Liquidity or Equal Lows. In binary applications, only the direction of the next candle is considered and the confirmation candle serves as the entry trigger.
🔵 Conclusion
This strategy, by combining the principles of the Smart Money Concept, Liquidity Dynamics, and Candle Confirmation Logic, offers a precise and multi functional approach to market entry. Its core structure, identifying the initial spiky movement, waiting for a structural pullback, and entering based on a confirmation candle allows quick interpretation of institutional liquidity behavior and provides trading opportunities with high accuracy and controlled risk.
On lower timeframes, this logic becomes a powerful tool for Scalping and Micro Structure Trading, while in binary markets it delivers high success rates due to its focus on predicting the next candle’s direction. Built upon the foundations of Order Flow, Market Structure, and Fractal Liquidity Behavior, this strategy demonstrates that even in the fastest and noisiest market conditions, the order of Smart Money remains observable and exploitable.

Binary Options TrendOnly for trading binary options.
Use 5 sec candles in your options trading software (IQ Option, Expert Option etc.)
Win more than 60% of trades.
Recommended Timeframe : 1 min
Long : When the color is darker green
Short : When the color is darker red
Reviews and Suggestions are welcome.
Feedback Appreciated.
Thank you.
