POWERPUFFGIRLS WE ARE GIRLS PROGRAMMING GREAT CODES, WE CREATE THIS INDICATOR THAT GIVE YOU THE CONTROL OVER THE ALERTS, JUST BUY IT WHEN GREEN ARROW APPEARS, AND SELL HEN THE RED ONE COMES OUT, GOOD LUCK
Поиск скриптов по запросу "binary"

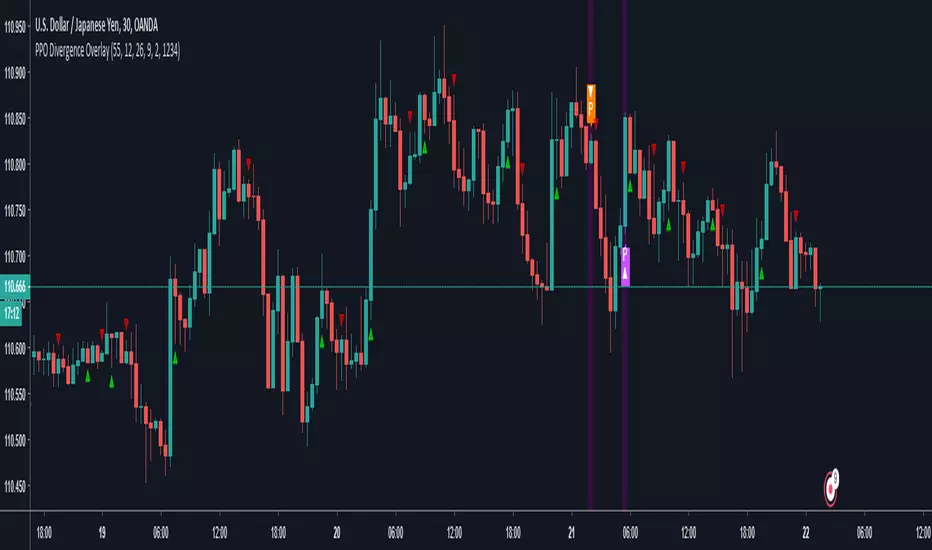
Divergence With OverlaysThis is a nice script
Modification request by @emanuel.
Great thanks to
This script creates mixed alerts and removes any repaints by using v3
signal manipulation is also edited from the offset
ANB AI Alert (my ANN)Hi guy
This is a high level trend predicting study. It is modified from the strategy by sirlof.
Feel free to use it as you like.
::USAGE only on 15 minutes
1. add the study in your chart
2. create an alert on the right
3. select ANB AI Alert (my ANN)(0,1D)
4. select the option you wish
5. select once per bar close alert
6. you can select email alert which i usually like
7. once the trade is alerted, execute your trade
TP: DYNAMIC (read more)
SL: null
Setting TP and SL: this is in consideration with the daily volatility and sessions
USDCAD TP 400 points, no stop loss.
To maximize profit, use trailing stops. most trades are 500 to 1800 points

VEMA Band_v2 - 'Centre of GravityConcept taken from the MT4 indicator 'Centre of Gravity'except this one doesn't repaint.
Modified / BinaryPro 3 / Permanent Marker
Ema configuration instead of sma & centralised.

Vdub_Tetris_Stoch_V1Vdub_Tetris_Stoch_V1
A combination lower based indicators based on the period channel indicator Vdub_Tetris_V2
Blue line is more reactive fast moving, Red line in more accurate to highs / Lows with divergence.- Still testing
Code title error
Change % = Over Bought / Over Sold
Vdub Tetris_V2
Vdubus BinaryPro 2 /Tops&Bottoms
StochDM

HFX321This indicator will provide the possibility of when trend reversals may happen on shorter time frames. It can work on any time frame and the use of Heiken Ashi candles can enhance it further.
When used with other indicators such as the Stochastic RSI, support, resistance and trend lines, it can increase the possibility of a trend reversal being identified. On shorter time frames the alerts are much more frequent therefore can be less accurate so other indicators may be used.
It will show an alert Arrow (green) pointing UP for the First Candle after a pivot LOW (LL, HL) that could indicate a trend reversal.
It will show an alert Arrow (red) pointing DOWN for the First Candle after a pivot HIGH (HH, LH) that could indicate a trend reversal.
The Colour changes on the Moving Average from Red to Green and green to red to support a trend change possibility.
This has been designed to provide a visual confirmation that selected indicators have met certain criteria and that the trend has the possibility of reversing in the near future.
It is NOT meant to be a trading system or offer trading advice. The indicator offers only possibilities of trend reversals when the above criteria is met.
This is designed for Trend analysis ONLY.
To gain access to this invite only script, please send me a private message on Trading View so I can assist you further.
Thanks Les Gallagher


Commodity Channel Index - CCI🎯 Overview
This is an enhanced Commodity Channel Index (CCI) indicator that transforms the traditional CCI into a centerline-focused momentum tool with moving average smoothing and comprehensive visual enhancements. Unlike standard CCI which uses ±100 levels, this version focuses on the 50-level centerline for clearer trend direction signals.
🧩 Core Components
1. ⚙️ Technical Foundation
📊 Primary Calculation: Uses TradingView's built-in ta.cci() function
📈 Statistical Approach: Measures current price relative to statistical mean
🎯 Scale Modification: Focuses on 50 as neutral (unlike traditional ±100)
📏 Default Length: 55 periods (optimal for medium-term trends)
2. 🎛️ Configuration Parameters
📏 CCI Length: Default 55 periods
📈 CCI MA Length: 30-period moving average
🔄 MA Type: 6 options (EMA, SMA, RMA, WMA, VWMA, HMA)
🎨 Color Themes: 5 visual schemes matching your other indicators
📈 Signal Interpretation:
🟢 BULLISH: CCI > 50 (price above statistical mean)
🔴 BEARISH: CCI < 50 (price below statistical mean)
👁️ Visual Features
📉 Chart Elements:
📊 Main CCI Line:
Shows raw CCI momentum
📈 Signal Line (CCI MA):
Yellow moving average of CCI
30-period default provides smoothed trend
🎨 Fill Zones:
🟢 Upper Zone : Bullish momentum area
🔴 Lower Zone : Bearish momentum area
📋 Dashboard Display:
Content: "⬆️ Bullish" or "⬇️ Bearish" indicator
Purpose: Instant market bias assessment
⚡ Trading Applications
📈 Primary Uses:
🎯 Trend Direction Identification
CCI > 50 = Uptrend momentum
CCI < 50 = Downtrend momentum
📊 Extreme Momentum Detection
CCI > 100 = Strong bullish (traditional)
CCI < -100 = Strong bearish (traditional)
CCI near ±300 = Extreme conditions
🔄 Mean Reversion Opportunities
Useful in ranging markets
🎯 Signal Types:
📈 Trend-Following: Stay long when CCI > 50, short when < 50
🔄 Mean Reversion: Fade extreme readings (>100 or <-100)
⚡ Crossover Signals: CCI crossing 50 provides entry/exit points
🎨 Customization Options
🔄 Moving Average Types:
📉 EMA: Exponential - responsive to recent CCI changes
📊 SMA: Simple - smooths CCI equally
📈 RMA: Relative - TradingView's special MA
⚖️ WMA: Weighted - emphasizes recent CCI values
💎 VWMA: Volume-weighted - incorporates volume indirectly
🚀 HMA: Hull - reduces lag on CCI signals
🎨 Visual Themes: (Consistent with your suite)
🎨 Classic: Green/Red (traditional)
🚀 Modern: Cyan/Purple (contemporary)
💪 Robust: Amber/Deep Purple (high contrast)
🌈 Accented: Purple/Magenta (vibrant)
⚫⚪ Monochrome: Light Gray/Dark Gray (minimalist)
🔔 Alert System
🟢 LONG Alert: Triggers when CCI > 50
🔴 SHORT Alert: Triggers when CCI < 50
📧 Format: Includes ticker symbol for portfolio tracking
⚡ Key Advantages
✅ Strengths:
🎯 Clear Centerline Focus: 50-level provides unambiguous trend direction
📊 Statistical Foundation: Based on mean deviation (more robust than simple oscillators)
👁️ Extreme Zone Visualization: ±300 boundaries show momentum extremes
🔄 Versatile Application: Works for both trend-following and mean reversion
📱 Professional Suite: Consistent design with your RSI and SMI indicators
⚡ Optimal Settings:
📈 Trending Markets: 55-period CCI (default)
🔄 Ranging Markets: Shorter periods (20-30)
📊 Volatile Markets: Longer periods (80-100)
📱 Day Trading: 20-period with EMA smoothing
🏆 Unique Features:
Statistical Rigor: Based on mean deviation (not just price differences)
Wide Range: ±300 scale captures extreme movements
Centerline Focus: Clear binary trend signals
Visual Harmony: Consistent with your indicator suite design
This CCI indicator provides a statistically robust approach to trend identification while maintaining the visual consistency and user-friendly design of your trading suite! 📊✨

Adaptive Kinetic Ribbon [QuantAlgo]🟢 Overview
The Adaptive Kinetic Ribbon indicator synthesizes price velocity and volatility dynamics to identify trend direction, momentum strength, and acceleration phases across varying market conditions. It combines velocity-based momentum measurement, adaptive volatility weighting, dual-speed ribbon analysis, and acceleration-deceleration detection into a unified visual system that quantifies periods of sustained directional movement and momentum shifts, helping traders and investors identify trend continuation and reversal signals across various timeframes and asset classes.
🟢 How It Works
The indicator's core methodology lies in its adaptive kinetic approach, where velocity and volatility components are calculated dynamically and then smoothed through an adaptive alpha mechanism.
First, Velocity is measured to capture raw directional momentum by calculating the net price change over the lookback period:
velocity = source - source
This creates a momentum vector that quantifies how far and in which direction price has moved, providing the foundation for understanding trend strength and establishing whether the market is in a sustained directional phase.
Then, Volatility is computed to evaluate price variability and market noise by analyzing the standard deviation of bar-to-bar price changes:
volatility = ta.stdev(source - source , length) * mult
The volatility sensitivity multiplier allows traders to adjust how responsive the indicator is to market noise, with higher values creating faster adaptation during volatile periods and lower values maintaining stability during choppy conditions.
Next, Adaptive Alpha is calculated to create a dynamic smoothing coefficient that automatically adjusts based on the relationship between velocity and volatility:
adaptive_alpha = math.abs(velocity) / (math.abs(velocity) + volatility)
This alpha value ranges from 0 to 1, where values closer to 1 indicate strong, clear directional movement (high velocity relative to volatility), causing the indicator to respond quickly, while values closer to 0 indicate noisy, range-bound conditions (high volatility relative to velocity), causing the indicator to smooth more heavily and filter out false signals.
Following this, the Kinetic Line is constructed using exponential smoothing with the adaptive alpha coefficient:
var float kinetic_line = na
kinetic_line := na(kinetic_line ) ? source : kinetic_line + adaptive_alpha * (source - kinetic_line )
This creates an adaptive moving average that automatically adjusts its responsiveness: during strong trends with clear velocity, it tracks price closely like a fast EMA; during choppy, volatile periods, it smooths heavily like a slow SMA, providing optimal trend identification across varying market regimes without manual parameter adjustment.
Then, Ribbon Lines are generated by applying additional moving average smoothing to the kinetic line at two different speeds:
ribbon_fast = ma(kinetic_line, ribbon_fast_length, ma_type)
ribbon_slow = ma(kinetic_line, ribbon_slow_length, ma_type)
The dual-ribbon structure creates a visual envelope around the kinetic line, where the fast ribbon responds quickly to kinetic changes while the slow ribbon provides trend confirmation, with crossovers between these ribbons generating primary trend reversal signals.
Finally, Trend State and Acceleration are determined by analyzing the relative positioning and directional movement of the ribbon lines:
trend_up = ribbon_fast > ribbon_slow
acceleration = ribbon_fast > ribbon_fast
ribbonColor = trend_up ?
acceleration ? bullAccel : bullDecel :
not acceleration ? bearAccel : bearDecel
This creates a four-state classification system that distinguishes between bullish acceleration (uptrend strengthening), bullish deceleration (uptrend weakening), bearish acceleration (downtrend strengthening), and bearish deceleration (downtrend weakening), providing traders with nuanced momentum insights beyond simple bullish/bearish binary signals.
🟢 Signal Interpretation
▶ Bullish Acceleration (Bright Green): Fast ribbon above slow ribbon AND fast ribbon rising, indicating confirmed uptrend with building momentum = Strongest bullish condition, ideal for new long entries, adding to positions, or holding existing longs with confidence
▶ Bullish Deceleration (Dark Green): Fast ribbon above slow ribbon BUT fast ribbon falling, indicating uptrend intact but momentum weakening = Caution signal for longs, potential trend exhaustion developing, consider tightening stops or taking partial profits
▶ Bearish Acceleration (Bright Red): Fast ribbon below slow ribbon AND fast ribbon falling, indicating confirmed downtrend with building momentum = Strongest bearish condition, ideal for new short entries, exiting longs, or maintaining defensive positioning
▶ Bearish Deceleration (Dark Red): Fast ribbon below slow ribbon BUT fast ribbon rising, indicating downtrend intact but momentum weakening = Caution signal for shorts, potential trend exhaustion developing, prepare for possible reversal or consolidation
▶ Bullish Crossover: Fast ribbon crosses above slow ribbon, signaling trend reversal from bearish to bullish and initiation of new upward momentum phase = Primary buy signal, entry opportunity for trend-following strategies, exit signal for short positions
▶ Bearish Crossover: Fast ribbon crosses below slow ribbon, signaling trend reversal from bullish to bearish and initiation of new downward momentum phase = Primary sell signal, entry opportunity for short strategies, exit signal for long positions
▶ Ribbon Spread Width: Distance between fast and slow ribbons indicates trend strength and conviction, where wider spreads suggest strong, sustained directional movement with low reversal probability, while tight or converging ribbons indicate weak trends, consolidation, or impending reversal conditions
▶ Bar Color Alignment: When bar coloring is enabled, candlestick colors mirror the ribbon state providing immediate visual confirmation of momentum conditions directly on price action, eliminating the need to reference the indicator separately and enabling faster decision-making during active trading
🟢 Features
▶ Preconfigured Presets: Three optimized parameter configurations accommodate different trading styles, timeframes, and market analysis approaches: "Default" provides balanced trend identification suitable for swing trading on 4-hour and daily charts, "Fast Response" delivers heightened sensitivity optimized for intraday trading and scalping on 5-minute to 1-hour charts, and "Smooth Trend" offers conservative trend identification ideal for position trading and long-term analysis on daily to weekly charts.
▶ Built-in Alerts: Three alert conditions enable comprehensive automated monitoring of trend reversals and momentum transitions. "Bullish Crossover" triggers when the fast ribbon crosses above the slow ribbon, signaling the shift from downtrend to uptrend and the beginning of bullish momentum building. "Bearish Crossover" activates when the fast ribbon crosses below the slow ribbon, signaling the shift from uptrend to downtrend and the beginning of bearish momentum building. "Any Ribbon Crossover" provides a combined notification for either bullish or bearish crossover regardless of direction, useful for general trend reversal monitoring and ensuring no momentum shift goes unnoticed.
▶ Color Customization: Six visual themes (Classic, Aqua, Cosmic, Cyber, Neon, plus Custom) accommodate different chart backgrounds and visual preferences, ensuring optimal contrast and immediate identification of acceleration versus deceleration states across various devices and screen sizes. Each preset uses distinct colors for the four momentum states (bullish acceleration, bullish deceleration, bearish acceleration, bearish deceleration) with proper visual hierarchy. Optional bar coloring with adjustable transparency provides instant visual context of current momentum state and trend direction without switching between the price pane and indicator pane, enabling traders and investors to immediately assess trend positioning and acceleration dynamics while analyzing price action patterns and support/resistance levels.

MA Smart SyncMA Smart Sync determines the market bias by evaluating the price position relative to a moving average channel on four independent timeframes and returning a confluence signal when a configurable number of them agree.
Unlike standard MTF trend indicators that rely on EMA crossovers or slope direction, this script builds a channel around each timeframe and classifies price into three discrete zones: above, below, or inside. The "inside" state acts as a neutral filter, preventing false confluence signals during consolidation — a key distinction from binary up/down dashboards.
The channel itself can be constructed using five different methods selectable from a single input: High/Low MA (separate MAs applied to high and low), Close ± ATR, Close ± Standard Deviation, Close ± percentage offset, or classic Bollinger Bands. All five use the same MA type and length inputs, making it straightforward to compare how different volatility envelopes behave on the same instrument without rebuilding the indicator.
How to use:
— Set four timeframes matching your trading plan (defaults: 15m, 1h, 4h, D).
— Choose the channel method that fits your instrument's volatility profile. ATR-based channels adapt well to forex; StdDev and Bollinger suit equities and indices.
— Set "Minimum Confluence" to 3 or 4. A value of 4 means all timeframes must agree before a signal fires.
— The background color and arrow labels update only when bias changes, keeping the chart clean.
— Use the status table (top-right) to monitor each timeframe independently and identify which TFs are lagging.

TradeX Guru Intraday Scalping SetupThe TradeX Guru Scalping setup is a multivariate analysis system designed to isolate high-probability market vectors by filtering stochastic market noise. Unlike linear indicators that rely on singular data points, this system employs a "Composite Confluence Algorithm" that synthesizes directional bias, momentum magnitude, harmonic cycles, and volumetric deviation into a unified signal output.
This tool is engineered for traders requiring low-latency decision support, featuring automated variance-based risk modeling (Dynamic Stops & Targets) and real-time market telemetry displayed directly on the chart.
Methodology & Underlying Principles This script operates as a Multivariate Decision Engine, synthesizing four distinct dimensions of market data into a single binary output. Instead of relying on raw, lagging signals, the algorithm employs a composite filtering mechanism to isolate high-probability vectors.
1. Trend Basis Cloud (Dual-Filter Smoothing)
Scientific Concept: Low-Pass Signal Filtering.
Description: The system utilizes a dual-period exponential smoothing algorithm to filter out high-frequency market noise (short-term volatility). By analyzing the divergence between the fast and slow smoothing constants, the engine establishes a Directional Bias, ensuring that all subsequent signals are aligned with the dominant low-frequency trend vector.
2. Momentum Force (Volatility-Normalized Vector)
Scientific Concept: Impulse & Magnitude.
Description: Rather than simple price change, this component calculates the "Impulse" of price action relative to its recent volatility envelope. It measures the magnitude of the breakout vector, effectively distinguishing between low-energy "drift" (chop) and high-energy "expansion" (valid trends).
3. Cycle Phase Analysis (Harmonic State Detection)
Scientific Concept: Phase Transition.
Description: Markets move in oscillatory cycles of contraction and expansion. This module detects the specific harmonic phase of the current price action. It acts as a timing gate, validating entries only during the "Early Expansion" phase and suppressing signals during "Peak Saturation" (overbought/oversold extremes), preventing late entries.
4. Volume Flow Z-Score (Statistical Anomaly Detection)
Scientific Concept: Standard Deviation & Gaussian Distribution.
Description: This filter applies statistical normalization to volume data. By calculating the Z-Score (Standard Score) of incoming volume, the system identifies statistically significant deviations from the mean (Institutional Activity) while filtering out activity that falls within standard distribution (Retail Noise).
Key Technical Features
Real-time Market Telemetry: A custom-built Institutional Terminal displays live market states (Expansion vs. Range), bias vectors, and liquidity Z-scores. Includes a responsive "Mobile Mode" for cross-device compatibility.
Variance-Based Risk Modeling: The engine automatically computes a Safety Threshold (Stop Loss) based on local volatility (ATR) and projects 7 distinct Profit Vectors based on a proprietary risk-to-reward ratio.
Modular Visual Engine: A complete toggle system allows operators to enable/disable specific data layers (Signals, Vectors, Paint Bars) to maintain a clean workspace.
State-Change Detection: The system actively monitors for "Polarity Flips" (failed setups), providing immediate visual feedback to exit or reverse positions.
Why is this Invite-Only? This script relies on a proprietary "Black Box" architecture. The specific lookback periods, smoothing constants, and Z-score thresholds have been optimized and hardcoded to ensure statistical integrity. Access is restricted to protect the intellectual property of the algorithm's internal weighting system.
Disclaimer This tool is strictly for educational and quantitative analysis purposes. Past performance is not indicative of future results. This is not financial advice.

SENTINEL CORE by Pipsomnian🛡️ Sentinel Core — Learning Mode (Structure & Probability Engine)
by Pipsomnian
Sentinel Core is the core structure and probability framework within the Sentinel ecosystem.
It is designed to help traders move beyond binary signals and learn how to grade market environments based on structure, momentum, and session quality.
This tool does not predict price.
It evaluates context.
🎯 What Sentinel Core Is
Sentinel Core is an EMA-structured learning and decision-grading indicator built to train:
• Trend alignment
• Pullback behavior
• Market structure continuation
• Session discipline (London & New York)
• Probability stacking
Instead of asking “Is there a signal?”,
Sentinel Core trains you to ask:
“How strong is this setup?”
🧠 The Scoring Concept
Each potential setup is evaluated using multiple structural components:
• EMA trend alignment
• Pullback to value
• Strong candle confirmation
• Market structure continuation
• Active trading session
The result is a setup quality grade:
• A+ → Full structural alignment
• B → Strong but incomplete alignment
Lower-quality environments are intentionally ignored.
This encourages patience, selectivity, and discipline.
🟢 Who Sentinel Core Is For
Sentinel Core is designed for traders who:
• Already understand basic EMA structure
• Want fewer, higher-quality setups
• Trade session-based markets (especially Gold)
• Value discipline over frequency
• Want to develop judgment, not dependency
🚫 What Sentinel Core Is NOT
Sentinel Core is not:
• A signal service
• An automated strategy
• A promise of profitability
• A replacement for risk management
• A shortcut to consistency
Execution, risk control, and psychology remain your responsibility.
⏱️ Recommended Use
• Timeframe: 5-Minute
• Markets: XAUUSD (Gold), major FX, liquid indices
• Sessions: London & New York
EMAs are used for structure and context, not prediction.
🧭 Position in the Sentinel Framework
• Sentinel Lite — Learn structure & discipline
• Sentinel Core — Grade probability & judgment
• Sentinel A+ — Refine timing & precision
• Sentinel Gold Standard — Execute with control
⚠️ Educational use only. No financial advice.
— Pipsomnian

Tanh Clamped Momentum Oscillator [Alpha Extract]A sophisticated momentum measurement system that combines dual EMA trend analysis with volatility-weighted pressure calculations, applying hyperbolic tangent normalization for bounded oscillator output with adaptive signal generation. Utilizing ATR-based volatility regime detection and candle pressure metrics, this indicator delivers institutional-grade momentum assessment with multi-tiered band structure and pulse-based envelope visualization. The system's tanh clamping methodology prevents extreme outliers while maintaining sensitivity to genuine momentum shifts, combined with histogram divergence detection and comprehensive alert framework for high-probability reversal and continuation signals.
🔶 Advanced Dual-Component Momentum Engine
Implements hybrid calculation combining EMA trend differential with candle pressure analysis, weighted by volatility regime assessment for context-aware momentum measurement. The system calculates fast and slow EMA difference normalized by ATR, measures intrabar pressure as close-open relative to range, applies volatility-based weighting between trend and pressure components, and produces composite raw momentum capturing both directional bias and internal candle dynamics.
// Core Momentum Framework
EMA_Fast = ta.ema(src, Fast_Length)
EMA_Slow = ta.ema(src, Slow_Length)
Trend = EMA_Fast - EMA_Slow
// Volatility Regime Detection
ATR_Short = ta.atr(ATR_Length)
ATR_Long = ta.atr(ATR_Length * 2)
Vol_Ratio = ATR_Short / ATR_Long
Vol_Weight = clamp((Vol_Ratio - 0.5) / 1.0, 0, 1)
// Pressure Component
Pressure = (close - open) / (high - low)
// Composite Momentum
Raw = Trend_Normalized * Vol_Weight + Pressure_Scaled * (1 - Vol_Weight)
🔶 Hyperbolic Tangent Normalization Framework
Features sophisticated tanh transformation that clamps raw momentum into bounded range while preserving proportional sensitivity across varying market conditions. The system applies safe exponential calculations with input capping to prevent overflow, computes hyperbolic tangent to compress extreme values while maintaining linearity near zero, and scales output by configurable factor creating oscillator with enhanced dynamic range and reduced outlier distortion.
// Tanh Clamping Logic
tanh(x) =>
x_clamped = clamp(x, -5.0, 5.0)
e = exp(2.0 * x_clamped)
(e - 1.0) / (e + 1.0)
Oscillator = tanh(Smoothed_Momentum / Clamp_Factor) * Scale
🔶 Volatility Regime Weighting System
Implements intelligent volatility assessment comparing short-term and long-term ATR to determine market regime, dynamically adjusting weight between trend and pressure components. The system calculates ATR ratio, normalizes to 0-1 range, and uses this weight factor to emphasize trend component during high-volatility regimes and pressure component during low-volatility consolidations, creating adaptive momentum sensitive to market microstructure.
🔶 Multi-Tiered Band Architecture
Provides comprehensive threshold structure with soft, hard, and maximum bands marking progressive momentum extremes for graduated overbought/oversold assessment. The system establishes configurable levels at soft zones (initial caution), hard zones (strong extreme), and maximum zones (critical overextension) with visual differentiation through line styles and background highlighting, enabling nuanced interpretation beyond binary extreme detection.
🔶 Pulse Envelope Visualization
Features dynamic envelope bands calculated from exponential moving average of absolute oscillator value, creating adaptive boundary that expands during momentum acceleration and contracts during deceleration. The system applies configurable length and width multiplier to pulse calculation, fills area between positive and negative pulse bounds with gradient coloring matching oscillator direction, providing visual context for momentum magnitude relative to recent activity.
🔶 Signal Line Integration Framework
Implements dual-mode signal line supporting both EMA and SMA smoothing of primary oscillator for crossover-based swing detection. The system calculates configurable-length moving average, generates histogram differential between oscillator and signal, applies additional smoothing to histogram for noise reduction, and uses crossovers/crossunders as momentum swing indicators distinguishing bullish and bearish momentum shifts.
🔶 Histogram Divergence Display
Creates column-style histogram visualization showing oscillator-signal differential with intensity-based coloring reflecting momentum acceleration or deceleration. The system plots histogram bars in bright colors when expanding (accelerating momentum) and faded colors when contracting (decelerating momentum), enabling instant visual identification of momentum divergences and convergences without numerical analysis.
🔶 Advanced Reversion Signal Logic
Generates overbought/oversold signals requiring both signal line crossover and extreme threshold breach for high-conviction reversal identification. The system triggers oversold when oscillator crosses above signal while below negative reversion level, triggers overbought when crossing below signal while above positive reversion level, and plots small circle markers at signal locations for clear visual confirmation of setup conditions.
🔶 Comprehensive Alert Framework
Provides six distinct alert conditions covering overbought/oversold reversions, midline trend changes, and oscillator-signal swings with configurable notification preferences. The system includes alerts for extreme reversions (OB/OS), zero-line crossovers (trend changes), and signal line crossovers (momentum swings), enabling traders to monitor critical oscillator events across multiple signal types without constant chart observation.
🔶 Adaptive Bar Coloring System
Implements four coloring modes including midline cross (trend direction), extremities (threshold breach), reversions (OB/OS signals), and slope (oscillator vs signal) for customizable visual integration. The system applies selected color scheme to candles providing chart-level momentum feedback, with option to disable coloring for minimal visual interference while maintaining oscillator pane analysis.
🔶 Performance Optimization Architecture
Utilizes efficient tanh calculation with safe clamping, streamlined EMA computations, and optimized ATR ratio processing for smooth real-time updates. The system includes intelligent null handling, minimal recalculation overhead through smart smoothing application, and configurable display toggles allowing users to disable unused visual elements for enhanced performance during extended historical analysis.
🔶 Why Choose Tanh-Clamped Momentum Oscillator ?
This indicator delivers sophisticated momentum analysis through hybrid trend-pressure calculation with volatility-adaptive weighting and hyperbolic tangent normalization. Unlike traditional momentum oscillators susceptible to extreme outlier distortion, the tanh clamping ensures bounded output while preserving sensitivity to genuine momentum shifts. The system's dual-component architecture combining directional trend with intrabar pressure, weighted by volatility regime assessment, creates context-aware momentum measurement that adapts to market microstructure. The multi-tiered band structure, pulse envelope visualization, and comprehensive signal framework make it essential for traders seeking nuanced momentum analysis with graduated extreme detection and high-probability reversal signals across cryptocurrency, forex, and equity markets.

QX Expert Imtiazz 3.0.4 ProQX Expert Imtiazz 3.0.4 Pro (qx_expert_imtiaz) is an advanced price-action–based TradingView indicator designed to identify high-probability BUY and SELL opportunities with clarity and precision.
It combines trend direction, market structure, and dynamic support & resistance logic to help traders make confident decisions in both trending and ranging markets.
The indicator plots clear BUY (green) and SELL (red) signals directly on the chart, reducing noise and eliminating guesswork. It is optimized for short-term, intraday, and scalping strategies, while still remaining effective on higher timeframes.
QX Expert Imtiazz Pro works best on Forex pairs, but it can also be applied to crypto, indices, and commodities. Its lightweight and non-repainting logic makes it suitable for real-time trading and backtesting.
🔹 Key Features
📌 Clear BUY & SELL arrow signals
📈 Trend-based confirmation logic
🔄 Works in trending & ranging markets
🕒 Suitable for scalping, intraday & swing trading
⚡️ Repainting signals (after candle close) With 90% Accuracy
🔧 Optimized for Binary & Forex, Crypto, Indices
📊 Works on multiple timeframes
🧠 Beginner-friendly & pro-level accuracy
🔹 How to Use
BUY Signal (Green Arrow): Look for long entries after candle close
SELL Signal (Red Arrow): Look for short entries after candle close
Best results when used with:
Higher timeframe trend confirmation
Proper risk management (SL & TP)
Support & resistance zones

Neeson Trend Price Oscillator Pulse EditionNeeson Trend Price Oscillator Pulse Edition: A Comprehensive Market Cycle Analysis Tool
Overview and Purpose
The Trend Price Oscillator Pulse Edition is a sophisticated technical analysis indicator designed to identify major market cycle tops and bottoms. This tool operates as a standalone oscillator in a subchart, providing clear visual signals of overbought and oversold conditions within the context of long-term market cycles. Developed for position traders and long-term investors, it focuses on capturing significant market turning points rather than short-term fluctuations.
Integration Rationale and Component Synergy
The indicator integrates three core analytical concepts into a cohesive system:
Detrended Price Oscillator (DPO) Foundation: Traditional DPO methodology isolates cyclical price movements by removing the underlying trend component. This creates a clearer view of oscillatory behavior without the distortion of long-term directional bias.
Normalization Framework: By converting raw DPO values to a standardized 0-100 scale, the indicator establishes consistent reference points for market extremes across different instruments and timeframes. This normalization enables meaningful comparison of oscillator readings regardless of absolute price levels.
Dynamic Threshold System: The implementation of adjustable threshold levels (default: 95% for overbought, 5% for oversold) creates adaptive boundaries that respond to changing market volatility and cycle characteristics.
These components work synergistically: The DPO extracts cyclical information from price action, the normalization process standardizes this information for consistent interpretation, and the threshold system provides actionable decision points based on historical extremes.
Operational Mechanism
The indicator calculates a detrended price value by comparing current price against a displaced moving average. This detrended value is then normalized against its historical range over a specified lookback period, transforming it into a percentage-based oscillator. A smoothing filter is applied to reduce noise and highlight significant movements.
The oscillator's movement through threshold zones generates four distinct market signals:
Entry into overbought territory (crossing above 95%)
Exit from overbought territory (crossing below 95%)
Entry into oversold territory (crossing below 5%)
Exit from oversold territory (crossing above 5%)
Each signal corresponds to a specific market condition hypothesis regarding institutional versus retail trader dynamics in major market cycles.
Practical Application Guidelines
Primary Use Cases:
Identification of potential major cycle turning points on weekly and monthly timeframes
Confirmation tool for existing trading strategies requiring cycle analysis
Risk management through recognition of extreme market conditions
Interpretation Framework:
Overbought Conditions (Oscillator ≥ 95%): Suggest potential selling pressure from major market participants. Consider reducing long exposure or implementing protective measures.
Oversold Conditions (Oscillator ≤ 5%): Indicate potential accumulation zones by institutional buyers. Consider establishing or adding to long positions using dollar-cost averaging strategies.
Threshold Crossings: Monitor for exits from extreme zones as potential confirmation that a cycle peak or trough may have formed.
Parameter Considerations:
Default parameters (548-period oscillator, 274-period offset, 1096-period lookback) are optimized for identifying major market cycles. Users may adjust these values for different market conditions or timeframes, though significant parameter changes will alter the indicator's sensitivity and signal frequency.
Originality and Distinctive Features
This implementation incorporates several innovative aspects:
Extended Cycle Focus: Unlike most oscillators designed for shorter timeframes, this tool employs exceptionally long calculation periods specifically for identifying primary market cycles.
Dynamic Normalization: The lookback-based normalization adapts to changing market conditions without requiring manual recalibration.
Multi-Signal Alert System: Four distinct alert conditions provide nuanced information about market state transitions rather than simple binary signals.
Integrated Risk Context: Each signal includes contextual information about potential market participant behavior, encouraging disciplined risk management.
Empirical Considerations and Limitations
The indicator provides probabilistic assessments based on historical price behavior, not predictive certainties. Market conditions may change, rendering historical patterns less reliable. Users should consider:
The indicator performs best in trending or cyclical markets; it may generate false signals during extended range-bound periods.
No technical indicator, including this one, can guarantee future market movements.
Proper position sizing and risk management should accompany all trading decisions, regardless of indicator signals.
Expected User Outcomes
When used as part of a comprehensive trading plan, this indicator can help users:
Identify potential reversal zones in major market cycles
Develop patience by focusing on significant rather than frequent trading opportunities
Maintain objective perspective during market extremes through quantitative assessment
Coordinate entry and exit timing with cycle analysis
The Trend Price Oscillator Pulse Edition represents a specialized tool for traders seeking to align their strategies with major market cycles through systematic analysis of price oscillation behavior relative to long-term trends.

Luminous Volume Flow [Pineify]Luminous Volume Flow
The Luminous Volume Flow is a specialized volume-based momentum oscillator designed to uncover the underlying buying and selling pressure within the market. Unlike traditional volume indicators that simply aggregate volume based on the close relative to the open, LVF analyzes intrabar dynamics—specifically the relationship between the close price and the high/low wicks—to estimate the dominance of buyers or sellers.
By smoothing this raw volume delta and applying a signal line, the LVF provides a clear visual representation of volume flow, helping traders identify trend strength, potential reversals, and momentum shifts with high-definition "luminous" visuals.
Key Features
Intrabar Pressure Analysis : Calculates buying and selling pressure based on wick dynamics and price polarity to provide a more granular view of market sentiment.
Multi-Type Smoothing : Offers selectable Moving Average types (SMA, EMA, RMA) for the main Flow Line to adapt to different market volatilities.
Luminous Visuals : Utilizes dynamic color gradients that brighten as momentum expands and darken as it contracts, offering immediate visual feedback on trend intensity.
Sentiment Cloud : Fills the area between the Flow and Signal lines to clearly visualize the prevailing bullish or bearish sentiment.
High-Contrast Signals : Optional high-contrast signal markers for clear crossover identification.
How It Works
The LVF operates on a multi-stage calculation process:
Pressure Calculation : The script compares the lower wick (Close - Low) against the upper wick (High - Close).
If the lower wick is longer, it suggests buying pressure (rejection of lower prices), and volume is assigned to Buy Pressure .
If the upper wick is longer, it suggests selling pressure (rejection of higher prices), and volume is assigned to Sell Pressure .
If equal, the Close > Open polarity is used as a tie-breaker.
Raw Delta : The difference between Buy and Sell Pressure is calculated to determine the net volume flow for the bar.
Flow Line : The Raw Delta is smoothed using a user-selected Moving Average (SMA, EMA, or RMA) over the Flow Length period. This creates the main oscillator line.
Signal Line : An EMA of the Flow Line is calculated to generate the Signal Line, similar to the MACD mechanic.
Histogram : The difference between the Flow Line and Signal Line determines the Histogram, which drives the "Luminous" color gradient logic.
Trading Ideas and Insights
Trend Confirmation : When the Flow Line is above the Signal Line and the Cloud is green, the bullish trend is supported by volume. Conversely, a red cloud indicates bearish volume dominance.
Momentum Crossovers : The triangle shapes indicate crossovers between the Flow and Signal lines. A triangle up (Green) suggests a potential bullish entry or invalidation of a short bias. A triangle down (Red) suggests a bearish turn.
Expansion vs. Contraction : Pay attention to the brightness of the histogram columns. Bright colors indicate expanding momentum (a strong move), while darker, fading colors suggest the move is losing steam, potentially preceding a consolidation or reversal.
How multiple components work together
This script combines the logic of Volume Delta analysis with Signal Line Crossover mechanics (popularized by MACD). By applying trend-following smoothing to raw volume data, we transform erratic volume spikes into a coherent flow. The "Luminous" visual layer is added to make the data interpretation intuitive—removing the need to mentally calculate the rate of change based on histogram height alone.
Unique Aspects
Adaptive Gradient Coloring : The histogram doesn't just show positive/negative values; it visually communicates the *acceleration* of the move via color intensity based on standard deviation.
Wick-Based Volume Attribution : Instead of a binary close-to-open comparison, LVF respects the price action within the candle (the wicks), acknowledging that a long lower wick on a red candle can actually represent significant buying interest.
How to Use
Add the indicator to your chart.
Adjust the Flow Length to match your trading timeframe (lower for scalping, higher for swing trading).
Select your preferred Smoothing Type (EMA is default and recommended for responsiveness).
Use the "Sentiment Cloud" filter: Look for long signals only when the cloud is green, and short signals when the cloud is red.
Monitor the Luminous Histogram for signs of exhaustion (colors fading) to manage exits.
Customization
Flow Length : Period for the main smoothing (Default: 14).
Signal Length : Period for the signal line (Default: 9).
Smoothing Type : Choose between SMA, EMA, or RMA.
Colors : Fully customizable colors for Bullish/Bearish phases and signals.
Chart Bars : Option to color the main chart candles based on the Flow direction.
Conclusion
The Luminous Volume Flow is a robust tool for traders who want to go beyond price action and understand the volume dynamics driving the market. By visualizing the flow of buying and selling pressure with advanced smoothing and reactive visuals, it provides a clearer picture of market sentiment than standard volume bars.

Volume Oracle - Regime DetectionVolume Oracle - Regime Detection
Volume Oracle transforms raw volume data into a regime-based flow analysis framework. The indicator is designed to help traders identify periods of accumulation and distribution through five integrated analytical layers: regime detection, market structure validation, volume footprint analysis, quality scoring, and multi-timeframe confluence.
━━━━━━━━━━━━━━━━━━━━━━━━━━━━━━━━━━━━
🔶 𝗢𝗩𝗘𝗥𝗩𝗜𝗘𝗪
Volume analysis has long been considered a window into market participant activity. Large players cannot move size without leaving footprints in the volume record. Traditional volume indicators show raw numbers, but interpreting whether elevated volume represents accumulation or distribution requires additional context.
Volume Oracle builds on this foundation by adding five analytical layers:
• Regime Detection: Classifies the current market state as Accumulation (buying pressure), Distribution (selling pressure), or Neutral (no clear direction) using a composite scoring system that weighs price velocity, trend alignment, and volume-weighted flow.
• Market Structure Validation: Tracks swing highs and lows to determine if price structure (higher highs/higher lows vs lower highs/lower lows) agrees with the detected regime.
• Volume Footprint Analysis: Classifies volume spikes as either Momentum bars (large body, small wicks indicating directional conviction) or Absorption bars (small body, large wicks indicating supply/demand absorption).
• Quality Scoring System: Rates each signal from 0-100% based on multiple confluence factors, displayed as star ratings for quick visual assessment.
• Multi-Timeframe Confluence: Optional higher timeframe filters that require regime alignment across multiple timeframes before generating signals.
The indicator adapts all parameters automatically based on the chart timeframe, with different settings optimized for scalping, intraday, swing, and position trading styles.
━━━━━━━━━━━━━━━━━━━━━━━━━━━━━━━━━━━━
🔶 𝗛𝗢𝗪 𝗜𝗧 𝗪𝗢𝗥𝗞𝗦
The indicator is built around one core principle: market participant activity may reveal itself through the relationship between volume, price movement, and market structure.
𝗥𝗲𝗴𝗶𝗺𝗲 𝗗𝗲𝘁𝗲𝗰𝘁𝗶𝗼𝗻 𝗦𝘆𝘀𝘁𝗲𝗺
What it does: The regime engine calculates a composite score using four weighted components: recent price velocity (where price is heading now versus recent history), trend alignment (EMA stacking and price position relative to moving averages), volume-weighted flow (proportion of volume occurring on up-closes versus down-closes), and volume confirmation (whether current volume exceeds average). The score passes through an EMA smoothing filter and must exceed configurable thresholds for multiple consecutive bars before a regime change is confirmed.
How to interpret it: When the indicator shows Accumulation, this suggests buying pressure currently dominates. Distribution suggests selling pressure dominates. Neutral indicates no clear directional bias. The regime state colors the volume bars: green tints during accumulation, red tints during distribution, gray during neutral periods. A subtle background shade reinforces the current regime.
𝗠𝗮𝗿𝗸𝗲𝘁 𝗦𝘁𝗿𝘂𝗰𝘁𝘂𝗿𝗲 𝗩𝗮𝗹𝗶𝗱𝗮𝘁𝗶𝗼𝗻
What it does: The indicator tracks recent swing highs and swing lows using pivot detection. It compares the most recent swing points to previous ones to determine if price is making higher highs and higher lows (bullish structure), lower highs and lower lows (bearish structure), or mixed patterns.
How to interpret it: When structure aligns with regime (bullish structure during accumulation, bearish structure during distribution), the regime table displays a checkmark. When structure conflicts with regime, this may suggest the regime is losing conviction. Structure validation appears in the regime table and factors into signal quality scores.
𝗩𝗼𝗹𝘂𝗺𝗲 𝗙𝗼𝗼𝘁𝗽𝗿𝗶𝗻𝘁 𝗔𝗻𝗮𝗹𝘆𝘀𝗶𝘀
What it does: On volume spike bars, the indicator analyzes the candle structure. Momentum bars have large bodies relative to their range (directional conviction). Absorption bars have small bodies with large wicks (supply or demand being absorbed without moving price significantly).
How to interpret it: Momentum bars during a trend may suggest strong directional conviction pushing price. Absorption bars may suggest supply or demand being absorbed at support or resistance without significant price movement. Footprint type factors into signal quality and triggers dedicated alerts.
𝗤𝘂𝗮𝗹𝗶𝘁𝘆 𝗦𝗰𝗼𝗿𝗶𝗻𝗴 𝗦𝘆𝘀𝘁𝗲𝗺
What it does: Each signal receives a quality score from 0-100% based on multiple factors: volume spike strength, flow direction conviction, trend alignment, regime strength, regime freshness, squeeze proximity, HTF alignment (if enabled), momentum acceleration, structure agreement, footprint type, market character (trending vs choppy), and confluence count. High signal density (many signals in a short period) reduces quality scores.
How to interpret it: Signals display star ratings: three stars for scores above 85%, two stars for 75-84%, one star for 65-74%, and no stars below 65%. A target emoji appears when five or more confluence factors align. Higher quality scores suggest more factors agreeing, though this does not guarantee outcomes.
𝗠𝘂𝗹𝘁𝗶-𝗧𝗶𝗺𝗲𝗳𝗿𝗮𝗺𝗲 𝗖𝗼𝗻𝗳𝗹𝘂𝗲𝗻𝗰𝗲
What it does: When enabled, the indicator fetches data from one or two higher timeframes and calculates simplified regime scores for each. It checks whether HTF regimes match the current timeframe regime, whether HTF strength exceeds a minimum threshold, and whether HTF regimes are strengthening rather than weakening.
How to interpret it: When all HTF conditions align, signals display an additional emoji indicator. In strict mode, signals only appear when HTF agrees. The HTF table shows regime state, strength percentage, trend direction, and alignment status for each configured timeframe.
━━━━━━━━━━━━━━━━━━━━━━━━━━━━━━━━━━━━
🔶 𝗪𝗛𝗬 𝗧𝗛𝗘𝗦𝗘 𝗖𝗢𝗠𝗣𝗢𝗡𝗘𝗡𝗧𝗦 𝗪𝗢𝗥𝗞 𝗧𝗢𝗚𝗘𝗧𝗛𝗘𝗥
Each layer addresses a different aspect of market analysis:
1. Regime Detection: Establishes the directional bias using volume-weighted evidence.
2. Structure Validation: Confirms whether price action supports the detected regime.
3. Footprint Analysis: Characterizes the nature of volume activity on spikes.
4. Quality Scoring: Synthesizes all factors into a single actionable metric.
5. Multi-Timeframe Filter: Reduces noise by requiring agreement across timeframes.
When multiple factors align (strong regime, confirming structure, momentum footprint, high quality score, HTF agreement), this represents maximum confluence. Such conditions may warrant closer examination, though they do not guarantee any particular outcome.
━━━━━━━━━━━━━━━━━━━━━━━━━━━━━━━━━━━━
🔶 𝗛𝗢𝗪 𝗧𝗢 𝗨𝗦𝗘
This section provides step-by-step guidance for interpreting the indicator's visual elements.
𝗦𝘁𝗲𝗽 𝟭: 𝗜𝗱𝗲𝗻𝘁𝗶𝗳𝘆 𝘁𝗵𝗲 𝗖𝘂𝗿𝗿𝗲𝗻𝘁 𝗥𝗲𝗴𝗶𝗺𝗲
Look at the regime table in the corner of the chart. The top row shows the current regime state: ACCUMULATION, DISTRIBUTION, or NEUTRAL. The color matches the regime (green, red, or gray).
• Volume bars tinted green suggest accumulation regime
• Volume bars tinted red suggest distribution regime
• Volume bars gray indicate neutral regime
The regime provides context for all other readings. Trading with the regime (buying during accumulation, selling during distribution) aligns with the detected flow direction.
𝗦𝘁𝗲𝗽 𝟮: 𝗔𝘀𝘀𝗲𝘀𝘀 𝗥𝗲𝗴𝗶𝗺𝗲 𝗛𝗲𝗮𝗹𝘁𝗵
The regime table displays multiple health indicators:
• Strength percentage: Higher values suggest stronger conviction
• Status: STRONG, FADING, WEAKENING, or CRITICAL
• Health: Composite warning indicator (HEALTHY, WATCH, CAUTION, DANGER)
• Structure: Whether price structure agrees with regime
• Market: Whether conditions are TRENDING, NORMAL, or CHOPPY
• Flip: Whether a regime change is building
When status shows FADING or worse, the regime may be losing conviction. Yellow-tinted volume bars appear after three consecutive bars of weakening status, providing early warning of potential regime changes.
𝗦𝘁𝗲𝗽 𝟯: 𝗪𝗮𝘁𝗰𝗵 𝗳𝗼𝗿 𝗦𝗶𝗴𝗻𝗮𝗹𝘀
Bullish signals appear as green labels with an up arrow above volume spikes during accumulation. Bearish signals appear as red labels with a down arrow during distribution. Labels include:
• Star ratings indicating quality (more stars suggest more confluence)
• Target emoji when five or more factors align
• HTF emoji when higher timeframe agrees
Hover over any signal label to see detailed tooltip information including quality percentage, risk levels, position sizing suggestions, and specific confluence factors present.
𝗦𝘁𝗲𝗽 𝟰: 𝗖𝗵𝗲𝗰𝗸 𝗛𝗧𝗙 𝗔𝗹𝗶𝗴𝗻𝗺𝗲𝗻𝘁 (𝗜𝗳 𝗘𝗻𝗮𝗯𝗹𝗲𝗱)
When multi-timeframe filtering is enabled, a second table appears showing HTF regime states. Green checkmarks indicate alignment, red X marks indicate disagreement. For maximum confluence, all timeframes should agree on regime direction.
𝗦𝘁𝗲𝗽 𝟱: 𝗠𝗼𝗻𝗶𝘁𝗼𝗿 𝗘𝘅𝗶𝘁 𝗪𝗮𝗿𝗻𝗶𝗻𝗴𝘀
Yellow warning labels appear when exit conditions trigger: regime flips, flow reversals, critical weakness, time-based exits, or target hits. These suggest reviewing open positions. The tooltip explains the specific exit reason.
𝗦𝘁𝗲𝗽 𝟲: 𝗖𝗼𝗺𝗯𝗶𝗻𝗲 𝗠𝘂𝗹𝘁𝗶𝗽𝗹𝗲 𝗙𝗮𝗰𝘁𝗼𝗿𝘀
The indicator provides the most context when multiple elements align:
𝘌𝘹𝘢𝘮𝘱𝘭𝘦 𝘚𝘤𝘦𝘯𝘢𝘳𝘪𝘰 𝘈 (𝘛𝘳𝘦𝘯𝘥 𝘊𝘰𝘯𝘵𝘪𝘯𝘶𝘢𝘵𝘪𝘰𝘯): Regime shows ACCUMULATION at 72% strength with STRONG status. Structure displays checkmark (HH/HL confirmed). Market character shows TRENDING. A volume spike triggers a bullish signal with two stars and HTF alignment. Multiple factors agreeing during an established regime suggests trend may continue, though no outcome is guaranteed.
𝘌𝘹𝘢𝘮𝘱𝘭𝘦 𝘚𝘤𝘦𝘯𝘢𝘳𝘪𝘰 𝘉 (𝘔𝘰𝘮𝘦𝘯𝘵𝘶𝘮 𝘍𝘢𝘥𝘪𝘯𝘨): Regime shows DISTRIBUTION but status has shifted to FADING. Strength dropped from 65% to 48% over recent bars. Structure shows conflict (regime bearish but structure making higher lows). Volume bars have turned yellow. This type of internal disagreement often appears before regime changes or consolidation periods.
𝘌𝘹𝘢𝘮𝘱𝘭𝘦 𝘚𝘤𝘦𝘯𝘢𝘳𝘪𝘰 𝘊 (𝘌𝘹𝘩𝘢𝘶𝘴𝘵𝘪𝘰𝘯 𝘞𝘢𝘳𝘯𝘪𝘯𝘨): After an extended rally, regime shows ACCUMULATION but status reads CRITICAL. Health indicator shows CAUTION with two warnings active. An absorption bar appears (volume spike with small body and large upper wick). The Flip row shows regime change building. None of this guarantees reversal, but multiple warning signs appearing together suggest caution.
𝘌𝘹𝘢𝘮𝘱𝘭𝘦 𝘚𝘤𝘦𝘯𝘢𝘳𝘪𝘰 𝘋 (𝘉𝘳𝘦𝘢𝘬𝘰𝘶𝘵 𝘍𝘳𝘰𝘮 𝘊𝘰𝘯𝘴𝘰𝘭𝘪𝘥𝘢𝘵𝘪𝘰𝘯): Regime has shown NEUTRAL for several sessions with volume bars gray and muted. Market character displays CHOPPY. Then a volume spike triggers with regime flipping to ACCUMULATION, confirmed by structure shift to HH/HL. A three-star signal appears with target emoji. When multiple elements shift together after a quiet period, consolidation may be resolving into a directional move.
━━━━━━━━━━━━━━━━━━━━━━━━━━━━━━━━━━━━
🔶 𝗡𝗔𝗩𝗜𝗚𝗔𝗧𝗜𝗡𝗚 𝗗𝗜𝗙𝗙𝗘𝗥𝗘𝗡𝗧 𝗠𝗔𝗥𝗞𝗘𝗧 𝗖𝗢𝗡𝗗𝗜𝗧𝗜𝗢𝗡𝗦
𝗧𝗿𝗲𝗻𝗱𝗶𝗻𝗴 𝗠𝗮𝗿𝗸𝗲𝘁𝘀
During sustained trends, the indicator typically shows persistent regime state (accumulation in uptrends, distribution in downtrends) with STRONG status and TRENDING market character. Structure should confirm with appropriate swing point patterns. Signals receive quality bonuses during trending conditions. Focus on signals that align with the established regime rather than counter-trend setups. The regime strength percentage and status provide ongoing confirmation that the trend remains healthy.
𝗥𝗮𝗻𝗴𝗶𝗻𝗴 𝗠𝗮𝗿𝗸𝗲𝘁𝘀
During consolidation, expect frequent regime shifts between accumulation, distribution, and neutral. Market character will display CHOPPY, and quality scores receive penalties. Structure may show mixed readings. Signal frequency increases but quality decreases. Consider using stricter filtering (higher volume threshold, HTF requirement) or waiting for regime stability before acting. The stability index in the regime table tracks flip frequency to help identify choppy conditions.
𝗛𝗶𝗴𝗵 𝗩𝗼𝗹𝗮𝘁𝗶𝗹𝗶𝘁𝘆 𝗘𝘃𝗲𝗻𝘁𝘀
During news events or volatility spikes, the auto-adapt feature adjusts thresholds based on ATR readings. Higher volatility raises the bar for regime changes, reducing whipsaws. Volume spikes during high volatility require greater statistical significance. The regime table tooltip shows current adaptive settings for transparency. Signals during extreme volatility should be interpreted with additional caution.
━━━━━━━━━━━━━━━━━━━━━━━━━━━━━━━━━━━━
🔶 𝗧𝗘𝗖𝗛𝗡𝗜𝗖𝗔𝗟 𝗗𝗘𝗧𝗔𝗜𝗟𝗦
• Volume spike detection uses z-score normalization against a lookback window
• Regime scoring combines velocity, trend, flow, and volume components with configurable weights
• Regime changes require multi-bar confirmation above thresholds
• Structure detection uses pivot-based swing point identification
• Footprint classification analyzes body-to-range ratio and wick proportions
• Quality scoring aggregates multiple factors with caps and multipliers
• HTF data uses request.security with lookahead disabled (non-repainting)
• All signals fire on bar close only (non-repainting architecture)
• Parameters adapt automatically based on timeframe category
━━━━━━━━━━━━━━━━━━━━━━━━━━━━━━━━━━━━
🔶 𝗨𝗡𝗜𝗤𝗨𝗘 𝗙𝗘𝗔𝗧𝗨𝗥𝗘𝗦
• Timeframe Adaptive: All parameters (lookbacks, thresholds, confirmations) automatically scale based on whether the chart shows scalp, intraday, swing, or position timeframes.
• Multi-Layer Warning System: Four warning levels (STRONG, FADING, WEAKENING, CRITICAL) provide graduated alerts as regimes deteriorate, rather than binary flip signals.
• Structure-Regime Validation: Cross-references detected regime against actual price structure (swing highs/lows) to identify potential divergences.
• Volume Footprint Classification: Distinguishes between momentum-driven volume spikes and absorption patterns that may indicate different market participant behavior.
• Quality-Based Position Sizing: Suggested position sizes scale based on signal quality, with higher confluence signals receiving larger size recommendations.
• Non-Repainting Architecture: All calculations use confirmed bar data only. Historical display matches real-time behavior exactly.
━━━━━━━━━━━━━━━━━━━━━━━━━━━━━━━━━━━━
🔶 𝗦𝗘𝗧𝗧𝗜𝗡𝗚𝗦 𝗢𝗩𝗘𝗥𝗩𝗜𝗘𝗪
• Detection: Volume spike threshold, signal cooldown, regime sensitivity mode, auto-adapt toggle, warning display toggle
• Risk: Account size, risk percentage, ATR length, stop/target multipliers, partial exit percentage, trailing stop and breakeven settings
• Multi-Timeframe: HTF enable toggles, timeframe selections, strict mode, minimum HTF strength threshold
• Strategy: Trading mode selection (Trend Following, Mean Reversion, or Hybrid), mean reversion threshold
• Display: Toggles for regime table, background colors, exit warnings, quality stars, management labels, tooltips, and HTF table
• Table Style: Layout orientation, table positions, text sizes, border and frame widths
━━━━━━━━━━━━━━━━━━━━━━━━━━━━━━━━━━━━
🔶 𝗔𝗟𝗘𝗥𝗧𝗦
25 alert conditions available:
• Bull Signal / Bear Signal / Any Signal: Core directional signals with quality and position details
• Target 1 Hit / Breakeven: Position management milestones
• Exit Warning: Triggered when exit conditions appear
• Regime to Accumulation / Distribution / Neutral: Individual regime change alerts
• Any Regime Change: Fires on any regime transition
• Regime Weakening: Early warning of deteriorating regime
• Momentum Fading / Flow Deteriorating / Volume Drying: Leading exit indicators
• Multiple Warnings: Fires when two or more warning conditions active
• HTF Aligned / HTF Broke: Multi-timeframe alignment changes
• Structure Bullish / Structure Bearish: Price structure shifts
• Structure Conflict: When structure disagrees with regime
• Momentum Footprint / Absorption Footprint: Volume footprint detection
• Market Trending / Market Choppy: Market character changes
• High Confluence Signal: Signals with five or more factors aligned
━━━━━━━━━━━━━━━━━━━━━━━━━━━━━━━━━━━━
🔶 𝗟𝗜𝗠𝗜𝗧𝗔𝗧𝗜𝗢𝗡𝗦
• Requires Volume Data: Instruments without reliable volume data (some forex pairs, indices) will produce unreliable readings.
• Analysis Tool, Not Signal Generator: This indicator identifies conditions that may warrant attention. It does not provide entry/exit instructions and should not be followed mechanically.
• Lagging Component: Regime detection requires confirmation bars, introducing necessary lag. Fast reversals may not be captured in time.
• No Guarantee of Outcomes: High quality scores and multiple confluence factors improve context but do not predict results. Markets can move against any setup.
• HTF Limitations: Higher timeframe data updates on HTF bar closes, not continuously. Brief alignment windows may be missed.
━━━━━━━━━━━━━━━━━━━━━━━━━━━━━━━━━━━━
🔶 𝗖𝗢𝗡𝗖𝗟𝗨𝗦𝗜𝗢𝗡
Volume Oracle provides a structured framework for analyzing volume flow through regime detection, structure validation, footprint classification, quality scoring, and multi-timeframe confluence. The indicator is designed to help traders identify accumulation and distribution phases and assess the conviction behind detected regimes. Multiple warning systems provide early indication when regimes may be losing strength.
━━━━━━━━━━━━━━━━━━━━━━━━━━━━━━━━━━━━
🔶 𝗗𝗜𝗦𝗖𝗟𝗔𝗜𝗠𝗘𝗥
Trading is risky and most traders lose money. This indicator is provided for informational and educational purposes only. It does not constitute financial advice, and past performance does not guarantee future results. All content, tools, and analysis should not be considered as recommendations to buy or sell any asset. Users are solely responsible for their own trading decisions. Always use proper risk management and consider consulting a qualified financial advisor before making trading decisions.
━━━━━━━━━━━━━━━━━━━━━━━━━━━━━━━━━━━━
Built with PineScript v6. Non-repainting. All signals confirmed on bar close.

Neeson Vegas ChannelVegas Channel Indicator: A Comprehensive Multi-Timeframe Trend-Following System
Originality and Conceptual Foundation
This script implements an enhanced version of the classic "Vegas Tunnel" or "Vegas Channel" methodology, popularized by traders who follow the work associated with the "Vegas" technique. Its primary original contribution lies in its specific, rule-based multi-layered trend identification and visualization system. While the core uses well-known Exponential Moving Averages (EMAs), the originality is in the precise combination of periods and the strict, hierarchical logic for defining trend states and generating signals.
Unlike simpler moving average crossovers or single-tunnel systems, this script employs three distinct EMA pairs, each serving a unique purpose within the trend hierarchy:
Short-Term Momentum Pair (EMA 12 & 24): Acts as the primary signal trigger and momentum gauge.
Core Trend Tunnel (EMA 144 & 169): Serves as the central "channel" or "tunnel." A key visual and logical component is the shading between these two lines, which thickens and changes color with the trend, creating a dynamic channel.
Long-Term Foundation Pair (EMA 580 & 670): Represents the underlying, slower-moving trend foundation, providing context for the higher-timeframe bias.
The system's true innovation is its binary and exclusive trend definition logic. It does not rely on a single crossover. Instead, it defines a confirmed Uptrend only when both the short-term EMAs (12 and 24) are established above both lines of the core tunnel (144 and 169). Conversely, a Downtrend is confirmed only when both short-term EMAs are established below both core tunnel lines. This creates a high-confidence filter, reducing whipsaw signals that can occur when price oscillates around a single moving average.
Functionality, Implementation, and Usage
What It Does:
This indicator is a multi-timeframe trend identification and signal-generation tool. It visually condenses trend information from short, medium, and long-term perspectives onto a single chart. Its primary functions are:
Trend State Classification: It dynamically classifies the market into one of three states: Bull Trend (Blue), Bear Trend (Orange), or Sideways/Congestion (Gray). This is reflected in the chart's background color, the color of all EMA lines, and the fill of the central 144/169 channel.
Signal Generation: It plots discrete buy and sell arrows. A Buy Signal (blue upward triangle) appears the first bar the market transitions into the defined "Uptrend" state from a non-uptrend state. A Sell Signal (orange downward triangle) appears the first bar the market transitions into the defined "Downtrend" state.
Visual Structuring: It plots all six EMAs and prominently highlights the interaction zone between the 144 and 169 EMAs with a colored fill, making the "tunnel" a focal point for support/resistance and trend quality assessment.
How It's Implemented:
The logic is implemented through a clear sequence of conditional checks:
Calculation: All six EMAs are calculated based on user-definable periods (defaults as listed).
Trend Logic: The script continuously evaluates the position of EMA12 and EMA24 relative to EMA144 and EMA169 using strict AND conditions to define the uptrend and downtrend Boolean variables.
Signal Logic: A signal (buy or sell) is generated only on the change of the trend state. It uses a check of the form current_trend_state AND (NOT previous_bar_trend_state) to pinpoint the exact bar of transition.
Visual Feedback: All plot colors, the channel fill color, and the background color are unified and determined by the current trend state variable. Labels for the trend and each EMA line are drawn on the last bar for clarity.
How to Use It:
Traders employ this indicator primarily for trend-following and breakout confirmation. It is suited for swing trading or higher-timeframe positional trades rather than scalping, due to the lag inherent in its longer EMAs and its focus on confirmed states.
Trend Bias: The overall color scheme (blue/orange/gray background) provides an immediate, at-a-glance assessment of the dominant trend force. Trading in the direction of the colored background is considered aligned with the system's trend.
Signal Entry: The arrow signals are not meant for blind entry. They mark the point of a confirmed trend state transition.
A Buy Signal suggests the short-term momentum (12,24) has decisively broken above and established itself over the medium-term trend framework (144,169). This could be used as a trigger for long entries, preferably with the long-term EMAs (580,670) sloping upwards or flat, adding confluence.
A Sell Signal suggests the opposite breakdown.
Channel as Dynamic S/R: The filled area between EMA144 and EMA169 acts as a dynamic support zone in an uptrend and a resistance zone in a downtrend. Pullbacks into this "tunnel" that hold without triggering a sell signal (i.e., without both EMA12 & 24 closing back below both tunnel lines) can be viewed as potential continuation opportunities.
Filter for Other Systems: The clear trend state (uptrend/downtrend) can be exported or used as a filter for other trading systems or discretionary decisions, ensuring actions are only taken in the direction of the script's defined trend.
Core Computational Philosophy and Strategic Rationale
The script's logic is rooted in the philosophy of trend hierarchy and confirmation. It belongs to the category of Multi-Moving Average Convergence/Divergence Systems with State-Based Rules.
The 144/169 Tunnel: These numbers are derived from Fibonacci sequences (144, 169 is 12^2 and 13^2). They are believed by proponents to represent a natural rhythm or "heartbeat" of the market, defining a robust intermediate-term trend framework.
The 12/24 Pair: A standard fast-moving average pair commonly used to gauge short-term momentum and trigger entries.
The Strategic Innovation (Dual-Condition Crossover): The core idea is that a crossover of a single fast MA above a single slow MA can be false and noisy. By requiring both members of a fast pair to establish position relative to both members of a slower "tunnel" pair, the system demands a broader, more concerted move. This seeks to filter out weak, unsustainable breaks and only capture shifts in momentum strong enough to flip the entire short-term structure's position relative to the medium-term structure.
The 580/670 Pair: These very slow EMAs represent the "secular" trend. While not part of the direct signal logic, they provide critical context. A buy signal that occurs while price is above the 580/670 pair (which would be sloping up in a healthy bull market) carries more weight than one that occurs while price is below this long-term foundation, which might indicate a counter-trend rally.
In essence, this script is more than just moving averages on a chart. It is a systematic, rule-based framework for identifying when the market's short-term energy (12,24) has converged sufficiently to overcome and reposition itself against its medium-term equilibrium (144/169 tunnel), thereby signaling a high-probability phase change in trend, all while considering the backdrop of a long-term trend (580/670).

GB-FVG by AlgoKingsGB-FVG by AlgoKings
RISK DISCLAIMER: This indicator is an analytical tool for educational purposes only, not financial advice. Trading carries substantial risk of loss. This tool does not guarantee profitable trades. Always use proper risk management and never risk more than you can afford to lose.
WHAT IS GB-FVG?
GB-FVG identifies Fair Value Gaps that form during Goldbach mathematical time windows. Unlike standard FVG indicators that display all price imbalances, this tool filters for gaps created at specific time harmonics based on Goldbach number theory, highlighting institutional order flow events that occur during mathematically significant moments.
Example: At 11:35 (minute=35, hour=11, sum=46, difference=24), if minute matches Goldbach number 35 AND a three-candle gap forms, the indicator displays this FVG. Standard gaps forming at non-Goldbach times are ignored.
UNDERLYING METHODOLOGY
This indicator combines three analytical layers:
1. THREE-CANDLE FVG DETECTION
Identifies price imbalances using precise gap analysis:
BULLISH FVG:
Candle 3 (two bars back) high < Candle 1 (current) low = Gap between bars that price never traded
BEARISH FVG:
Candle 3 (two bars back) low > Candle 1 (current) high = Gap between bars that price never traded
Technical implementation:
- Uses request.security with lookahead_on to access confirmed bar data (high , low , high , low )
- For bullish FVG: Gap top = low , Gap bottom = high
- For bearish FVG: Gap top = low , Gap bottom = high
- Detects new FVGs when time exceeds previous time (new bar completed on indicator timeframe)
Bar array management:
Maintains rolling array of 10 most recent bars from indicator timeframe. On each security.isNew event, unshifts new bar and pops oldest. Enables lookback for three-bar pattern comparison without repeated security calls.
Higher timeframe precision:
When indicator timeframe exceeds chart timeframe (e.g., 1H FVG on 5m chart), hCtf and lCtf methods search backward through chart bars to find exact bar that created gap extreme, providing precise visual placement.
2. GOLDBACH TIME FILTERING
Only displays FVGs that form during Goldbach number time windows:
GOLDBACH NUMBER SET:
Master list of 23 key numbers: 0, 3, 11, 17, 29, 41, 47, 53, 59, 71, 83, 89, 97, 100, 7, 14, 23, 35, 44, 50, 56, 65, 77
These numbers represent temporal harmonics derived from number theory. Users can select all numbers or specify custom subset.
TIME COMPONENT CALCULATION:
For middle bar of three-candle pattern (bar that created the gap), algorithm extracts four components in selected timezone:
- Minute (m): Minute of hour (0-59)
- Hour (h): Hour of day (0-23)
- Sum (h + m): Addition of hour and minute
- Difference (|h - m|): Absolute difference between hour and minute
MATCHING LOGIC:
FVG only drawn if middle bar timestamp matches ANY Goldbach number ±1:
if (m == n) or (h == n) or (h+m == n) or (|h-m| == n)
→ Exact match, FVG qualifies
if (m == n±1) or (h == n±1) or (h+m == n±1) or (|h-m| == n±1)
→ Near match, FVG qualifies
Example: At 14:35, if user selected Goldbach 35:
- m = 35 → Exact match → FVG qualifies
- Gap drawn with label "35"
Filter effectiveness:
Standard FVG indicator might show 50+ gaps on 5m chart. GB-FVG shows only 5-10 gaps that align with Goldbach timing, reducing noise and highlighting mathematically significant imbalances.
3. MITIGATION TRACKING
Monitors gap fill status with body-based or wick-based options:
MITIGATION TYPES:
- Body Close: FVG considered filled when candle closes inside gap
- Wick Touch: FVG extends until touched (when "Mitigate on body close" disabled)
STATE MANAGEMENT:
- Active: Gap unfilled, box extends to future (x2 = time + offset)
- Mitigated: Price closed inside gap, box stops at mitigation bar
Progressive tracking:
On each new bar from indicator timeframe, if "Mitigate on body close" enabled:
- Bullish FVG: if close <= gap.bottom, set isMit=true, x2=time
- Bearish FVG: if close >= gap.top, set isMit=true, x2=time
Visual consequences:
Active FVGs extend dynamically to future bars. Mitigated FVGs freeze at mitigation point. Unlike standard FVG indicators that show partial fills, GB-FVG uses binary state (active/mitigated).
WHY CLOSED-SOURCE?
This script protects proprietary algorithms:
- Goldbach filtering integration: Combines gbMatches() function with FVG detection, testing middle bar timestamp (s2.t) against user-selected Goldbach array, only creating Fvg object when matches found
- Multi-timeframe precision: hCtf and lCtf methods that search through chart bars using offset calculations (ctfBarCount * idx) and mintick rounding to locate exact bar that created higher timeframe gap extreme
- Bar array synchronization: Security object maintains rolling 10-bar array with isNew flag coordination, preventing duplicate processing while enabling three-bar lookback without repeated security calls
- Time component matching: gbMatch function implementing four-component test (m, h, h+m, |h-m|) with ±1 tolerance against each Goldbach number, returning match status and exact/approximate classification
- Mitigation state machine: isMit flag with body-close detection (close <= l for bullish, close >= h for bearish) that freezes box extension (x2) at mitigation timestamp rather than current time
Standard FVG indicators show all gaps. GB-FVG adds Goldbach timing layer requiring complex timestamp extraction, component arithmetic, and match filtering before gap visualization.
TECHNICAL COMPONENTS
Core structures:
- Bar Object: Stores OHLC and timestamp for single bar from indicator timeframe
- Security Object: Manages request.security calls, maintains Bar array (size=10), tracks isNew flag, provides hCtf/lCtf precision methods
- Fvg Object: Contains gap coordinates (x, h, x2, l), Goldbach numbers text, isMit state, box drawing object
- Option Object: Centralized settings for timezone, Goldbach array, history, colors, mitigation type
Goldbach matching:
- gbMatch(n, t, timezone): Tests single Goldbach number against single timestamp's four components with ±1 tolerance
- gbMatches(nArray, t, timezone): Tests array of Goldbach numbers against timestamp, returns arrays
FVG detection:
- Bullish: if (s3.h < s1.l and gbMatches(array, s2.t) has matches) create FVG
- Bearish: if (s3.l > s1.h and gbMatches(array, s2.t) has matches) create FVG
- Label: Goldbach numbers joined with commas (e.g., "23,35,65")
Mitigation:
- if (sBodyMit and close inside gap) set isMit=true, x2=close_time
- if (not sBodyMit) always extend to future: x2 = time("", bars_back = -4)
HOW TO USE
Setup:
1. Apply to any chart (works on all symbols and timeframes)
2. Select FVG Timeframe (must be >= chart timeframe)
3. Choose Timezone (New York or Zurich) for Goldbach calculation
4. Select "All GB/CE" to use all 23 numbers, or enter custom list
5. Enter custom numbers as comma-separated values (e.g., "23,35,65,77")
6. Enable/disable "Mitigate on body close" for mitigation behavior
Chart Timeframe Requirements:
Chart timeframe must be equal to or lower than FVG Timeframe setting. For 1H FVG analysis, use 1H or lower chart (5m, 15m, 30m, 1H all valid). Cannot use 4H chart for 1H FVG.
Interpretation:
- Green box = Bullish FVG at Goldbach time (gap up, unfilled)
- Red box = Bearish FVG at Goldbach time (gap down, unfilled)
- Numbers in box = Goldbach numbers that matched middle bar timestamp
- Box extends right = Active FVG (not yet mitigated)
- Box stops = Mitigated FVG (price closed inside gap)
- Multiple numbers = Multiple time components aligned with different Goldbach numbers
Visual placement:
Box spans from gap bottom to gap top vertically. Horizontally spans from gap formation bar to current time (active) or mitigation bar (filled). Numbers display at right edge of box.
SETTINGS EXPLAINED
Settings:
- Timeframe: Select FVG detection timeframe (any timeframe >= chart TF valid)
- Timezone: Choose New York or Zurich for Goldbach time component calculation
- All GB/CE: Enable to use all 23 master Goldbach numbers
- GB/CE List: Disable "All GB/CE" to enter custom comma-separated list (e.g., "23,35,65,77")
- History: Number of FVGs to display (default: 9)
- Text Size: Label text size for Goldbach numbers (Auto, Tiny, Small, Normal, Large)
- Text: Text color for Goldbach number labels
- Up: Box color for bullish FVGs
- Down: Box color for bearish FVGs
- Mitigate on body close: Enable to stop box extension when price closes inside gap, disable to extend until current time
Timeframe selection:
Must select timeframe equal to or higher than chart. Examples:
- Chart 5m, FVG 15m = Valid
- Chart 5m, FVG 1H = Valid
- Chart 1H, FVG 15m = Invalid (error message shown)
Timezone selection:
New York (America/New_York) = EST/EDT timezone
Zurich (Europe/Zurich) = CET/CEST timezone
Chart display timezone does not affect Goldbach calculations. You can view charts in Tokyo time while calculating Goldbach numbers in New York time.
Custom number selection:
Enter numbers separated by commas with no spaces: 23,35,65,77
Invalid numbers (not in master list of 23) automatically filtered out
Minimum: 1 number (or enable "All GB/CE")
Maximum: all 23 numbers
Mitigation behavior:
- Enabled: Boxes stop extending when price closes inside gap (recommended for cleaner chart)
- Disabled: Boxes extend to current time regardless of fills (shows all historical gaps)
UPDATES
This script is actively maintained. Updates released through TradingView's native update system. For technical questions, use the comment section below.

Squeeze + Vol + Turbo + Slingshot + Breakout (Bottom Banners)DRW Turbo Banner — Volatility Expansion & Regime Shift Tool
Purpose & Originality
The Turbo Banner is a volatility-regime transition tool, not a momentum oscillator and not a signal generator by itself.
Its purpose is to help traders identify when the market shifts from compression / pause into true expansion, reducing false breakouts and chop trades.
Unlike standard ATR or volatility indicators that react late or fire constantly, this script focuses on context first, confirmation second.
---
What the Script Does (High-Level)
The Turbo Banner evaluates bar-by-bar volatility behavior relative to a smoothed baseline and displays a concise banner when expansion conditions are met.
At a high level, it monitors:
True Range vs ATR
Expansion is defined when real-time range meaningfully exceeds recent volatility norms.
Directional Bias (optional structure filter)
Direction can be confirmed using candle structure to avoid random spikes.
Streak Logic
Single volatility spikes are filtered.
Sustained expansion (multiple qualifying bars) is emphasized.
The result is a binary expansion state:
Expansion is either present or not present
No predictive guessing, no overfitting
---
How to Use the Turbo Banner
The Turbo Banner is designed to be used with structure, not alone.
Common workflows:
Compression / Pause → Turbo
Indicates a transition from balance to imbalance.
B-Wave or Chop → Turbo
Confirms when energy is actually releasing, not just attempting to.
Breakouts
Turbo helps validate whether a breakout has real volatility behind it.
Important:
The Turbo Banner does not tell you where to enter — it tells you when expansion is real enough to matter.
---
Best Use Cases
Intraday trading (5m–30m)
Futures, indices, and liquid equities
Works especially well after:
Squeezes
Consolidation ranges
Mean-reversion phases
---
What the Turbo Banner Is NOT
❌ Not a buy/sell signal
❌ Not a momentum oscillator
❌ Not predictive
It is a confirmation layer that helps answer:
“Is this move actually expanding, or is it noise?”
---
Design Philosophy
Markets spend more time compressing and pausing than expanding.
This script is intentionally selective so that when it activates, it represents a meaningful regime change, not constant activity.
---
Chart & Performance Notes
The banner is intentionally minimal to keep charts clean.
Logic is optimized to avoid excessive object creation and freezing.
Designed for use on a clean chart or alongside a small number of structural tools.

StO Price Action - Panel Trend Alignment [Demo]Short Summary
- Panel-based candle coloring indicator for multi-timeframe trend alignment
- Bullish / bearish states across up to 7 timeframes
- Designed to quickly assess directional confluence
Demo Restrictions
- Timeframe dropdown selections are limited
- Line style dropdown selections are limited
- Multi-timeframe functionality is removed or restricted
- Alerts are disabled or completely removed
- No code logic runs behind disabled GUI elements
Full Description
Overview
- This indicator displays trend alignment as colored bars in a dedicated panel
- Each bar represents the directional state (bull / bear) of a selected timeframe
- Focused on fast visual confirmation of multi-timeframe bias
Timeframe Configuration
- Supports up to 7 independent timeframes
- Each timeframe can:
- Follow the chart timeframe or use a fixed resolution
- Be shown or hidden individually
- Use custom bull and bear colors
- Automatic hiding first if a timeframe duplicates another active one
Trend State Logic
- Each timeframe resolves into a binary state Bullish or Bearish
- States are visualized as colored panel candles / blocks
- Real-time mode optionally updates last
Visual Encoding
- Bullish states use configurable green-based colors
- Bearish states use configurable red-based colors
Alerts
- Optional alert per timeframe
- Alerts trigger on directional changes
Usage
- Identifying multi-timeframe trend confluence
- Filtering trades to align with dominant structure
- Quick bias check before execution on lower timeframes
Notes
- Panel reflects trend state not entry signals
- Real-time mode show updates before bar close
- Best used together with structure and levels

BTC - Satoshis Altcoin Graveyard OVERVIEW
The Satoshi's Altcoin Graveyard (SAG) is a macro-statistical engine designed to solve the problem of Survivorship Bias . It is a well-known phenomenon in the crypto markets that the "Top 10" list is in a constant state of flux. If you look at historical data from CoinMarketCap (CMC) year by year, you will see a revolving door of projects that once seemed "too big to fail" disappearing into obscurity. Meanwhile, Bitcoin has remained the undisputed #1 since inception.
While most traders have a "gut feeling" that Altcoins eventually depreciate against Bitcoin, I believe in measuring it and drawing it on a chart for better visibility. By locking in specific "Cohorts" of market leaders from the past, we can track their inevitable decay through the Satoshi Sieve .
THE 13-COIN STATISTICAL BUCKET
To ensure an objective, non-biased audit, each cohort (we look at 2018, 2020 and 2022) is constructed using a fixed market-cap methodology from the snapshot date (excluding stablecoins):
• The Core: The Top 10 non-stablecoin assets at that time by Marketcap.
• The Risk Alpha: Representative samples from the Top #25, #50, and #100 ranks. (By including lower-ranked "riskier" alts, we capture the full statistical decay of the market, not just the "Blue Chips.")
TECHNICAL ARCHITECTURE
This script is engineered to push the boundaries of the Pine Script engine. TradingView enforces a hard limit of 40 unique data requests . By tracking 3 cohorts of 13 assets plus the Bitcoin base, this indicator utilizes exactly 40/40 requests , providing the maximum possible data density in a single chart window.
THE SPS CONCEPT (Survival Probability Score)
The SPS measures the Breadth of Survival . It answers: "How many coins from this year (the year of the snapshot) are actually outperforming BTC?"
We use a binary logic system to determine if a coin is "Winning" or "Losing" against the only benchmark that matters: Bitcoin.
• The Status Formula: Status = Current_Alt_BTC_Ratio >= Entry_Alt_BTC_Ratio ? 1 : 0 . This means: Every single day, at the Daily Close , the script compares the current Alt/BTC ratio to the fixed ratio from the snapshot date. If the coin is worth more in Bitcoin today than it was back then, it is assigned a "1" (a Win). If it has lost value against Bitcoin, it gets a "0" (a Loss).
• The SPS Line: SPS Line = (Sum of 'Wins' / 13) * 100 This means: We add up all the "Winners" for that specific day and turn it into a percentage. For example, if the Aqua line is at 7.69% on your chart, it confirms that on that day , exactly 1 out of the 13 coins was successfully beating Bitcoin, while the other 12 were underperforming.
THE PERFORMANCE MATRIX
In the top-right corner, we provide a Weighted Portfolio Simulation . This answers the financial question: "If I swapped 1 BTC into an equal-weight basket of these 13 coins on the snapshot day, what is my BTC value today?".
• Value < 1.0 BTC: You lost purchasing power compared to holding Bitcoin.
• Value > 1.0 BTC: You successfully achieved "Alpha" over the benchmark.
HOW TO READ THE CHART
• The Waterfall: Lines generally trend downward as the "Satoshi Sieve" filters out assets that cannot maintain their BTC-relative value.
• Dynamic Winners: We dynamically print the names of the current survivors at the tip of each line. If a cohort shows "None," the graveyard is full.
HOW TO READ THE MATRIX
• The BTC Target: Any portfolio value in the matrix below 1.0 BTC represents a failed altcoin rotation.
• Class of 2018: A portfolio value near 0.15 BTC at the current date, means a 85% loss rate.
• Class of 2020: A portfolio value near 0.77 BTC at the current date, means an approx 20 % loss rate.
• Class of 2022: A portfolio value near 0.31 BTC at the current date, means an approx 70% loss rate.
DIFFERENCE FROM AN ALTCOIN INDEX
Standard Altcoin Indexes (like my ALSI Index ) "rebalance" by removing losers and adding new winners. This is deceptive. The Altcoin Graveyard never rebalances . It forces you to watch the "losers" decay, providing a realistic look at the long-term opportunity cost of "Buy and Hold" for anything other than Bitcoin.
CONCLUSION
The data revealed by the Satoshi Sieve leads to a singular, sobering "Lesson Learned": Picking the right coin to outperform Bitcoin is not just difficult—it is statistically improbable over a long-term horizon.
While the "Risk-Reward" of altcoins is often marketed as having higher upside, the Altcoin Graveyard proves that for the vast majority of assets, the reward does not justify the risk of total portfolio erosion in BTC terms.
• The Mathematical Odds: If you picked a Top 10 coin in 2018, your chance of outperforming BTC today is effectively 0%.
• The Rotation Trap: Most investors "HODL" these assets into the graveyard, hoping for a return to previous ATHs that never comes because the liquidity has already moved on to the next "Class" of winners.
The final conclusion is clear: Diversification into altcoins is often just a slow-motion transfer of wealth back to Bitcoin. If you cannot identify the 1-out-of-13 that survives the Sieve, your best risk-adjusted move has historically been to simply hold the benchmark.
DISCLAIMER
This script is for educational purposes only. It does not constitute financial advice. It is a mathematical study of historical opportunity cost and survivorship bias.
Tags
bitcoin, btc, satoshis graveyard, altseason, dominance, total3, rotation, cycle, index, alsi, Rob Maths, robmaths
