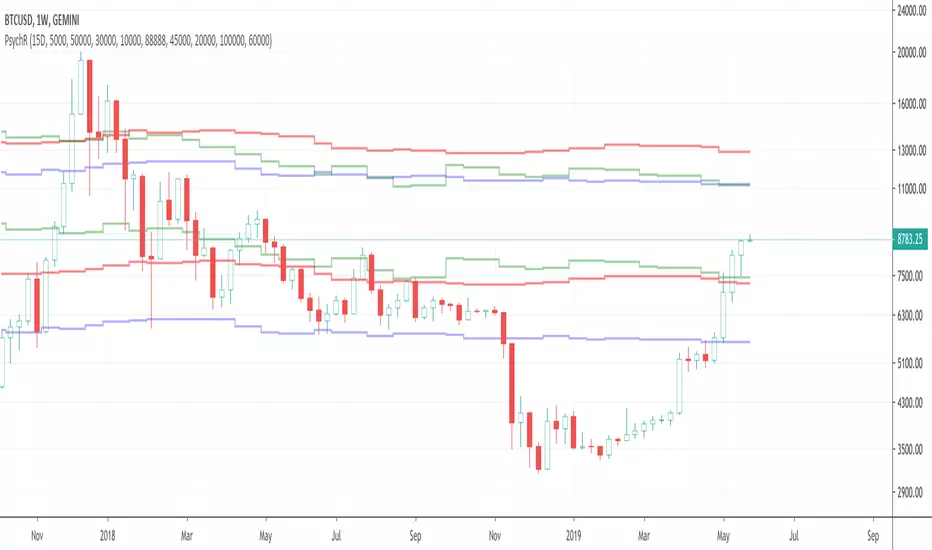
Foreign Currency Psychological ResistanceThought it would be interesting to look into psychological barriers (round numbers) denominated in foreign currencies and see where those barriers show up on a USD chart.
I did a couple of quick and superficial Internet searches to get an idea of which USD pairs are being used the most to trade Bitcoin. My conclusion is that the most relevant currencies are the Chinese Renminbi and the Brazilian Real.
Based on that, I wrote this little indicator that uses the exchange rate from the USD pairs (USDCNY, USDBLR) and the round number targets to come up with the corresponding USD price levels.
Поиск скриптов по запросу "bitcoin"
🔗Blockchain Fundamentals - BTC Network Momentum - Cryptorhythms🔗Blockchain Fundamentals - Bitcoin Network Momentum by Cryptorhythms
Description
Network Momentum is a view created by PositiveCrypto which looks into the value transmitted through the Bitcoin blockchain denominated in BTC value plotted against Bitcoin`s price. It serves as a leading indicator of Bitcoin bull markets. Sufficiently high levels of value throughput is needed drive bull markets.
Network Momentum, if it was corrected for Bitcoin`s expanding token supply, would essentially be Bitcoin Velocity. In other words an inverse chart of NVT Ratio.
Bitcoin Network Momentum is another piece of the puzzle to help our understanding of Bitcoin fundamentals and their impact on price. Bitcoin Network Momentum looks at the relationship between Bitcoin’s price and the BTC value of daily transactions flowing through the blockchain.
It is important to note here that we are using the BTC daily value flowing through the blockchain, not the USD daily value which NVT Signal uses.
What we see when we look at this is that the BTC value of daily transactions acts as a leading indicator of Bitcoin’s major market phases.
Extras
We give you the option of changing the median price lookback length
👍 Enjoying this indicator or find it useful? Please give me a like and follow! I post crypto analysis, price action strategies and free indicators regularly.
💬 Questions? Comments? Want to get access to an entire suite of proven trading indicators? Come visit us on telegram and chat, or just soak up some knowledge. We make timely posts about the market, news, and strategy everyday. Our community isn't open only to subscribers - everyone is welcome to join.
For Trialers & Chat: t.me

Bitwise Spot Volume Index (@BTC_JackSparrow) [v2019-03-23]Following Bitwise's research on the legitimacy of volume on spot exchanges, they reported 95% of the Bitcoin market volume is fake.
According to the report 10 exchanges showed trustworthy regulated spot volume. Having accurate reporting of volume is important and therefore I have made this indicator that combines all 23 pairs listed on the exchanges mentioned by Bitwise that are available on TradingView.
The volume listed in this indicator could be used as a reference for true volume and therefore is an important addition to your trading toolkit and should more or less represent the data found on this page, released by Bitwise: www.bitcointradevolume.com
If you like this, give me a follow on TradingView and Twitter (@BTC_JackSparrow : twitter.com).
NOTE: as this indicator needs to pull a lot of data, it might take a moment to load!
How To Read?!
Volume is printed as the sum of all Bitcoins traded on the listed exchanges.
Trade safely!

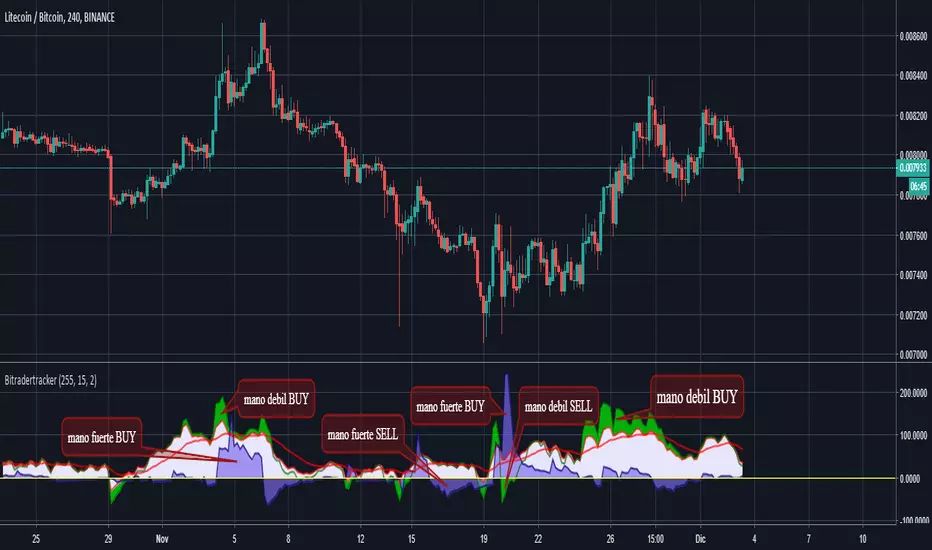
BitradertrackerEste Indicador ya no consiste en líneas móviles que se cruzan para dar señales de entrada o salida, si no que va más allá e interpreta gráficamente lo que está sucediendo con el valor.
Es un algoritmo potente, que incluye 4 indicadores de tendencia y 2 indicadores de volumen.
Con este indicador podemos movernos con las "manos fuertes" del mercado, rastrear sus intenciones y tomar decisiones de compra y venta.
Diseñado para operar en criptomonedas.
En cuanto a qué temporalidad usar, cuanto más grande mejor, ya que al final lo que estamos haciendo es el análisis de datos y, por lo tanto, cuanto más datos, mejor. Personalmente recomiendo usarlo en velas de 30 minutos, 1 hora y 4 horas.
Recuerde, ningún indicador es 100% efectivo.
Este indicador nos muestra en las áreas de color púrpura (manos fuertes) y en las áreas de color verde (manos débiles) y al mostrármelo gráficamente ya el indicador vale la pena.
El mercado está impulsado por dos tipos de inversores, que se denominan manos fuertes o ballenas (agencias, fondos, empresas, bancos, etc.) y manos débiles o peces pequeños (es decir, nosotros).
No tenemos la capacidad de manipular un valor, ya que nuestra cartera es limitada, pero podemos ingresar y salir de los valores fácilmente ya que no tenemos mucho dinero.
Las ballenas pueden manipular un valor ya que tienen muchos bitcoins y / o dinero, sin embargo, no pueden moverse fácilmente.
Entonces, ¿como pueden comprar o vender sus monedas las ballenas? Bueno, ellos hacen su juego: Tratan de hacernos creer que la moneda esta barata cuando nos quieren vender sus monedas o hacernos creer que la moneda es cara cuando quieren comprar nuestras monedas. Esta manipulación se realiza de muchas maneras, la mayoría por noticias.
Nosotros, los pequeños peces, no podemos competir contra las ballenas, pero podemos descubrir qué están haciendo (recuerde, son lentas, mueven sus monstruosas cantidades de dinero) debemos movernos con ellas e imitarlas. Mejor estar bajo la ballena que delante de ella.
Con este indicador puedes ver cuando las ballenas están operando y reaccionar ; porque el enfoque matemático que los sustenta ha demostrado ser bastante exitoso.
Cuando las manos fuertes están por debajo de cero, se dice que están comprando. Lo mismo ocurre con las manos débiles. Generalmente, si las manos fuertes están comprando o vendiendo, el precio está lateralizado. El movimiento del precio está asociado con las compras y ventas realizadas por la mano débil.
Espero que les sea de mucha utilidad.
Bitrader4.0
This indicator no longer consists of mobile lines that intersect to give input or output signals, but it goes further and graphically interprets what is happening with the value.
It is a powerful algorithm, which includes 4 trend indicators and 2 volume indicators.
With this indicator we can move with the "strong hands" of the market, track their intentions and make buying and selling decisions.
Designed to operate in cryptocurrencies.
As for what temporality to use, the bigger the better, since in the end what we are doing is the analysis of data and, therefore, the more data, the better. Personally I recommend using it in candles of 30 minutes, 1 hour and 4 hours.
Remember, no indicator is 100% effective.
This indicator shows us in the areas of color purple (strong hands) and in the areas of color green (weak hands) and by showing it graphically and the indicator is worth it.
The market is driven by two types of investors, which are called strong hands or whales (agencies, funds, companies, banks, etc.) and weak hands or small fish (that is, us).
We do not have the ability to manipulate a value, since our portfolio is limited, but we can enter and exit the securities easily since we do not have much money.
Whales can manipulate a value since they have many bitcoins and / or money, however, they can not move easily.
So, how can whales buy or sell their coins? Well, they make their game: They try to make us believe that the currency is cheap when they want to sell their coins or make us believe that the currency is expensive when they want to buy our coins. This manipulation is done in many ways, most by news.
We, small fish, can not compete against whales, but we can find out what they are doing (remember, they are slow, move their monstrous amounts of money) we must move with them and imitate them. Better to be under the whale than in front of her.
With this indicator you can see when the whales are operating and reacting; because the mathematical approach that sustains them has proven to be quite successful.
When strong hands are below zero, they say they are buying. The same goes for weak hands. Generally, if strong hands are buying or selling, the price is lateralized. The movement of the price is associated with the purchases and sales made by the weak hand.
I hope you find it very useful.
Bitrader4.0
Crypto Correlation Matrix Series [SHK]Hi everyone, Although everything's clear from the title but I should describe some basic points.
Currency Correlation is a statistical measure of how two securities move in relation to each other.
So this script is used to show if current pair (alt-coins) is moving in the same direction of bitcoin (or ethereum) or not. Consider that in crypto market most of alt-coins have correlation of +0.7 with bitcoin, So temporary changes in correlation may signal a reversal or sharp continuation for the alt-coin.
"1" : The alt coin is moving in same direction of Bitcoin (Or Ethereum).
"0" : The alt coin is moving in random direction compared to Bitcoin. (No movement relation)
"-1" : The alt coin is moving in opposite direction of Bitcoin.
Important Note: By default average of 15 bars back is measured to calculate the correlation by this script. Please test other periods and share the best options with us.
Comments are welcomed :)

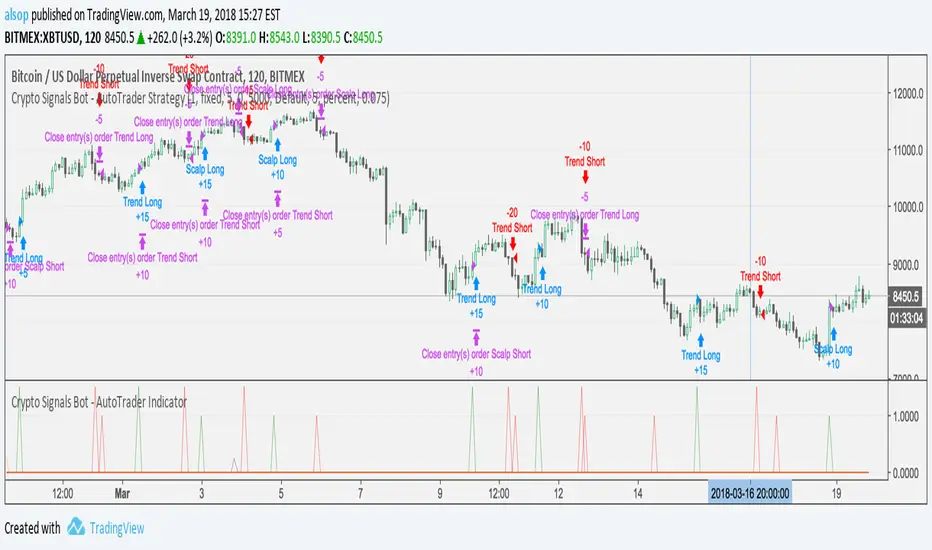
Crypto Signals Bot - AutoTrader IndicatorVery excited to release our new fully automated trading bot specifically for Bitcoin.
We use this system with AutoView to trade on Bitmex and it is specifically designed for Bitcoin on the 2 Hour charts.
It includes everything you will need:
AutoTrader Strategy
AutoTrader Indicator
All Alerts Syntax for AutoView
This has been producing amazing results and is a fully automated trading system that will take buys (long) and sells (short) on Bitcoin with supported crypto exchanges.
To signup, go to this URL: www.cryptosignalsbot.com
BTC CorrelationA simple script to display how correlated the current ticker is to Bitcoin.
Inputs are the number of bars to check correlation for (default 10) and the the ticker to use for BTC comparison (default is BITFINEX:BTCUSD)
Values of 1 are highly correlated (i.e. bitcoin moves up, so does your current ticker), values of -1 are inversely correlated (i.e. bitcoin moves up, your current ticker moves down).
See: www.babypips.com for some more details on correlation

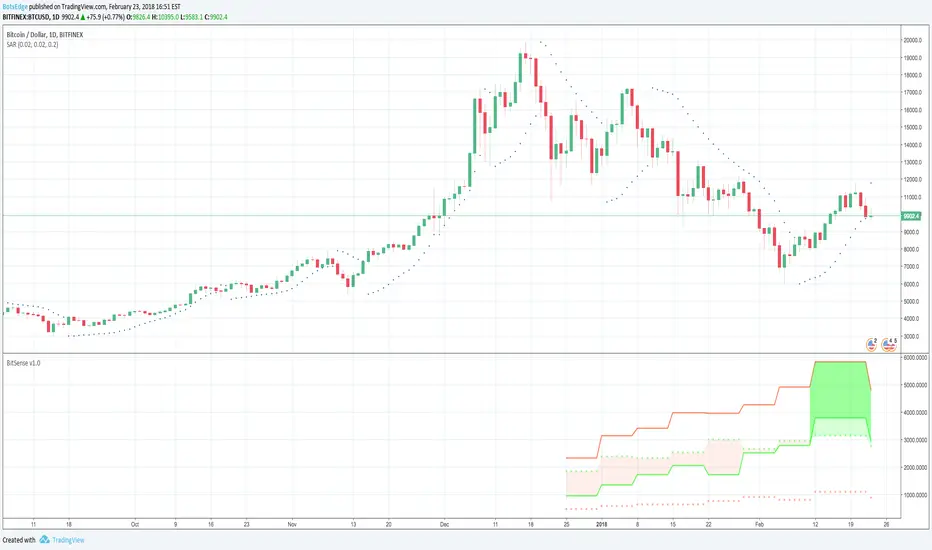
BTC-USD Commitment of Traders Bitsense v1.0INDICATOR EXPLANATION
The main data from the COT report is plotted using 4 lines. These are
The solid red line shows the commercial short (hedge) positions
The solid green line shows the commercial long positions
The dotted red line shows the non commercial short (not hedging) positions
The dotted green line shows the non commercial long positions
The shaded areas show the long and short situation in the bitcoin market as weak and strong
The lighter the color, the weaker the market is. So for example for Jan 2018 the first full month with the new futures we see a light red color between the commercial (solid green) and the noncommercial (dotted green) positioning line. This means that the market is weakening but on a longer timeframe still on an upward move. So this is a possible launchzone for any short trade but it is weak
The darker the color, the stronger the market. So for example in the middle of Feb 2018 we see a bigger area with different shades of green. There is a light green color shown between the commercial long (solid green) and the non commercial long (dotted green) line and a darker green color between the commercial long (solid green) and the commercial short (solid red) line. So this is a possible and strong launchzone for a long trade in bitcoin
HOW TO USE
Whenever Bitsense shows a light shaded colored area, that area then can be used as a launchzone for trades in the direction of the market but one needs to know that the light colors represent weak market conditions. So a light shaded red area represents a possible launchzone for a short trade but it is a very weak short market (no matter how many points the market moves in that direction it is still a weak condition)
Whenever Bitsense shows a darker shaded colored area, that area then can be used as a launchzone for trades in the direction of the market. The same goes for areas where light and darker shaded areas are together. These represent strong market conditions
As can be seen (mid feb 2018), even though the commercial shorts stay on top, Bitsense shows a strong long situation and the market starts rising. The COT report is different from traditional indicators and Bitsense shows this clearly. To explain, both of the dotted lines show the non commercial positions either long or short. These positions are traded in the direction of their color, so if the non commercial dotted green line stays on top of the non commercial red dotted line there are more long positions on bitcoin futures out there than there are short positions. But this is not that easy with the commercial positions. These are usually hedging positions which means a high commercial solid red line represents the commercial traders hedging a market that they think i a) high and b) can rise more, so they sell short positions to lock in gains from the market position, whereas solid green line commercial positions start rising only when markets are low because these traders usually lock in cheap market prices with buying long positions
Since there is just a very short accumulation of data since the inception of both bitcoin futures the indicator still might not work correctly and you have to be very careful in using it. It is published here as an information tool only and should not be used for any real trading without other means of information about the market
By using this indicator you acknowledge that you have read and understood that this is for research purposes only and I am not responsible for any financial losses you may incur by using this indicator. All trading involves high risk and past performance is not necessarily an indication of future results
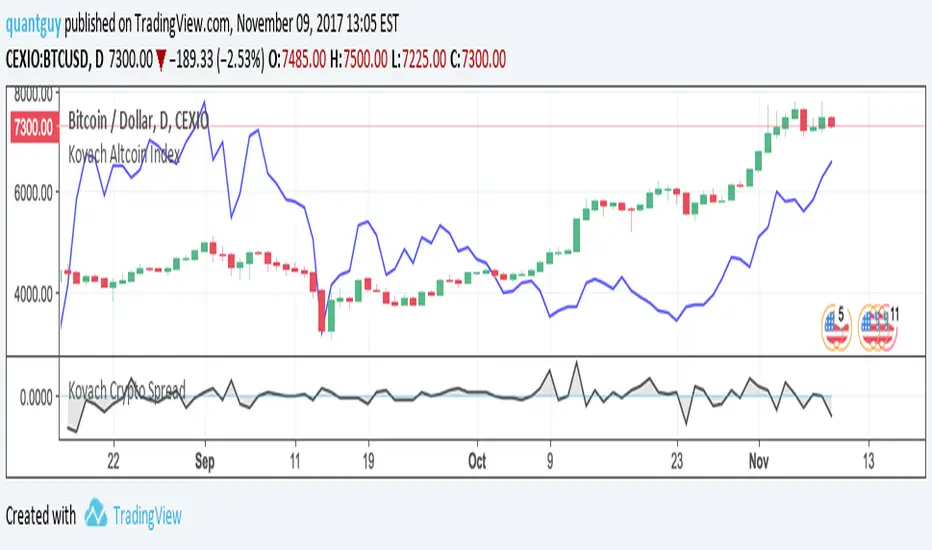
Kovach Altcoin IndexCombined with the Kovach Crypto Spread, these two indicators can help visualize asset flows from Bitcoin to Altcoins and vice versa. For example, now we have a bit of a pullback in Bitcoin due to the Segwit2x fork cancellation. We can clearly see, using the Altcoin index, that Altcoins are rallying from investors pulling out of Bitcoin.
This is further confirmed with the Kovach Crypto Spread indicator, which measures the spread in returns between Bitcoin and the top Altcoins.
Both of these scripts weight Altcoins proportional to their market capitalization, and this is updated weekly so that you constantly have up-to-date parameters, and the indicators adequately reflect the markets in real time.
Check out these indicators as well as the Kovach Momentum Indicators and the Reversals indicator at quantguy.net
Kovach Crypto SpreadThe Kovach Crypto Spread indicator calculates the spread in profit between Bitcoin and the leading Altcoins. The Altcoins are weighted by market cap and this script is update weekly so you constantly have the most relevant Altcoins and their coefficients in the indicator.
Values above zero indicate a net flow from Altcoins to Bitcoin and vice versa. Let's consider how to use this data.
1. If Bitcoin is rallying, and the spread is well above zero, this indicates that Bitcoin is providing more profit than Altcoins. Consider taking some profits from BTC and investing in Altcoins.
2. If Bitcoin is retracing, but the spread is still above zero, it means that Altcoins are getting hit harder than Bitcoin, and you should keep your position in Bitcoin.
3. If Bitcoin is ranging, and the spread is below zero, it means that Altcoins are rallying and Bitcoin is stagnant.
For access to this indicator and more, please visit quantguy.net

BCH BFX Short/Long PercentageA short/long percentage on the Bitcoin Cash/US Dollar pair on Bitfinex.

Crypto-Adjusted Parabolic Stop and Reverse (CAPSAR)Finally, a more accurate PSAR is here!
This PSAR will show up , and stick around when a majority of the Crypto-Currencies in the index below conform in the same direction.
The CAPSAR can be applied to any Crypto-currency and ANY time-frame!
This Crypto-Index makes up over 90% of the Crypto-Currency market cap (total global Crypto investment).
Bitcoin
Ethereum
Bitcoin Cash
Ripple
Litecoin
Nemcoin
Thick Blue lines beneath the price indicate a change in direction, and momentum up.
Thick Red lines above the price indicate a change in direction, and momentum down.
This indicators holds three editable parameters:
1. "Start" - The starting value for the Acceleration Factor (.02 is the Default).
2. "Increment" = The increment in which the Acceleration Factor will move (.02 is Default).
3. "Max" - The maximum value of the Acceleration Factor (.20 is the Default)

Godmode Oscillator, fresh bread generator, free to use!Greetings Mates,
!!! If you want to use this tool for free you have to to following steps:
1) say thanks to LEGION who coded the first version.
2) say thanks to LAZYBEAR cause we ripped some code snippets from him.
3) say thanks to Ni6HTH4wK who coded the latest version.
4) say thanks to xSilas who gave the idea.
5) I know i said its a FREE Tool and you dont need to donate me cause i have Godmode :), but lets have a litte thought on all the people that are a bit poorer than us. It would be really great if we get some DOLLARS for a great charity action for children.
6) Feel free to spend some Bitcoins to this Address: 1BNjs1Prsux8YQawVWYfiYoxzoKzfReckX
(i start and going to spend 1 BTC) (! the spended amount is revealed at the end!)
7) If you know said thankyou to everybody and may spend some dollars we can go on with Godmode trading.
8) Enjoy the Tool, merry Xmas and cheers for another great volatile bitcoin year :).
GODMODE OSCILLATOR, FRESH BREAD GENERATOR, FREE TO USE!Greetings Mates,
!!! If you want to use this tool for free you have to to following steps:
1) say thanks to LEGION who coded the first version.
2) say thanks to LAZYBEAR cause we ripped some code snippets from him.
3) say thanks to Ni6HTH4wK who coded the latest version.
4) say thanks to xSilas who gave the idea.
5) I know i said its a FREE Tool and you dont need to donate me cause i have Godmode :), but lets have a litte thought on all the people that are a bit poorer than us. It would be really great if we get some DOLLARS for a great charity action for children.
6) Feel free to spend some Bitcoins to this Address: 1BNjs1Prsux8YQawVWYfiYoxzoKzfReckX
(i start and going to spend 1 BTC) (! the spended amount is revealed at the end!)
7) If you know said thankyou to everybody and may spend some dollars we can go on with Godmode trading.
8) Enjoy the Tool, merry Xmas and cheers for another great volatile bitcoin year :).
---------------------------------------------------------
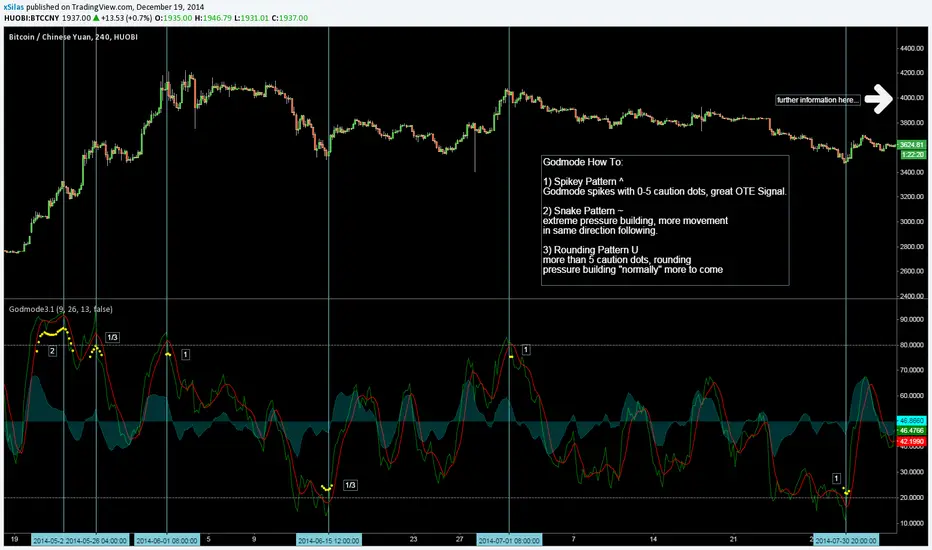
Godmode How To:
1) Spikey Pattern ^
Godmode spikes with 0-5 caution dots, great OTE Signal.
2) Snake Pattern ~
extreme pressure building, more movement
in same direction following.
3) Rounding Pattern U
more than 5 caution dots, rounding
pressure building "normally" more to come

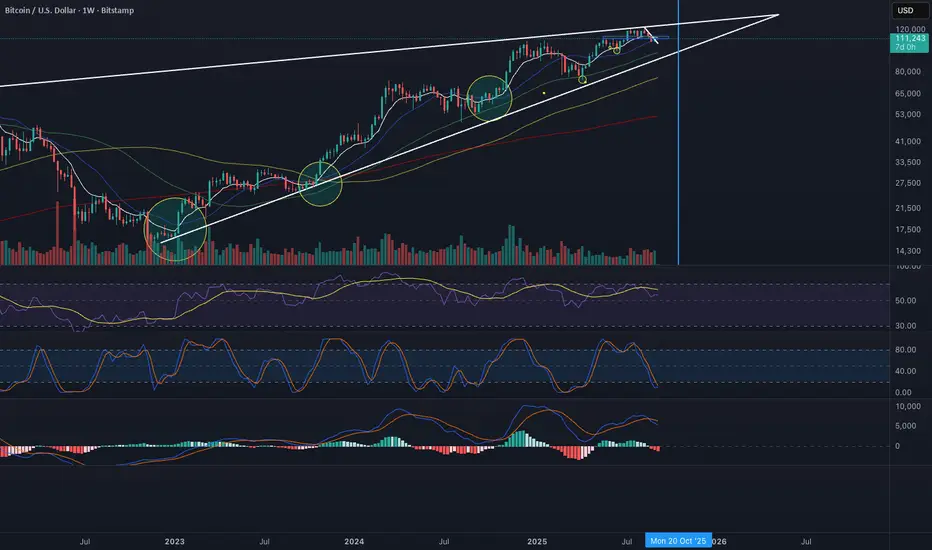
Global Liquidity Proxy vs BitcoinGlobal Liquidity Proxy vs Bitcoin. Helps to understand the cycles with liquidty.
Jarvis Bitcoin Predictor – Advanced AI-Powered TrendJarvis Bitcoin Predictor is an invite-only indicator designed to help traders anticipate market moves with precision.
It combines advanced momentum tracking, volatility analysis, and adaptive trend filters to highlight high-probability trading opportunities.
🔹 Core Features:
- AI-inspired algorithm for Bitcoin price prediction
- Early detection of bullish and bearish trend reversals
- Dynamic support & resistance zones
- Clear buy/sell signal markers
- Built-in alerts to never miss an opportunity
Optimized for Bitcoin, but compatible with other crypto pairs
🔹 How it works (general explanation):
The indicator uses a mix of momentum calculations, volatility filters, and adaptive trend detection to generate signals.
When several market conditions align, Jarvis provides clear entry/exit signals designed to improve decision-making and timing.
🔹 How to use it:
1- Add Jarvis Bitcoin Predictor to your chart.
2- Follow the green signals/zones for bullish opportunities.
3- Follow the red signals/zones for bearish opportunities.
4- Combine with proper risk management and your own strategy.
This tool was built to give traders clarity and confidence in the fast-paced crypto market.
⚠️ Important:
This script is invite-only. To request access, please contact the author directly.

Durdens Global M2 Liquidity Tracker🧠 Durdens Global M2 Liquidity Tracker | Bitcoin vs Liquidity, Visualized
If you’re not watching global liquidity, you’re not really trading macro.
This indicator tracks FX-adjusted M2 money supply across 20+ countries, aggregated into a single global liquidity signal. It can then be used to overlay against Bitcoin for timing macro shifts with precision.
🔍 Core Features:
🌐 USD-adjusted M2 from the US, China, Eurozone, UK, Japan, and more
📊 Normalization modes: None (raw), Index (Based to 100), Z-Score
⏳ Offset input to shift liquidity data forward — aligns with Bitcoin's delayed reaction (84–107 days common)
🧠 BTC correlation matrix: 30D, 90D, 365D correlation values
🧪 Top 3 M2 delta signals: Tracks 90-day % change for US, China, EU
🧮 Fibonacci SMAs: 13 / 34 / 89 for structural macro context
🟢🔴 Liquidity regime engine: EMA 89 defines "Risk-On" vs "Risk-Off" states
🧩 How It Works:
Each country’s M2 is multiplied by its FX rate (to USD) and summed into a single global M2 line. This ensures comparability across nations. The user can choose to:
Normalize the output (raw, indexed, or z-scored)
Shift the global M2 forward in time (offset), simulating the lag effect liquidity has on Bitcoin
Visualize macro risk conditions using EMA 89 as a liquidity regime filter
Analyze BTC correlation across 3 windows and track key regions’ M2 delta
❓ FAQ:
Why does this matter?
M2 is the monetary fuel behind asset bubbles. When liquidity rises, Bitcoin follows; with a delay. This tracker helps you front-run macro flows before they hit the chart.
Why use Index or Z-Score modes?
Raw values skew long-term visual analysis. Index mode rebases data for comparative trend tracking. Z-Score shows when liquidity is overheated or suppressed (mean reversion).
What does the offset input do?
Liquidity doesn’t hit Bitcoin instantly. Many traders use an 84–107 day forward shift to align M2 changes with BTC price action. The offset helps you visualize this.
Why track top 3 M2 regions?
US, China, and Eurozone are the heavyweights in global liquidity. Tracking their offset-day % change gives immediate insight into capital expansion or contraction.
Can I use this to trade?
Absolutely; but it’s best used as a macro filter. Combine with price structure, funding, or on-chain data to optimize timing and conviction.
⚡ Use Cases:
Spot early pivots in liquidity regimes (Risk-Off to Risk-On)
Quantify macro backdrop for Bitcoin or altcoin cycles
Understand when the Fed or PBOC are tightening or easing
Ditch the hopium. Trade with context.
—
Built by: @DurdensBitcoinLedger
Follow for updates — future upgrades include:
• Regional toggles
• Custom M2 baskets
• Alert conditions
• Continued revisions & updates
Stay liquid, not wrecked.

MSTR mNAV IndicatorStrategy mNAV Indicator
Script contains hard-coded historic share counts and BTC holdings of Strategy Inc. ( NASDAQ:MSTR ). Using these, we derived the Bitcoin mNAV multiple for the company. The formula used in this script looks like the following:
mNAV = (Fully Diluted Shares Outstanding * NASDAQ:MSTR ) / (BTC holdings * BITSTAMP:BTCUSD )
This value appears in the Blue tag at the right hand side of the chart on the latest bar. In addition, the script displays mNAV layers below and above the normal ticker chart. These are computed by taking fixing a value for the mNAV (e.g. mNAV=3) and solving the equation above for the NASDAQ:MSTR price that would equate to having that mNAV.
The user is able to configure the number of said mNAV lines to draw but is limited from mNAV = 1 up to mNAV = 20.
Why is the script private?
This script includes data on the relative count of fully diluted shares for Strategy ( NASDAQ:MSTR ) that was manually determined by the author after going through countless hours of SEC disclosures. Since there is no publicly available repository for this information and the author would like to retain the right to make this available at a later date, the script is kept private.

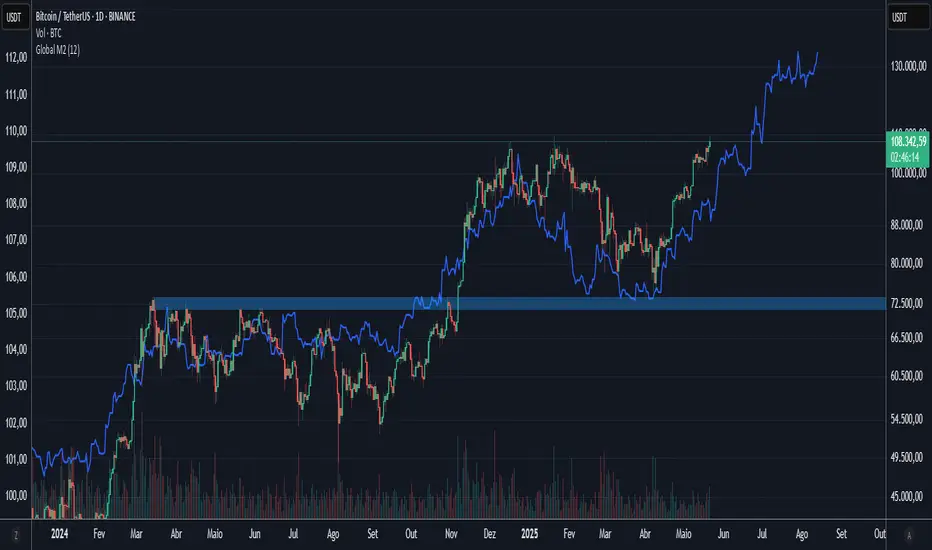
M2 Liqudity WaveGlobal Liquidity Wave Indicator (M2-Based)
The Global Liquidity Wave Indicator is designed to track and visualize the impact of global M2 liquidity on risk assets—especially those highly correlated to monetary expansion, like Bitcoin, MSTR, and other macro-sensitive equities.
Key features include:
Leading Signal: Historically leads Bitcoin price action by approximately 70 days, offering traders and analysts a forward-looking edge.
Wave-Based Projection: Visualizes a "probability cloud"—a smoothed band representing the most likely trajectory for Bitcoin based on changes in global liquidity.
Min/Max Offset Controls: Adjustable offsets let you define the range of lookahead windows to shape the wave and better capture liquidity-driven inflection points.
Explicit Offset Visualization: Option to manually specify an exact offset to fine-tune the overlay, ideal for testing hypotheses or aligning with macro narratives.
Macro Alignment: Particularly effective for assets with high sensitivity to global monetary policy and liquidity cycles.
This tool is not just a chart overlay—it's a lens into the liquidity engine behind the market, helping anticipate directional bias in advance of price moves.
How to use?
- Enable the indicator for BTCUSD.
- Set Offset Range Start and End to 70 and 115 days
- Set Specific Offset to 78 days (this can change so you'll need to play around)
FAQ
Why a global liquidity wave?
The global liquidity wave accounts for variability in how much global liquidity affects an underlying asset. Think of the Global Liquidity Wave as an area that tracks the most probable path of Bitcoin, MSTR, etc. based on the total global liquidity.
Why the offset?
Global liquidity takes time to make its way into assets such as #Bitcoin, Strategy, etc. and there can be many reasons for that. It's never a specific number of days of offset, which is why a global liquidity wave is helpful in tracking probable paths for highly correlated risk assets.

Global M2 10-Week Lead (for bitcoin)This script displays a combined view of the Global M2 Money Supply, converted to USD and adjusted with a configurable forward lead (default 10 weeks). It is designed to help visualize macro liquidity trends and anticipate potential impacts on Bitcoin price movements across any timeframe.
🔹 Main Features:
- Aggregates M2 data from 18 countries and regions including the USA, Eurozone, China, Japan, and more.
- All M2 values are converted to USD using respective exchange rates.
- Customizable “Slide Weeks Forward” setting lets you project global liquidity data into the future.
- Works on all timeframes by adjusting the projection logic dynamically.
- Toggle each country’s data on or off to customize the liquidity model.
💡 Use Case:
Global liquidity is often a leading indicator for major asset classes. This tool helps traders and analysts assess macro-level trends and their potential influence on Bitcoin by looking at changes in M2 money supply worldwide.
💡 Inspired By:
This tool mimics the Global M2 10-Week Lead liquidity indicator often referenced by Raoul Pal of Real Vision and Global Macro Investor, used for macro analysis and Bitcoin movement prediction.
📊 Note:
All economic and FX data is sourced from TradingView’s built-in datasets (ECONOMICS and FX_IDC). Data availability may vary depending on your plan.
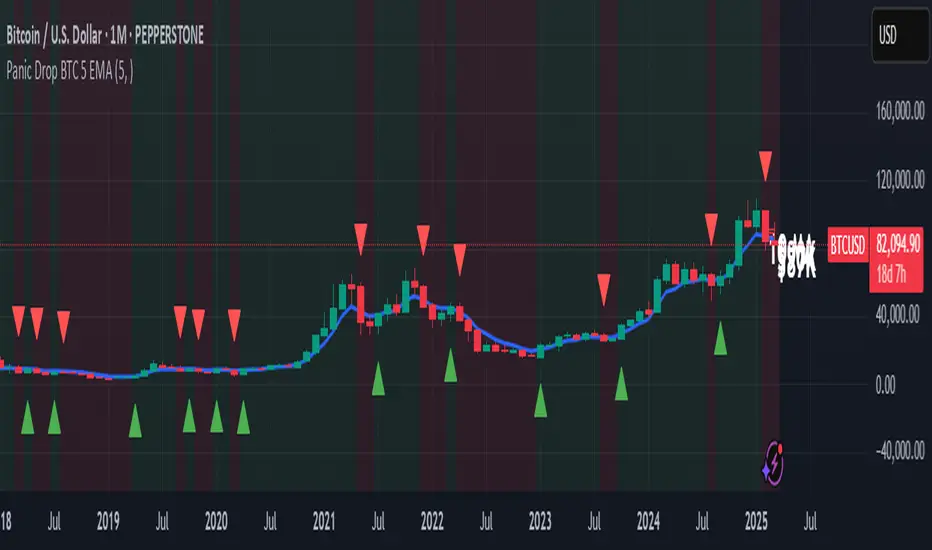
Panic Drop Bitcoin 5 EMA Buy & Sell SignalPanic Drop BTC 5 EMA
What It Does:
This indicator tracks Bitcoin’s price against a 5-period Exponential Moving Average (EMA) to deliver simple buy and sell signals. A green arrow below the candle signals a buy when Bitcoin closes above the 5-EMA, while a red arrow above signals a sell when it closes below. Perfect for spotting Bitcoin’s momentum shifts—whether you’re a newbie, crypto trader, or short on time.
Key Features:
Plots a customizable 5-EMA (default: blue line).
Buy () and Sell () signals on crossovers/crossunders.
Optional background highlight: green (above EMA), red (below).
Alerts for buy/sell triggers.
Fully adjustable: timeframe, colors, signal toggles.
How to Use It:
Add to your BTC/USD chart (works on any timeframe—daily default recommended).
Watch for green arrows (buy) below candles and red arrows (sell) above.
Customize via settings:
Adjust EMA period (default: 5).
Set timeframe (e.g., "D" for daily, "1H" for hourly).
Change colors or toggle signals/background off.
Set alerts: Right-click a signal > "Add Alert" > Select "Buy Signal" or "Sell Signal."
Trade smart: Use signals to catch Bitcoin dips (e.g., buy below $100K) or exits.
Why It’s Great:
Beginners: Clear arrows simplify decisions.
Crypto Traders: 5-EMA catches Bitcoin’s fast moves.
Busy Investors: Signals save time—no deep analysis needed.
Created by Timothy Assi (Panic Drop), eToro’s elite investor. Test it, tweak it, and trade with confidence!
Economic Crises by @zeusbottradingEconomic Crises Indicator by @zeusbottrading
Description and Use Case
Overview
The Economic Crises Highlight Indicator is designed to visually mark major economic crises on a TradingView chart by shading these periods in red. It provides a historical context for financial analysis by indicating when major recessions occurred, helping traders and analysts assess the performance of assets before, during, and after these crises.
What This Indicator Shows
This indicator highlights the following major economic crises (from 1953 to 2020), which significantly impacted global markets:
• 1953 Korean War Recession
• 1957 Monetary Tightening Recession
• 1960 Investment Decline Recession
• 1969 Employment Crisis
• 1973 Oil Crisis
• 1980 Inflation Crisis
• 1981 Fed Monetary Policy Recession
• 1990 Oil Crisis and Gulf War Recession
• 2001 Dot-Com Bubble Crash
• 2008 Global Financial Crisis (Great Recession)
• 2020 COVID-19 Recession
Each of these periods is shaded in red with 80% transparency, allowing you to clearly see the impact of economic downturns on various financial assets.
How This Indicator is Useful
This indicator is particularly valuable for:
✅ Comparative Performance Analysis – It allows traders and investors to compare how different assets (e.g., Gold, Silver, S&P 500, Bitcoin) performed before, during, and after major economic crises.
✅ Identifying Market Trends – Helps recognize recurring patterns in asset price movements during times of financial distress.
✅ Risk Management & Strategy Development – Understanding how markets reacted in the past can assist in making better-informed investment decisions for future downturns.
✅ Gold, Silver & Bitcoin as Safe Havens – Comparing precious metals and cryptocurrencies against traditional stocks (e.g., SPY) to analyze their performance as hedges during economic turmoil.
How to Use It in Your Analysis
By overlaying this indicator on your Gold, Silver, SPY, and Bitcoin chart (for example), you can quickly spot historical market reactions and use that insight to predict possible behaviors in future downturns.
⸻
How to Apply This in TradingView?
1. Click on Use on chart under the image.
2. Overlay it with Gold ( OANDA:XAUUSD ), Silver ( OANDA:XAGUSD ), SPY ( AMEX:SPY ), and Bitcoin ( COINBASE:BTCUSD ) for comparative analysis.
⸻
Conclusion
This indicator serves as a powerful historical reference for traders analyzing asset performance during economic downturns. By studying past crises, you can develop a data-driven investment strategy and improve your market insights. 🚀📈
Let me know if you need any modifications or enhancements!
