QuantNomad - EVWMA MACD StrategyPretty simple EVWMA (Elastic Volume Weighted Moving Average ) MACD Strategy.
EVWMA is a quite interesting moving average where the period of the MA is defined from the volume itself.
It incorporates volume information in a natural and logical way. The EVWMA can be looked at as an approximation to the average price paid per share.
As a volume period, you can use sum of the last x bars volumes.
Here are other EVWMA indicators/strategies:
EVWMA indicator:
EVWMA Cross strategy:
Поиск скриптов по запросу "bitcoin"

QuantNomad - EVWMA Cross StrategyPretty simple EVWMA (Elastic Volume Weighted Moving Average) Cross Strategy. Long on bullish cross, Short on Bearish Crosss.
EVWMA is a quite interesting moving average where period of the MA is defined from volume itself.
It incorporates volume information in a natural and logical way. The eVWMA can be looked at as an approximation to the average price paid per share.
As a volume period you can use sum of the last x bars volumes.
Here is EVWMA as an indicator:

[BERA] KEANU REEVES STRATEGY TESTThis is a strategy test of my indicator.
Indicator based on Average true range.
LIME ARROW = LONG
RED ARROW = SHORT
LIME COLOR BARS IF GREEN ARROW CONDITION VALID.
RED COLOR BARS IF RED ARROW CONDITION VALID.

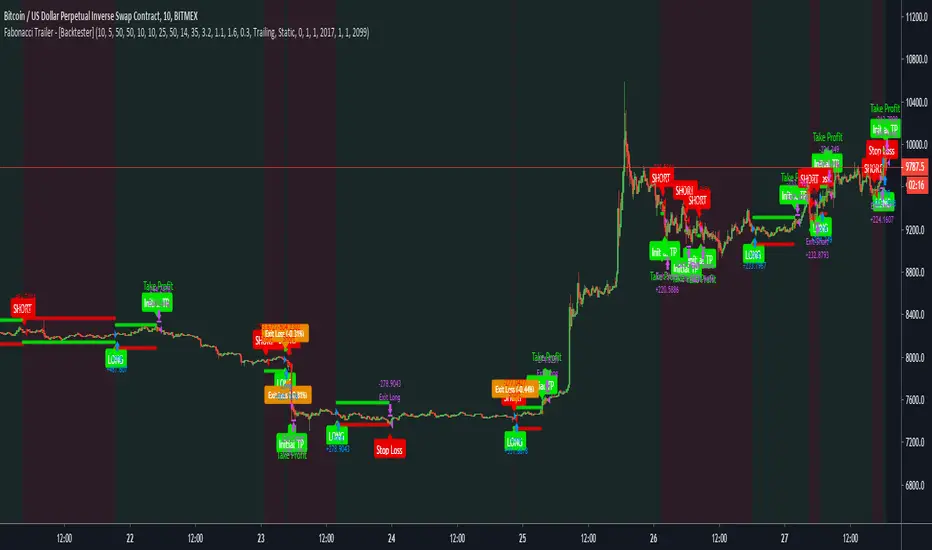
Fabonacci Trailer - [Backtester]This study comes with the following indicators and features:
ADX indicator
Chop indicator
Super Trend indicator
Trailing Take Profit and Stop Loss
Entry, Take Profit, and Stop Loss Alerts
Renko chart support
And a few more indicators in the back-end to increase accuracy and optimize entries
The study version with all alerts can be found in my profile. It is not repainting and we advise to use alerts on “Once Per Bar Close”.
Please note that this script is based on invite only.
150MA Cross BuyAndSell Strategy [d3nv3r]This is a Buy And Sell Strategy I haven't seen anywhere so i share mine.
Used on Bitcoin - daily chart - the strategy generate sell and buy indicator on crossover and crossunder the 150 simple moving average.

[astropark] Super RSI [strategy]Dear Followers,
today a new Scalper Tool , which works great on 3 minutes and 5 minutes timeframes , but also down to 1m and up to 30m!
I called it " Super RSI ", as it is based on RSI and inherits some basic functionality from it.
If you check its settings, you will see that you can have 3 different buy-sell sources (first two are active by default):
STRONG BUY/SELL : buy when white area deeply falls into oversold-red zone and sell when white area gets into overbought-green zone (you can set and edit at which level oversold and overbought zones start);
CROSSES : buy when the black RSI line in the middle between red and green area cross under the buy cross limit value and sell when it crosso over the sell cross limit value (you can set and edit specific cross ranges for both buy and sell);
WEAK BUY/SELL : buy when green area at least go below 50 level and sell when red area at least goes above 50 level (you can edit both levels); these conditions are highlighted as background color and are very useful for taking (at least partial) profits in trades.
By default the script will be placed as oscillator on a specific pane below the chart, but
> you can disable the oscillator plot by enabling the "hide all plot" option
> and place it as overlay on chart by clicking on the black arrow at then end on the indicator name in chart and selecting "move to -> existing pane above"
This strategy can trigger till 10 buy or 10 sell signals in a row before reverting, so use a proper money management .
Strategy results are calculated on 20 trading days using 1000$ as initial capital and working at 10x leverage.
The user who wants to use this strategy, especially via an automated bot, must always set a stoploss at 3-5% from entry point or use a proper risk management strategy .
This is not the "Holy Grail", so use it with caution.
This script will let you backtest the strategy and find best settings for your preferred market.
The alarms script version of this indicator, which will let you set all notifications you may need in order to be alerted on each triggered signals, can be found by searching for " Super RSI".
This is a premium indicator , so send me a private message in order to get access to this script .

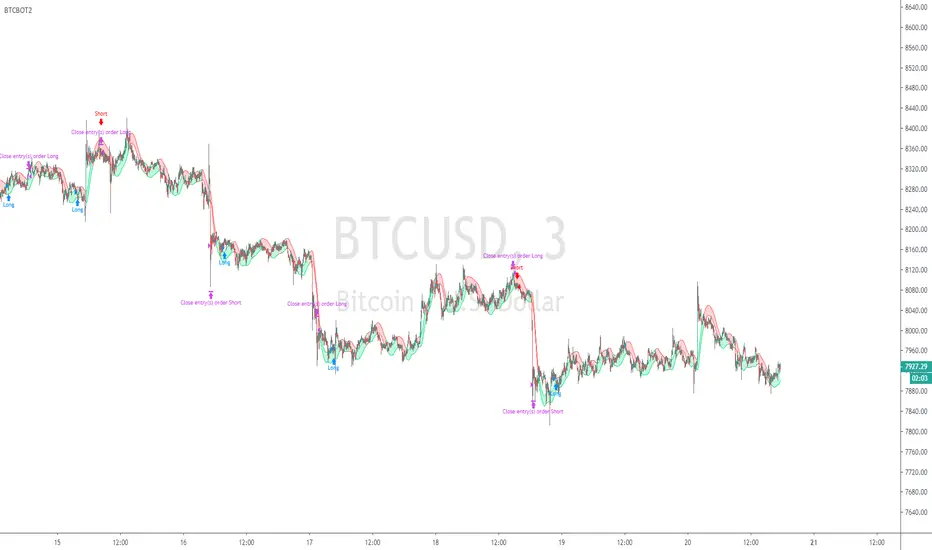
BTCBOT2Watches 3 Symbols with separate timeframe control, with Hull Moving Average crossovers on each, DXY XAU/USD BTC/USD
and a daily candle crossover. With StopLoss and Target Price and Backtesting history selection control. Entry and Exit rules visible in script (script open)
So if DXY chart is going down and Gold chart going up and Bitcoin chart going up then it will enter a buy, yes it is watching more than just bitcoin itself.
it needs HMA to match on all 3 charts and with selected timeframes, the timeframe of users chart, the timeframe in settings for the HMA's on the symbols. Also a Daily Candle chart of the users selected chart (symbol)
[astropark] Super Stochastic RSI [strategy]Dear Followers,
today a new Scalper Tool , which works great on 3 minutes and 5 minutes timeframes !
I called it " Super Stochastic RSI ", as it is based on StochRSI and inherits some basic functionality from it.
If you check its settings, you will see that you can have 3 different buy-sell sources (first two are active by default):
STRONG BUY/SELL : buy when green area deeply falls into oversold zone and sell when red area gets into overbought zone (you can set and edit at which level oversold and overbought zones start);
K/D CROSSES : buy when k-line cross above d-line and sell viceversa (you can set and edit specific cross ranges for both buy and sell);
WEAK BUY/SELL : buy when green area at least go below 50 level and sell when red area at least goes above 50 level (you can edit both levels); these conditions are highlighted as background color and are very useful for taking (at least partial) profits in trades.
By default the script will be placed as oscillator on a specific pane below the chart, but
> you can disable the oscillator plot by enabling the "hide all plot" option
> and place it as overlay on chart by clicking on the black arrow at then end on the indicator name in chart and selecting "move to -> existing pane above"
This strategy can trigger till 10 buy or 10 sell signals in a row before reverting, so use a proper money management .
Strategy results are calculated on 20 trading days using 1000$ as initial capital and working at 10x leverage.
The user who wants to use this strategy, especially via an automated bot, must always set a stoploss at 3-5% from entry point or use a proper risk management strategy .
This is not the "Holy Grail", so use it with caution.
This script will let you backtest the strategy and find best settings for your preferred market.
The alarms script version of this indicator, which will let you set all notifications you may need in order to be alerted on each triggered signals, can be found here below:
This is a premium indicator , so send me a private message in order to get access to this script .

Super Trend Daily BF 🚀Super Trend is based on volatility and attempts to show the overall greater trend of a market. Thanks to everget for the idea of improving the Super Trend code. Thanks to kiasaki for ROC code.
The idea here is to enter a trade upon trend reversal (unless we have a white background - this indicates choppy/sideways market).
INSTRUCTIONS
Follow the background color for signals of a trend reversal.
Bright green = long
Bright red = short
White = no trade
We use a fixed stop loss here of 6% but I have included the option to apply an ATR based stop loss in Settings. No take profit. No re-entering until we get an opposing signal.
I use a Rate of Change function to detect when we should stay out due to choppy sideways price action.
This strategy was optimised for XBT/USD on Bitmex 1 day chart, ideal settings for other pairs will differ.

That One Indicator (Free) - [Backtester]This Backtester comes with the following indicators:
Bollinger Bands
ADX
Moving Average Trend Confirmation Filter ( EMA , SMA , DEMA , TEMA , WMA , VWMA , SMMA , HullMA, LSMA , ALMA , SSMA, TMA, ZLEMA )
And a few more indicators in the back-end to increase accuracy
This strategy works really well as a scalper on lower Time Frames as well as on higher Time Frames. Besides that you can also trade it on pretty much any coin or asset.
The alerts script is not repainting. We advise to use alerts on “Once Per Bar Close”.
If you’d like to automate this strategy you can do that by using our alerts script with AutoView, ProfitView, ProfitTrailer, CryptoHopper etc.
Alerts are set very clearly as Long and Short to avoid confusion.
Feel free to leave a comment and share it with your friends.

DH: (Strategy) Super SmartSuper Trend: Backtest VersionSUPER SMART SUPERTREND (Strategy Version w/ Backtesting)
Across all time frames and assets I've tested, this indicator gives me better results... Better entries, better exits and well defined trends. In comparison with a STANDARD Supertrend, it is not radically different, but when it does differ "Super Smart SuperTrend" is almost always better.
This is the STRATEGY version of "Super Smart SuperTrend" ready for your backtesting. There is also a STUDY version with ALERTS which might be better for live trading if you want Alerts.
STUDY VERSION WITH ALERTS IS HERE
##################################
##################################
ABOUT THIS INDICATOR
As the name suggests, 'Supertrend' is a trend-following indicator that is notably popular here on Tradingview and elsewhere. It does a remarkably great job of recognizing a trend (in progress) and it will signal you to initiate a position when the trend is clear. Perhaps the greater value of Supertrend is that it helps keep you in your position until that trend is over.
WHAT'S THE BEST ATR PERIOD AND MULTIPLIER?
There are two important data points we must enter for Supertrend to work, namely the 'period (ATR number of candles or days)' and the 'multiplier (value by which ATR is multiplied)' BTW, in case you don't know, ATR signals the degree of price volatility. A common default setting is 10 for the ATR period and 3 for the multiplier.
SORRY, BUT THE MOVIE STARTED HALF HOUR AGO...
Unfortunately Supertrend has a couple of big weaknesses. Generally, it fails in a sideways-moving market and when it does detect a trend, the signal to get in (or out) comes rather late. It's like someone telling you about a great movie they're watching, but by the time you start watching, one-third of the movie is over... bummer, right?
HOW TO IMPROVE SUPERTREND
One solution is to combine Supertrend with other indicators such as MACD, Parabolic SAR, RSI, etc. And another solution is to experiment (backtest) with the Period and Multiplier settings for the asset and timeframe you are considering for trade.
For the STANDARD SETTINGS in this "Super Smart SuperTrend" indicator, I have set 9 for the ATR and 2.2 for the multiplier as default after backtesting on Bitcoin and other crypto (mostly in the 15 minute to 6 HOUR timeframe). Of course you can change this easily to any ATR period and Multiplier you like.
BUT... WHY NOT GET SMART?
I started thinking, it might be best if we let the market determine candle-by-candle what the settings should be. If everyone says that Supertrend works best in conjunction with other indicators, why not do our "conjuncting" programmatically (ie: automatically) sorta like artificial intelligence!
HOW IT WORKS
So here's what I did. Using data from other indicators I came up with a SMART SUPERTREND that auto-adjusts as the market changes. It still has settings so you can fine tune it for specific assets and timeframes, but once the settings are entered, it auto-adjusts as the market and prices evolve.
With "Super Smart SuperTrend" there is no ATR period setting (that is determined programmatically) and now there are TWO multipliers you can experiment with... (a lower one set at 1.7 default and a higher one at 2.5). These multiplier settings create a multiplier range that can be used programmatically to adjust the multiplier as the market and prices evolve.
THE RESULTS
Across all time frames and assets I've tested, I generally get better results. Better entries, better exits and well defined trends. In comparison with a STANDARD Supertrend, it is not radically different, but when it does differ "Super Smart SuperTrend: is almost always better. All this is substantiated by backtesting of course.
SAMPLE BACKTEST RESULTS (BTC/USD)
*Using Indicator Defaults*
TIMEFRAME STANDARD RESULTS SUPER SMART RESULTS
% Profitable | Profit Factor % Profitable | Profit Factor
DAY 58.33% 9.38 75.00% 10.77
4 HOUR 78.43% 18.22 80.95% 21.78
1 HOUR 74.11% 8.98 70.13% 9.34
15 MIN 58.10% 6.10 71.43% 9.48
Keep in mind that "Profit Factor" is key. It basically tells you what you'd make for every ONE DOLLAR invested by consistently trading with the backtested parameters.
SUPER SMART SUPERTREND FEATURES
• There is a STUDY VERSION w/Alerts
• There is a STRATEGY VERSION for Backtesting
• Standard 'Current Time Frame' SuperTrend Line
• Standard 'Higher Time Frame' SuperTrend Line
• Auto-Adjusting Dynamic Optimized SuperTrend Line
> Most Signals Are Same or Better than Standard
> Refine Results w/Sensitivity Inputs (2 Multipliers)
> Impressive Comparison Backtests
• Both Standard and Smart Signals and Alerts
• Toggle Any Line/Signal (On/Off)
• Toggle Backtest
> Standard vs. "Smart Auto-Adjust"
> Backtest Higher Timeframe Only
WHAT MORE COULD YOU ASK FOR?
So glad you asked. Actually, there is more... Super Smart SuperTrend is incorporated into my premier indicator set called: STONEHENGE PLUS: SUPERTREND TRADING TOOLKIT.
By combining Super Smart SuperTrend with dozens of other indicators plus the predictive "Stones" of Stonehenge, you'll be in Trader's Heaven.
That's it. Get "SMART" Today!
STONEHENGE PLUS:
The Complete SuperTrend Trading Toolkit
#################################
#################################
SUPER SMART SUPERTREND ALSO WORKS WITH:
STONEHENGE BASIC: Double Stone Version (Study w/Alerts):
PLEASE HIT THE LIKE BUTTON (and follow me... lots of great stuff in the works!)
As always, I appreciate your support. Please share with others.
ENJOY!
Dan Hollings
Master Crypto Grid Trader
Stonehenge Master Mason
Host of the "High Leverage Lounge"
Please Explore My Other Indicators, Scripts, Grids and Educational Ideas.
@DanHollings on Tradingview.
Additional Links Below...

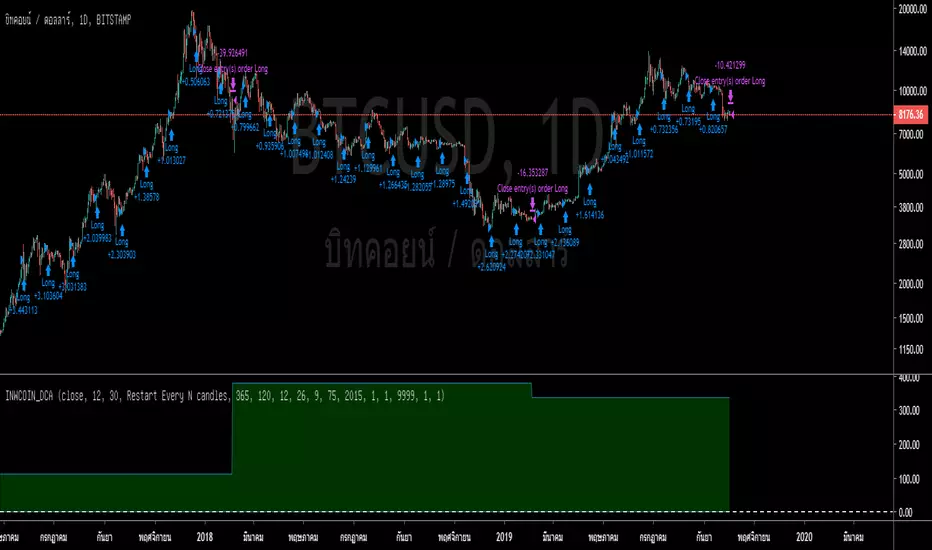
inwCoin DCA Strategy=========================
English
=========================
Just simple strategy idea for DCA bitcoin with different conditions.
Also, this is for education purpose and not the investing advise.
Use it as your own risk.
-----------
Concept
-----------
DCA with options as following ( only important option )
** Please use only in Daily TF **
Bullets Count : Amount of bullets for DCA period. If you want to DCA every months for 2 years ( close all position every 2 years ), your bullets value should be 24.
Buy every N candles : Number of candle you want to let this strategy trigger buy, 1 candle = 1 day so if you want to buy every month, input 30.
Entry / Exit filter : Dropdown to filter trade. If you don't want to DCA in downtrend, make sure to select this option. The simple trend filter is EMA 120 daily
Reset at candle N : One of DCA weak point is...no taking profit target in sight. So this option will force to take profit at N candle. You can try 1 year ( 365 ) or 2 years ( 730 )
==========================
Thai
==========================
Strategy สำหรับ backtest การ DCA ในรูปแบบต่างๆ ครับ โดยมี parameter ดังต่อไปนี้
** ควรใช้สำหรับ Timeframe Daily เท่านั้น **
Price : เป็นข้อมูลที่จะดึงมาคำนวณ ว่าจะเอาข้อมูลไหนจากแท่งเทียนมาคิด ปกติเลือก close แต่ถ้าไม่อยากให้ repaint ก็เลือก open
Bullets Count : จำนวนไม้ ที่เราจะเอามาเข้าซื้อ อย่างเช่น ถ้าจะซื้อเดือนละครั้ง และจะปิดยอดทุกๆ ปี ก็ให้ใส่ 12 ลงไป หรือถ้าเราอยากจะปิดยอดทุกๆ 2 ปี ก็ใส่ 48 เป็นต้น
Buy every N candles : จำนวนแท่งเทียนที่เราอยากจะซื้อ เช่นถ้าซื้อทุกเดือนก็ใส่ 30 ถ้าจะให้ซื้อทุกสัปดาห์ก็ใส่ 7 เป็นต้น
Entry/Exit Filter : ตัวกรองเงื่อนไขการเข้า ค่า default คือไม่กรอง แต่ถ้าจะกรอง ก็มีสองช้อยให้เลือก คือ
* กรองจาก EMA โดยจะใส่ length ของ EMA ที่ช่องด้านล่าง
* กรองจาก MACD cross 0 โดยจะใส่ รายละเอียดของ MACD ที่ช่องด้านล่าง
Reset at candle N : จะทำการขายปิดยอดที่แท่งเทียนที่เท่าไหร่ ถ้าจะปิดยอดทุกๆ ปีก็ใส่ 365 ถ้าจะปิดทุกๆ 2 ปี ก็ใส่ 730 และถ้าแก้ค่านี้ ก็อย่าลืมไปปรับ bullet count ให้สอดคล้องกันด้วย
Slow EMA Length : ตามนั้น ควรใช้ 120 เพราะ BTC ชอบค่านี้ แต่จะปรับเท่าไหร่ก็ได้แล้วแต่
Fast / Slow / MACD length : ค่าที่ใช้คำนวณ MACD ปกติจะเป็น 12,26,9
==========
Optional
==========
Close position at specific profit% : ถ้าติ๊กตรงนี้ มันจะทำการขายออก ถ้ากำไรเราได้ถึงช่องข้างล่าง
Reset at profit% : กรอก % ที่อยากจะให้ระบบขายไม้ DCA ออก ถ้ากำไรถึงเป้านี้
Close remaining position at last bar : จะทำการสรุปยอดและรับรู้กำไร ที่แท่งสุดท้าย จะใช้เพื่อลองดูประสิทธิภาพของ strategy
Exclude profit from capital : ไม่เอากำไร กลับเข้ามารวมในเงินทุนตอนแรก ( ลดการ Drawdown ได้เยอะอยู่ )
ที่เหลือเป็นตั้งช่วงที่จะ backtest ก็ไม่ยากอะไร
===========
วิธีใช้งาน
===========
เอาใส่กราฟ ก็จะเห็นผล backtest เลย แต่ถ้าอยากลองเล่นโน่นนี่นั่น ก็ลองปรับค่าไปเรื่อยๆ ดู
ตัวอย่างการตั้งค่า
============
* อยาก DCA แบบ เก็บกำไร สองปีครั้ง และแบ่งเป็น 24 ไม้ ( ทุน หาร 24 ) และซื้อทุกเดือน
Bullets Count = 24
Buy every N candles = 30
Reset at candle N = 730
* อยาก DCA ย้อนหลัง 5 ปี แบบไม่เก็บกำไรเลย มาเก็บเอาวันสุดท้าย และซื้อทุกเดือน
Bullets Count = 60 ( คือ 12 x 5 )
Buy every N candles = 30
Reset at candle N = 1825 ( คือ 365 x 5 )
From year : 2014
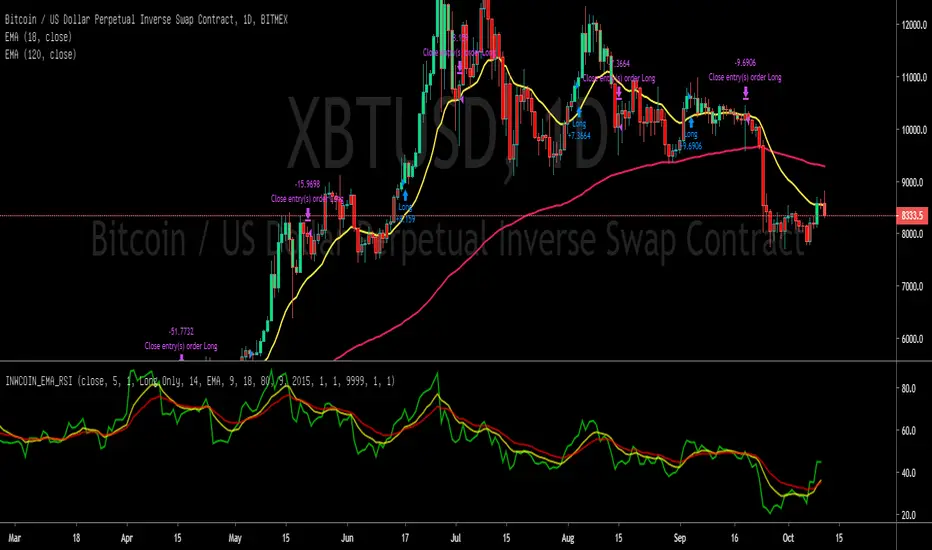
inwCoin EMA of RSI Risk% Strategy=========================
English
=========================
Just simple strategy idea using EMA of RSI crossing to define entry and exit.
Looking good for backtest result but I'm not sure will it ok if live trade.
Please make sure to paper trade ( forward test ) for few month if you want to use this strategy.
Also, this is for education purpose and not the investing advise.
Use it as your own risk.
-----------
Concept
-----------
Making slow and fast EMA of RSI and decide when to enter/exit trade
If fast crossover slow = Buy
If fast crossunder slow = Sell
You can using trend filter to filter out downtrend
Recommend value is 80 for Daily TF
This strategy is no good for small TF because EMA of RSI will cross up and down like crazy and I'm sure you'll losing money if you follow this strategy in real trade lol.
==========================
Thai
==========================
มีคนถามในห้อง Bitcoin Thai Club ว่า ถ้าใช้ EMA of RSI แล้วหาจุดเข้าออกจากตรงนั้นจะเป็นไง
ก็เลยลองทำ proof of concept strategy ออกมาดู
กลายเป็นว่า... ให้ผลค่อนข้างดีกว่าไอ้ตัวที่เคยมีซะอีก โว๊ะ!! 555
เท่าที่ไล่กดดูหลายๆ Timeframe พบว่า ยิ่ง TF เล็ก noise ยิ่งเยอะ ทำให้การตัดกันของเส้น EMA ค่อนข้างพันกันไปมา ทำให้มีการเข้าๆ ออกๆ แบบเสียเปล่าเยอะไปหน่อย
ถ้าใครจะใช้ แนะนำให้ใช้ TF daily กับ weekly ขึ้นไปน่าจะให้ผลที่พอเชื่อถือได้
===========
หลักการ
===========
ใช้ EMA สองเส้น คือ EMA fast กับ EMA slow โดยไปหาค่า ema ของ rsi แล้วหาจุดตัดของสอง ema นั้นๆ
ema fast ตัด ema slow ขึ้น = ซื้อ
ema fast ตัด ema slow ลง = ขาย
ง่ายๆ แค่นี้เอง
เท่าที่ไล่ดูด้วยตา มันสามารถออกที่ยอดได้ค่อนข้างสวยอยู่พอสมควร ( ถ้าใช้ TF daily หรือ weekly นะ )
ใครจะเอาไปเล่น ก็อย่าลืม forward test กันก่อนจะไปลงเงินจริงนะ
ตรงนี้เป็นแค่ concept แต่เวลาเทรดจริงมันอีกเรื่องนึงเลย
EMA X BF 🚀EMA Crossover Strategy
A simple EMA cross is a useful indication of a change in direction of a trend and is a very popular tool in trading. It can also be useful to judge price action momentum or severity by looking at the angle of the 2 EMAs, or the distance between them.
There are 2 Exponential Moving Averages, one fast and one slow. When the fast EMA crosses above the slow EMA, this can be considered bullish and may signal an upside move. Conversely, a cross to the downside of the fast EMA under the slow EMA can be considered bearish.
This strategy uses the same principle but uses different sources for the 2 EMAs; instead of using close values, we use ohlc4 values for the fast EMA and hlc3 values for the slow EMA.
The idea is that a trader might enter a long position upon a cross up and reverse position and go short upon the next cross down.
We use a simple 6% stop loss for both long and short positions.
This strategy is tuned to a 6hr chart for Bitcoin USD pairs.
INSTRUCTIONS
Go Long when the background is green
Go short when the background is red
White background means sideways market: a no trade zone

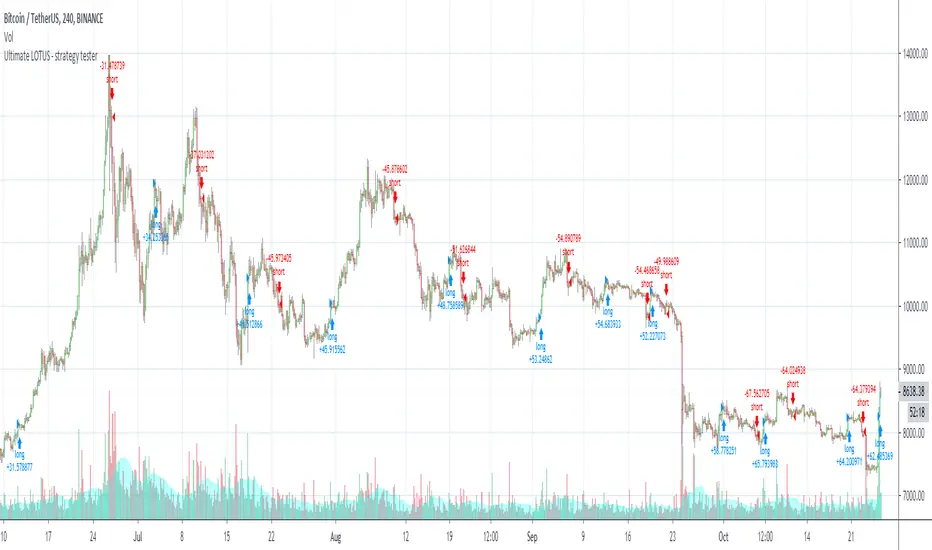
Ultimate LOTUS - strategy tester
Welcome to the Ultimate LOTUS - Strategy Tester.
This indicator is used for back-testing. Once you have found settings that you like, you can use my other published indicator "Ultimate LOTUS" to set alerts.
How to use: Apply to any chart, on any time frame. You will see LONG and SHORT signals on the chart. A LONG signal represents an entry/buy in, and a SHORT signal represents an exit/sell.
You can use the Express - Strategy Tester to scalp on low time frames such as the 5m, 15m, 30m etc. Or use it on higher time frames such as the 1hr, 2hr, 4hr.
You can use regular candles but Heikin Ashi are recommended for better accuracy.
You cannot set alerts with this indicator!
Channel Strategy for CryptoCurrenciesIts a break-out strategy with simple rules and strict money management (every trade risk 1% of the equity)
Entry happens on breakout of significant swing points.
Initial stop loss is on the opposite swingpoint and will be trailed by multiple factors including a maximum distance to the current price.
Works best on BTCUSD on H4. Also good results on higher timeframes.
also cross checked other pairs. works on IOTUSD and EOSUSD . Seems to have some troubles (in default params) with LTC and XRP.
feel free to leave a comment and please tell me if you find a reason why this shouldn't make you rich :D

BTC Daily Strategy BFStrategy based on code by @CredibleHulk so thanks for that.
This is a strategy for the Daily Bitcoin chart which uses the MACD, RSI, Stochastic RSI and a moving average.
The conditions for long or short signals depend on the indicators above crossing user-defined thresholds.
Long signal = (Stochastic RSI k value is below Stochastic Sell Threshold) AND EITHER (MACD delta crosses above MACD Threshold OR RSI crosses above RSI Threshold)
Short signal = (MACD delta crosses below 0) AND EITHER (Close Price - an SMA of the ohlc4 values crosses below the DMA threshold OR Stochastic RSI k value is above Stochastic Sell Threshold)
INSTRUCTIONS
Green background = go long
Red background = go short
You can adjust stop loss values for long or short signals in settings as well as all parameters for the indicators.

Sto2 Stochastic RSI for BitcoinStochastic RSI based oscillator with a Rate of Change function added to avoid sideways movements.
Designed around BTC/USD but may be useful elsewhere.
INSTRUCTIONS
Green = go long
Red = go short
White = No trade zone (sideways with not much volatility)

trend_ultimateCan be used in any market , preferably 15 min. timeframe , take every signal and it will generate positive returns .
Note ** : Use it with anything which has daily standerd deviation gtreater than 2 for more positive result.

BITCOIN_BUYSELL_vs_DOMINANCEShows the heat maps of bitcoin buying/selling in combination with dominance. The yellow lines do not change per chart as it is utilizing dominance and bitcoin action; the red/green zones will update as they are dependent on asset accum/dist.

CS Trading Bot Strategy - Crypto EditionWhat is this strategy about?
The CS Trading Bot Strategy is for researching the most lucrative Crypto assets to be selected for in the corresponding Study (that actually generates alerts/signals).
The Strategy is very profitable for a vast amount of Crypto assets and the algorithm behind is not overfitted.
How to use it?
As a rule of thumb, the best time-frames are the 4h, 3h, 2h and 1h (sometimes 30M and 45M).
For many high profile/volume assets such as BTC, ETH and XRP the Daily is very profitable, as well. Weekly and Monthly time-frames should be avoided.
It is not recommended to apply this strategy to new assets with only a few weeks of history. I recommend a history of at least 6 months and 5 trades in the Strategy stats.
In the Strategy settings, you can adjust the time-span to see how the Strategy performs in certain conditions like bear-markets (see for example 4H on BTCUSDT from Jan 2018 - March 2019).
What to look for on researching?
If you are researching, make sure to look for these metrics in the Strategy overview:
Linear equity growth (especially over a larger period of time)
Low drawdown
Profitability above 50%
Average gain per trade of 5%
A satisfying profit for your selected time-span
Min. 5 trades, better 10
Min. 6 Months time-span
As a head-start, I suggest to research on the following assets, so you get a feeling about what to look for based on the list above:
POLONIEX:BTCUSDT
POLONIEX:ETHUSDT
POLONIEX:XRPUSDT
Why Poloniex? Because it has a long history for these assets...
Once you determined your favorite assets, you are ready to add the corresponding Study and within, set alerts for them.
Here the Webhooks are very interesting as you can forward your signals to your own trading bot or simply wait until my trading bot is available (currently in development)
Since I develop myself, rest assured it will be available soon. Look out for comments below as soon as it is available!
The bot is a commercial package including:
This Strategy for finding the best assets
The Study for setting alerts based on the best assets (webhooks, emails, popups, etc)
Access to our automated trading bot (separate download, as soon as available)
How to access?
If you are interested to get access to the complete package, please don't hesitate to send me a private message for a quote.
The amount of concurrent users using the package (=licenses) is limited to max. 500 a month (more we cannot manually handle has Tradingview has no automation for this yet).
Access to the bot package is based on a monthly basis. If you get access, you will asked in person at the end of the month if you want to continue or not.

QuantCat Chande Swinger StrategyQuantCat Chande Swinger
This strategy is designed to be used on the 1 minute with mainly bitcoin, and cryptocurrencies. But parameters can be adjusted to ANY pair.
After some long research about chande momentum oscillator, I decided to create a strategy using normal distribution percentage levels to snipe entries. This in turn on the 1 minute can create a nice profit over a consecutive amount of days, the end goal is to get a stronger version of this strategy running on a bot and print some money. This strategy is tightly defined, and can be loosened up to make more trades too- giving a higher sample size and better sharpe ratio.
The strategy checks to see if the Chande value is in an extreme percentile based on the last few hundred chande values- if it is it will open a position.
No stoploss or take profit implemented into the swinger yet, but this will be the next addition to really minimise loss and amplify potential profits.
Any liquid crypto pair on the low timesframes will net a good result with this strategy.
We also have a free 15M and 1H strategy available too.
You can join our discord server to get live alerts for the strategies as well as speak to our devs! Link in signature below!!!

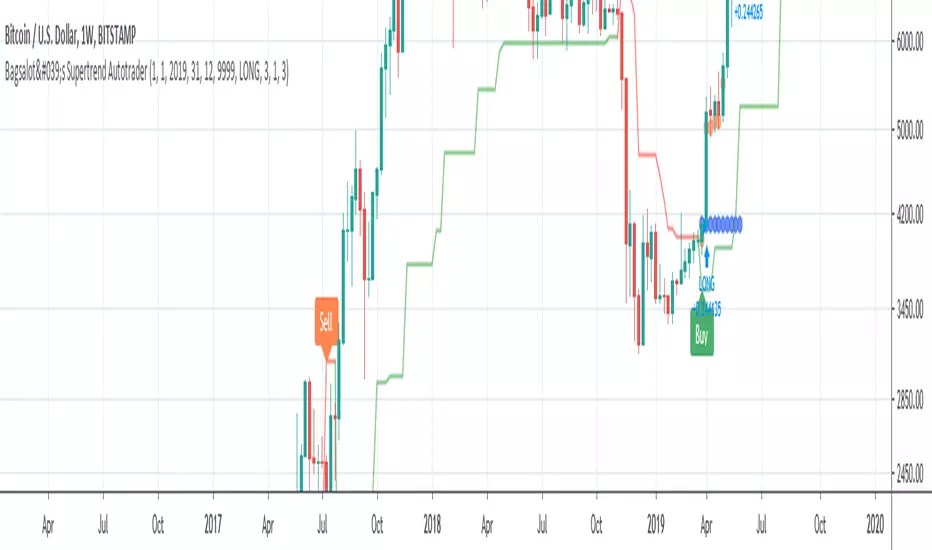
Bagsalot's Supertrend AutotraderTrend reversal indicator with a customizable trailing stop loss. Current model with default values is profitable on most assets (mostly bitcoin) but works on all assets as well. Set total cash invested, % of capital traded and get on to making money :D