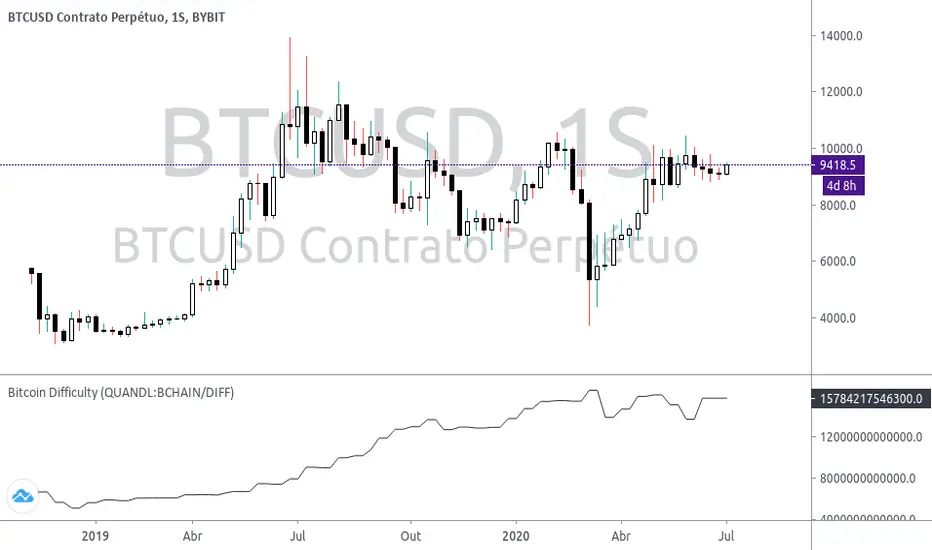
Bitcoin Difficulty (QUANDL:BCHAIN/DIFF)Simple script that graphically represents the mining difficulty of BITCOIN .
Blockchain data made available at QUANDL .
Its logic is simple, search the data in the QUANDL database and plot it on the chart.
Поиск скриптов по запросу "bitcoin"
Bitcoin Hash Rate (QUANDL:BCHAIN/HRATE)Simple script that graphically represents the bitcoin hashrate.
Blockchain data made available at QUANDL .
Its logic is simple, search the data in the QUANDL database and plot it in the graph.

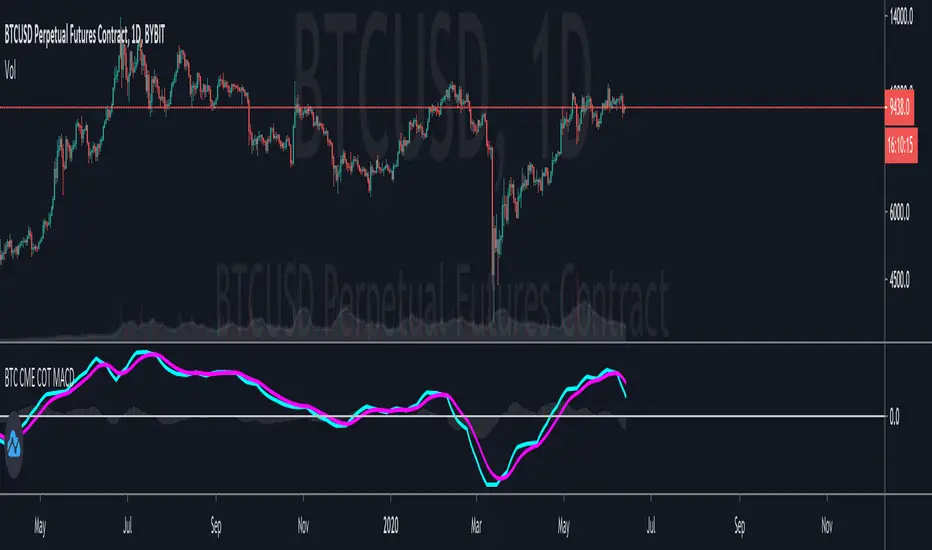
Bitcoin CME Retail vs Professionals MACD
This is an interesting study using the data provided by the Bitcoin CME Commitment of Traders report.
The MACD plot the difference between the Retail Traders positions and the Professional Traders positions.
The general idea is that Professional Traders have a better read on the market than Retail Traders.
The signal line helps to identify the trend that it is moving in.
I believe that this plot helps to visualize the overall market sentiment better than the raw COT data.
Try it out and let me know what you think!
Bitcoin SpreadThis indicator display the current lowest and the highest value of btc on a set of exchanges for a define type of market.
Bitcoin Spread was originally made by @DayTradingItalia, i have bring his indicator to pine v4, add add some stuff to it:
5 Type of BTC Market : USDT Swap, USD and Futures (current/next contract)
Spread value

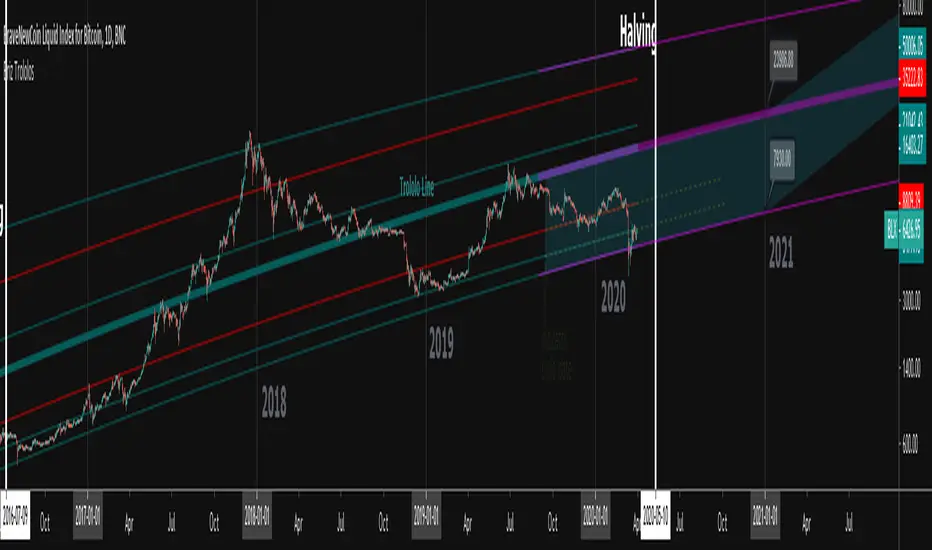
Bitcoin Trololo Lines - Logarithmic Regression for 1D BLXTrololo Lines - Logarithmic Regression lines for Bitcoin with top and bottom ranges. Works only on BLX (BNC) 1 day time frame. Red lines indicate bottom buy range and top sell range. Thickest middle line is the origional "Trololo" or logarithmic regression line.
Bitcoin Futures SentimentMonitors the sentiment across Bitcoin Futures, large discrepancies indicate potential low risk (buy/green) and high risk (sell/red) zones.

Bitcoin halving past datesThis indicator will help everyone to visualize the bitcoin halving effect on different assets

Bitcoin Halving CountdownHello traders,
I offer you today the BTC halving countdown updated in real-time on your charts
I inspired myself greatly from the gentleman @everget's script LTC halving countdown below
(
The countdown date is coming from that source www.bitcoinblockhalf.com.
The halving date is estimated to be around May 13th, 2020 .
That date is hardcoded in the script and is used for the countdown calculation.
The Bitcoin block mining reward halves every 210,000 blocks, the coin reward will decrease from 12.5 to 6.25 coins.
Enjoy the weekend
Dave

Bitcoin Cost Per TransactionHello,
An indicator for Bitcoin, to have the cost per transaction, on a 10 days average.


Bitcoin Production Cost OscillatorFor Trav,
Oscillator version of "Bitcoin Production Cost".
Based on raw data from CBECI.
Follow me to read more about the calculation logic.

Bitcoin Power Law CorridorOpen-source live tracker of Harold Burger's Bitcoin "Power Law Corridor".
Added optional chart fill and labels to show the percentage delta to the regression center-line, support and resistance.

Bitcoin Difficulty Model [aamonkey]This is a model to calculate Bitcoin price based on Difficulty.
How to calculate it:
BDM = (difficulty^0.51) * 0.002
For the difficulty, the daily average is used.

Bitcoin OnChain Metrics @BTC_JackSparrow (O)A series of plots representing Bitcoin on chain metrics like tx volume , hash rate, difficulty and way more from Blockchain.com
How to use? Up to you
Some sources update live, some sources update EOD (end of day)
To use as a non overlay, right click and move to new pane

Bitcoin Prices InfoPanelHello traders
This script is based on the great Ricardo Santos InfoPanel script
It will display all the Bitcoin prices
The script is public so you can adjust according to your own needs
PS
You might have to scroll right on your chart to see the panel
Enjoy :)
Dave


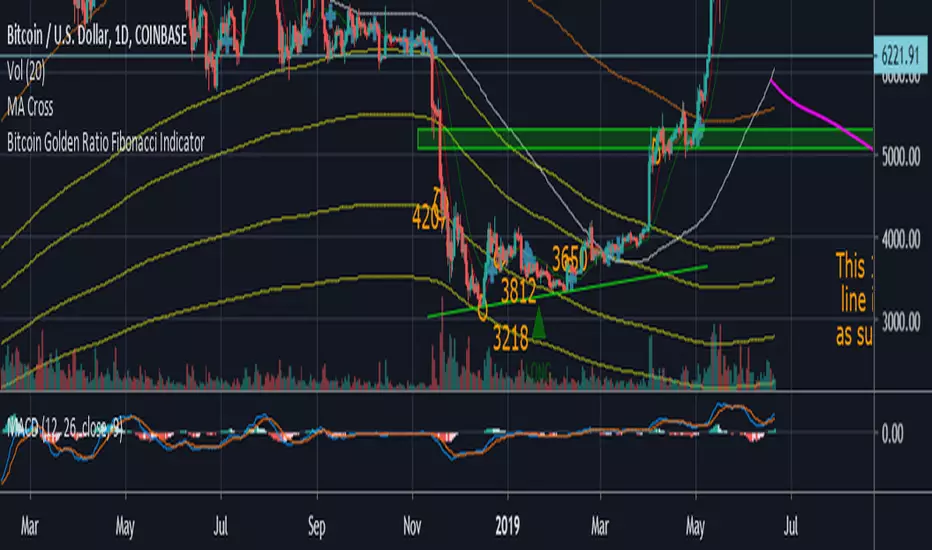
Bitcoin Golden Ratio Fibonacci IndicatorI didn't see this one already it isn't my original idea either. I pulled the formula's from an article on medium, I also added few bear market bottom fib indicators.
Credit to the article I pulled the formula from.
The Golden Ratio Multiplier
Unlocking the mathematically organic nature of Bitcoin adoption
Go to the profile of Philip Swift (@PositiveCrypto)
Philip Swift (@PositiveCrypto)
Jun 17, 2019
By Philip Swift
Release Notes: Fixed spelling error on title, added a couple long and short labels for the top and bottom indicator.
Bitcoin Golden Ratio Multiplier FibonacciA Script based on the wonderful article by Philip Swift (@PositiveCrypto) "The Golden Ratio Multiplier - Unlocking the mathematically organic nature of Bitcoin adoption"
Please read article for understanding use.
Best used on Daily

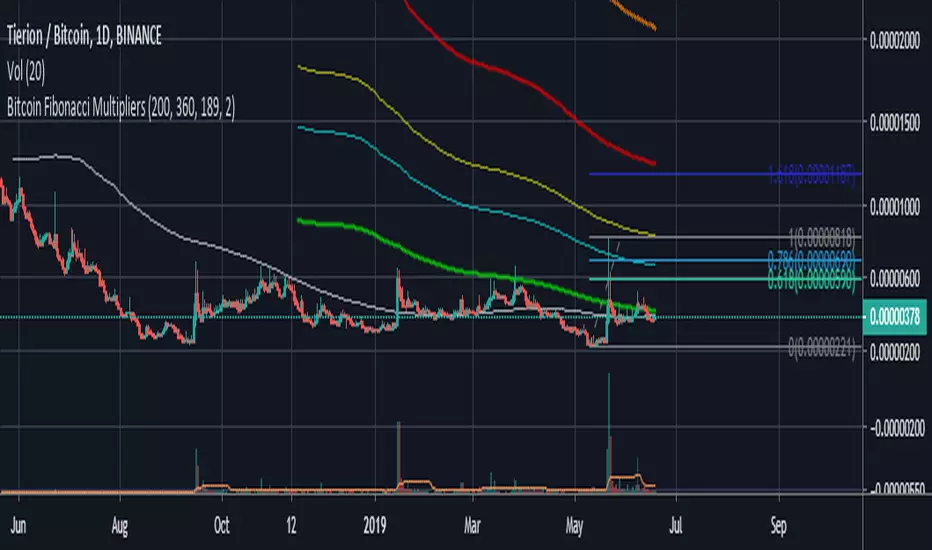
Bitcoin Fibonacci MultipliersShows support and resitance levels based on fibonacci numbers (1.6, 2, 3, 5, 8,13) multiplied by base SMA (daily).
Predicts possible All-time High based on crosses between fibonacci multiplier and faster SMA (daily).
Calibrated to Bitcoin Daily Chart
Bitcoin On-Chain OBVThe Bitcoin On-Chain OBV is a port of the classical volume oscillator that reflects the accumulation registered through the On-Chain Transactions.
It also allows to source through the aggregated combined exchange volumes.
The indicator can show the value either in BTC or USD.

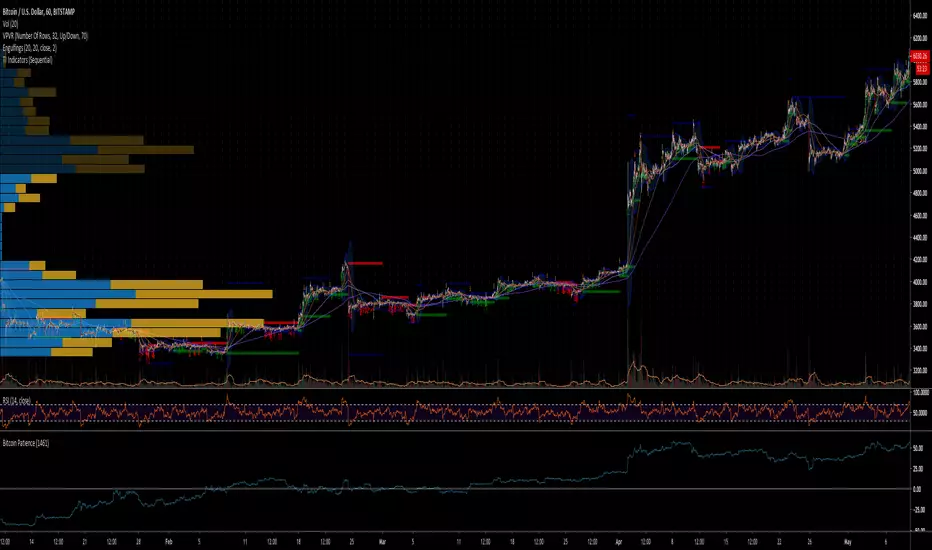
Bitcoin PatienceThis indicator shows how long every Bitcoin buyer ever had to wait to be in profit. Best to use this on the daily chart. At the time of publishing this indicator (May 2019), 1250 days of patience means gains for every BTC buyer ever. Can also be used for other assets of course.
Bitcoin Number of TransactionsThe Bitcoin Number of Transactions plots the amount of transactions registered on-chain on a daily basis.

Bitcoin On-Chain VolumeThe Bitcoin On-Chain Volume is a reflection of the transactional volume registered in the blockchain.
The indicator can show the value either in BTC or USD.
