Triangular Moving Average (TMA) bandsWhat in the world is up folks ??!??
Here's the indicator of the day. Sharing a simple one today because I'm busy coding for a few clients (fun life of a top script author on TradingView)
The TMA bands is an indicator that I discovered on FXCM a few years ago FXCM TMA bands
From the screenshot above, we see that when the price hits the lower band, it's a possible reverse BUY signal. When it hits the upper band, it's a possible SELL signal
Methodology
1) The Take Profit 1 is the middle line, Take Profit 2 is the opposite band.
2) Once the TP1 is hit, set your Stop Loss to breakeven
3) Once the TP2 is hit, if you still want to stay in the trade, set your Stop Loss to the TP1
That's what we call a trailing stop loss which I offered in the Trade Manager : Trade-Manager-Open-Source-Version/
It will be a powerful tool in your arsenal for some scalp/intraday trades
After years of coding for traders, I worked with many brokers/API/languages so I'm very used to convert a script from a broker to another one (shameless self-advertising)
PS
Tomorrow I'll share the Signal version of my Algorithm Builder:
You'll be able to connect it in a single click to a very cool Backtest System made by the Pinescripters community
In other words, I'm selling the scripts to allow you to build your own signals in a few clicks AND to connect it easily to a kick-ass backtesting tool. More to come tomorrow
Hope you'll like it, like me, love it, love me, tip me :)
____________________________________________________________
Feel free to hit the thumbs up as it shows me that I'm not doing this for nothing and will motivate to deliver more quality content in the future. (Meaning... a few likes only = no indicators = Dave enjoying the beach)
- I'm an officially approved PineEditor/LUA/MT4 approved mentor on codementor. You can request a coaching with me if you want and I'll teach you how to build kick-ass indicators and strategies
Jump on a 1 to 1 coaching with me
- You can also hire for a custom dev of your indicator/strategy/bot/chrome extension/python
Поиск скриптов по запросу "bot"

Dollar Cost Average (Data Window Edition)Hi everyone
Hope you had a nice weekend and you're all excited for the week to come. At least I am (thanks to a few coffee but that still counts !!!)
This indicator is inspired from Dollar-Cost-Average-Cost-Basis
EDUCATIONAL POST
The educational post is coming a bit later this afternoon explaining how to use the indicator so I would advise to follow me so that you'll get updated in real-time :) (shameless self-advertising)
1 - What is Dollar-Cost Averaging (DCA)?
Dollar-Cost Averaging is a strategy that allows an investor to buy the same dollar amount of an investment on regular intervals. The purchases occur regardless of the asset's price.
I hope you're hungry because that one is a biggie and gave me a few headaches. Happy that it's getting out of my way finally and I can offer it
This indicator will analyse for the defined date range, how a dollar cost average (DCA) method would have performed vs investing all the hard earnt money at the beginning
2- What's on the menu today ?
Please check this screenshot to understand what you're supposed to see : CLICK ME I'M A SCREENSHOT (I'll repeat this URL one more time below as I noticed some don't read the information on my description and then will come pinging me saying "sir me no understand your indicator, itz buggy sir"
(yes I finally thought about a way to share screenshots on TradingView, took me 4 weeks, I'm slow to understand things apparently)
My indicator works with all asset classes and with the daily/weekly/monthly timeframes
As always, let's review quickly the different fields so that you'll understand how to use it (and I won't get spammed with questions in DM ^^)
- Use current resolution : if checked will use the resolution of the chart
- Timeframe used for DCA : different timeframe to be used if Use current resolution is unchecked
- Amount invested in your local currency : The amount in Fiat money that will be invested at each period selected above
- Starting Date
- Ending Date
- Select a candle level for the desired timeframe : If you want to use the open or close of the selected period above. Might make a diffence when the timeframe is weekly or monthly
3 - Specifications used
I got the idea from this website dcabtc.com and the result shown by this website and my indicator are very interesting in general and for your own trading
The formula used for the DCA calculation is that one : Investopedia Dollar Cost Average
4 - How to interpret the results
"But sir which results ??"...... those ones : CLICK ME I'M A SCREENSHOT :) (strike #2 with the screenshot)
It will draw all the plots and will give you some nice data to analyze in the Data Window section of TradingView
I'm not completely satisfied with the tool yet but the results are very closed to the dcabtc website mentioned above
If you're trading a very bullish asset class (who said crypto ?), it's very interesting to see what a DCA strategy could bring in term of performance. But DCA is not magic, there is a time component which is the day/week/month you'll start to invest (those who invested in crypto beginning of 2018 in altcoins know what I'm talking about and ..............will hate me for this joke)
5 - What's next ?
As said, the educational post is coming next but not only.
Will probably post a strategy tomorrow using this indicator so that you can compare what's performing best between your trading and a dollar cost average method
I'll publish as a protected source this time a more advanced version of that one including DCA forecasts
6 - Suggested alternative (but I'll you doing it)
If you don't want to have this panel in the bottom with the plots and analyze the results in the data window, you can always create an infopanel like shown here Risk-Reward-InfoPanel/ and display all the data there
Hope you'll like it, like me, love it, love me, tip me :)
____________________________________________________________
Feel free to hit the thumbs up as it shows me that I'm not doing this for nothing and will motivate to deliver more quality content in the future. (Meaning... a few likes only = no indicators = Dave enjoying the beach)
- I'm an offically approved PineEditor/LUA/MT4 approved mentor on codementor. You can request a coaching with me if you want and I'll teach you how to build kick-ass indicators and strategies
Jump on a 1 to 1 coaching with me
- You can also hire for a custom dev of your indicator/strategy/bot/chrome extension/python


Brandon BollSecond day at Pinescript and I am attempting to tweak the Bollinger Bands directed strategy to send alerts to Zignaly in order to automate long buy/sells.
I've left in the short script though for completeness.
The buy and sell instructions work perfectly but I don't know how to do a cancel order alert (as included in the original strategy)

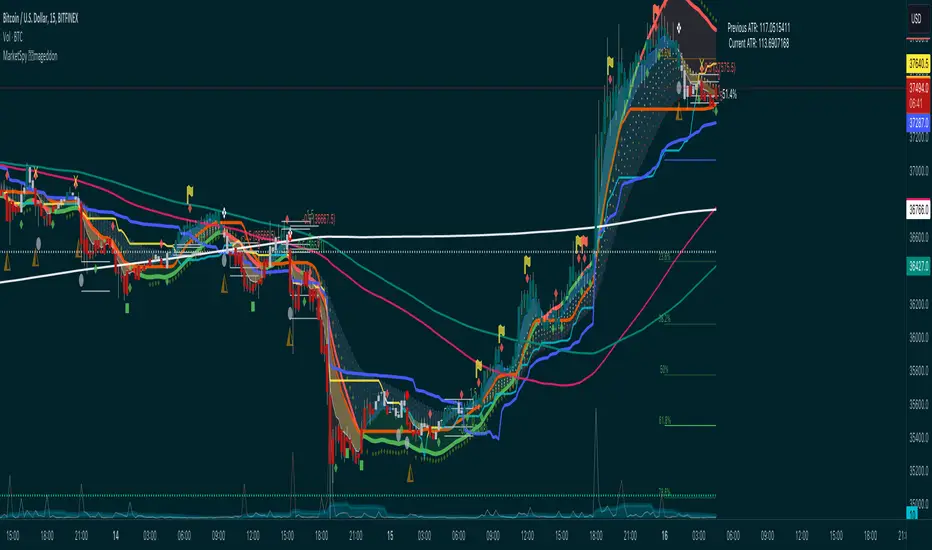
MarketSpy ARmageddonMarketSpy trading suite was designed to sniff out momentum swings and allow you to profit riding the wave. No matter what market, no matter the timeframe - this is all you need, from here on out this is your trading desk.
It's made up of three main components (with future add-ons in development):
1. MarketSpy X - the ultimate entry and exit tool that is built using custom momentum algorithm to find exact moments of reversals - without a fail. It's the one on the bottom with "green pulse dot" buy signals and "blood diamond" sell indicators.
2. MarketSpy ARmageddon (Augmented Reality) - price action overlay that analyses trends and is a confirmation tool for MarketSpy X. Can show confluence from top 5 market indicators, gives signals of reversals or chop zones, predicts prices(!) and is fully dynamic that reacts to market conditions LIVE.
3. MarketSpy S/R - This thing sniffs out and draws support and resistance based on math, not human eye. This means that MarketSpy effectively can go head to head with bots and algorithms and see right through the market to give you incredibly accurate points of interest where machines and humans sell and buy - ride the way together with the whales. Sounds cliche until you try it.
For more - visit our discord.
MarketSpy XMarketSpy trading suite was designed to sniff out momentum swings and allow you to profit riding the wave. No matter what market, no matter the timeframe - this is all you need, from here on out this is your trading desk.
It's made up of three main components (with future add-ons in development):
1. MarketSpy X - the ultimate entry and exit tool that is built using custom momentum algorithm to find exact moments of reversals - without a fail. It's the one on the bottom with "green pulse dot" buy signals and "blood diamond" sell indicators.
2. MarketSpy ARmageddon (Augmented Reality) - price action overlay that analyses trends and is a confirmation tool for MarketSpy X. Can show confluence from top 5 market indicators, gives signals of reversals or chop zones, predicts prices(!) and is fully dynamic that reacts to market conditions LIVE.
3. MarketSpy S/R - This thing sniffs out and draws support and resistance based on math, not human eye. This means that MarketSpy effectively can go head to head with bots and algorithms and see right through the market to give you incredibly accurate points of interest where machines and humans sell and buy - ride the way together with the whales. Sounds cliche until you try it.
For more - visit our discord.

MarketSpy S/RMarketSpy trading suite was designed to sniff out momentum swings and allow you to profit riding the wave. No matter what market, no matter the timeframe - this is all you need, from here on out this is your trading desk.
It's made up of three main components (with future add-ons in development):
1. MarketSpy X - MSX is the ultimate entry and exit tool that is built using custom momentum algorithm to find exact moments of reversals - without a fail. It's the one on the bottom with "green pulse dot" buy signals and "blood diamond" sell indicators. With a little bit of common sense, this alone will turn your trades into profit instantly.
2. MarketSpy ARmageddon (Augmented Reality) - price action overlay that analyses trends and is a confirmation tool for MarketSpy X. Can show confluence from top 5 market indicators, gives signals of reversals or chop zones, predicts prices(!) and is fully dynamic that reacts to market conditions LIVE.
3. MarketSpy S/R - This thing sniffs out and draws support and resistance based on math, not human eye. This means that MarketSpy effectively can go head to head with bots and algorithms and see right through the market to give you incredibly accurate points of interest where machines and humans sell and buy - ride the way together with the whales. Sounds cliche until you try it.
For more - visit our discord.

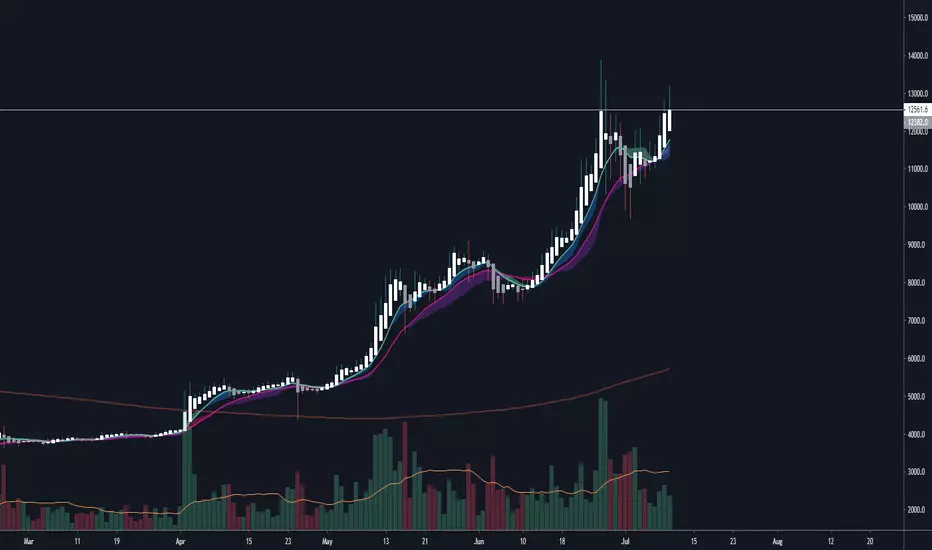
kiska cloudskiska clouds: crypto twitter's next cloud meme
Crypto is a fast-paced, highly-volatile asset, therefore, many traditional strategies are thrown out of the window when applied to cryptocurrency markets. In trading, there are only two things known for sure: price and volume. Price and volume data is then manipulated using various math equations in an effort to discover patterns and/or make predictions. kiska clouds are no different.
The kiska clouds are a simple crossover strategy. The clouds are different because of the unique averages being used and the embedded momentum indicator.
To use the clouds is simple:
When the green line crosses above the pink line, you buy/long.
When the green line crosses below the pink line, you sell/short.
The clouds are indicative of the trend's momentum. Using the power of math, the larger the cloud indicates a higher amount of buying/selling pressure. As the cloud thins, momentum is slowing, and the trend may be reversing.
At the time of testing, the strategy had a profitability of 54.55% accuracy with 1133.41% net profit. While I think this could be automated into a bot, adding a human element with stop losses and further analysis will significantly improve the accuracy/profitability.
This indicator is a "Pay What You Want" model. For a trial or to purchase this indicator, send me a message on Twitter @moonkiska or here on TradingView. You will be granted a 2-3 day trial period to the backtesting strategy.
Tips:
The higher the time frame, the more accurate the strategy.
Personally, I do not short above the 200MA. I do not long below the 200MA.
Coming Soon:
Support/Resistance
Trend Lines
MADMEX XBTUSD (1.6 + Hedge)I thought I share some progress on the lastest version of my Madmex XBTUSD trading setup.
The backtest data actually matches 95% with the real live trading of the past few months. This strategy is trading in a real/production environment for a while now and the numbers add up.
Improvements
- Dynamic Position Sizing
- Adaptive ATR Exits and Take Profit Orders
- Adaptive Pyramid Buying based on Liquidity and Bitmex Order Book Data
- Hedging / 1x Short Algorithm
Here the last two trades from the live trading environment:
imgur.com

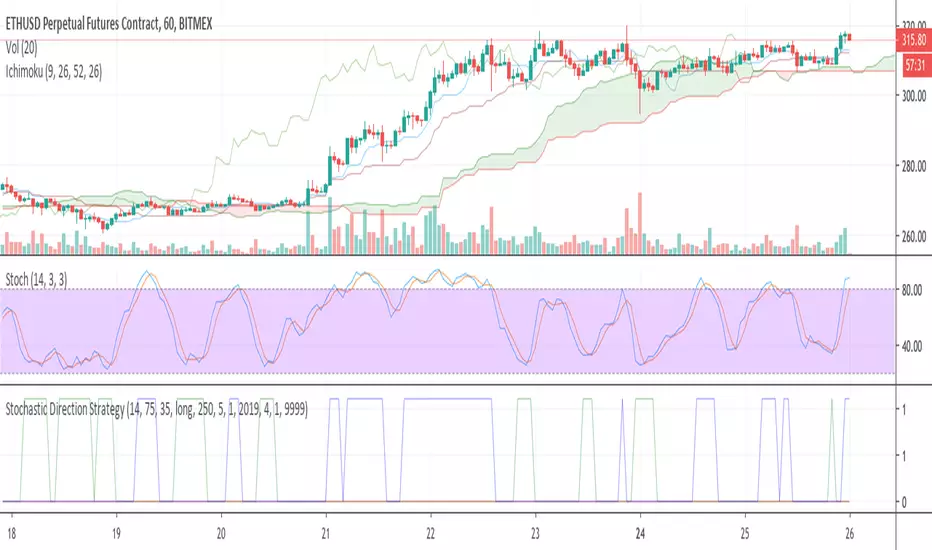
Stochastic Direction StrategyThis is a simple strategy based on the Stochastic Oscillator: stockcharts com/school/doku.php?id=chart_school:technical_indicators:stochastic_oscillator_fast_slow_and_full
Its purpose is to gradually build a position in a trending market (as of June 26th 2016 in most cryptocurrencies).
Inputs:
- direction (long/short)
- overbought/oversold
- close positions (yes/no to only increase positions)
Outputs:
- buy/sell/close signals plotted on a chart below
This script can easily be used as a TradingView study (for alerts) and a strategy (for backtesting). See the comments in the code.
I have added additional alert conditions to be used easily together with a trading bot reading the signals
Yet obviously you can also do manual trading on each alert.
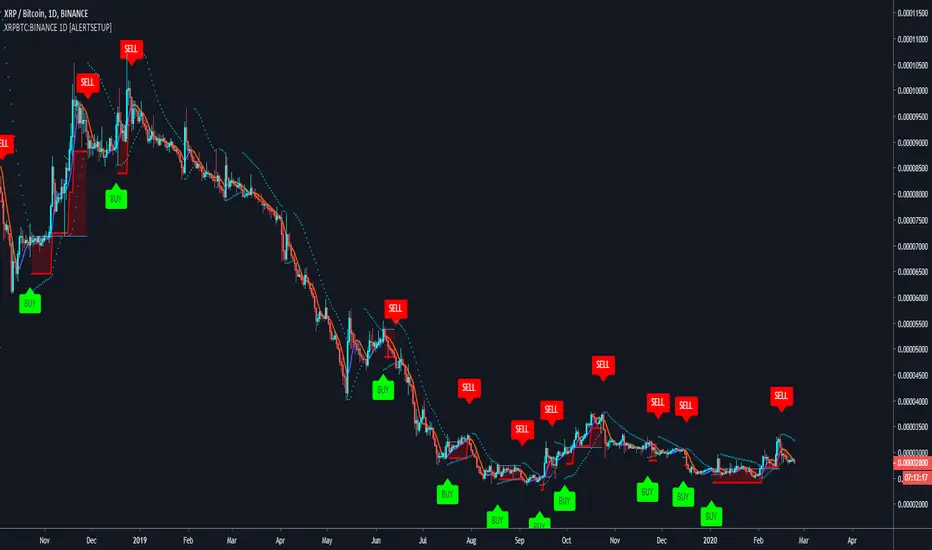
Buy & Sell XRPBTC:BINANCE 1D Trading BotWith this indicator you can create Buy and Sell alerts to automate your trading.
Optimised for BINANCE:XRPBTC in a 1D timeframe.
> > > READ HOW IT WORKS < < <
The goal of trading XRP against BTC is to increase your amount of BTC. XRP is in the top 5 Coins of all time.
Built upon my generic indicator Cyatophilum Altcoins Trader , this Strategy creates buy and sell signals to can be used for manual or automated trading.
This strategy using a combination of Parabolic SAR and Tilson T3 Line , which is a strong tool to buy at the right time . An integrated 10% trailing stop loss will reduce the risk!
Sell and save your founds instead of simply holding over time.
Results below are calculated using 100% equity from a 10 000$ capital and a 0.05% commission fee on each trade.
> > > READ HOW TO USE < < <
> Get access to the Cyatophilum Indicators <
Quad Moving AvgeragesHello Fellow Traders!
-------------------------------------------
This is the newest addition to Gnome Alerts PRO!
Trade Moving Average Breakouts with Minimal Drawdon.
This Bot Script works on all Crypto, Leverage, Forex, & Traditional Exchanges.
FEATURES
------------------------
*Autoview Ready*
- Easy to Use
- Backtesting Included
-Take Profit
- Stop Loss
You can get access to any of my scripts by visiting my Website, link is in Tradingview Bio ... Just click on the Gnome!

Crypto4Fun Gunbot Script #1This script provides a trigger for Gunbot (or any other bot) combining different indicators on 2 timeframes as follows :
1) on the timeframe of the chart : ichimoku and SMA-spread
2) on the higher timeframe : DI+ and DI- ==> you can select your preferred higher timeframe, preferrably higher than the timeframe of the current chart
All parameters are configurable
Workinstructions :
Add the script to your chart
Move the shown indicator to a window below
Set the email alert as follows : 'plot' value crosses over 95
Feedback and suggestions are welcome

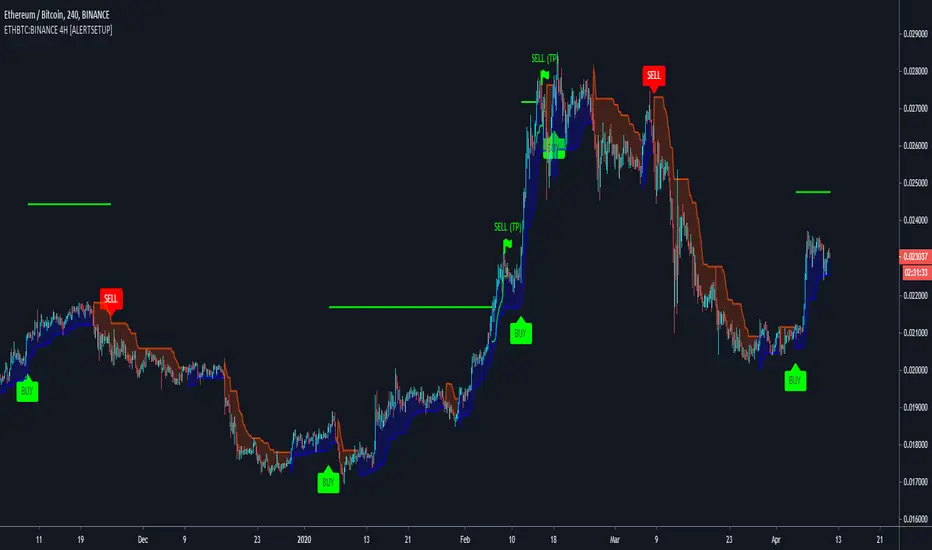
Buy & Sell - ETHBTC:BINANCE 4H Trading BotWith this indicator you can create Buy and Sell alerts to automate your trading.
Optimised for BINANCE:ETHBTC in a 4H timeframe.
> > > READ HOW IT WORKS < < <
The goal of trading ETH against BTC is to increase your amount of BTC. ETH is in the top 5 Coins of all time and its bull rallies are really fast and volatile so it's very important not to miss them!
Built upon my generic indicator Cyatophilum Altcoins Trader , this Strategy creates buy and sell signals to can be used for manual or automated trading.
The year 2019 started with the end of a bull run, and the script was able to catch 29% of profits. Then in Februrary, we saw another rally, but this one dropped fast and the script caught 4% of profits. Until then, two opportunities of trade triggered but ended up as a loss, as the bear market continued. In total, it made 33% of profit and 9.5% of loss . The fact that a bear market has be going on for +3 months is a good thing for what will happen next.
I think we all remember how 2018 was for ETH. It had the most insane rally of all time, another one in April-May then 6 months of bear market. Oh! by the way, did I say the script has an integrated trailing stop loss starting at 4%? Those are the green dots below the price.
I used TradingView's Strategy Tester with historical data starting from 2017-08. Results are calculted using 100% equity from a 10 000$ capital and a 0.05% commission fee on each trade.
See the results below.
> > > READ HOW TO USE < < <
> Get access to the Cyatophilum Indicators <
Buy & Sell - BTCUSD:COINBASE 2H Automated StrategyWith this script you can create Buy and Sell alerts to automate your trading.
> > > READ HOW IT WORKS < < <
> > > HOW TO USE < < <
Get the indicator today !


Main Indicators @ MadnessCryptoInspired by veteran contributors of tradingview
Indicators list:
1. Main indicators: Moving average collection, Ichimoku, Bollinger Bands, fibonanci, simplize candlestick price action...
2. Price Action indicators: Candlesticks of (almost) any kinds. Harmonic Patterns: ABCD, Alt Bat, Butterfly, Crab, Wolf Wave, Head and Shoulders, Triangle...
3. Advanced indicators: top/bot finder, breakout detector, unpopular indicators
4. Signal & backtest tools: focus on two main factors: percent profitable & profit factor
Cheers,
Madness Crypto
-----------------------------------------------------------
Incase if those's scripts are useful, you can buy me a coffee
ETH & ERC20 tokens: 0xA2F57Cc46A5268F16A0224a81EDe7154218Ce890
Bitcoin: 1PTSbWK6snVSULBXhfx5TD9pJkkYCDe4PC
Binance & BEP2 tokens: bnb1tlxgpnguzq0w3w6myhd0t3d2j9wqd2pzpkudpc

Crocodile RiverCrocodile River Indicator
Marsu Indicator System demo Automate trading using Tradingview. Build trading bots for bitcoin, altcoins, forex, stocks and more...
Telegram@Marsu

Ethereum Automated Strategy - Bitfinex - 3HHello guys !
Here is a ready to use BITFINEX:ETHBTC Automated Strategy with Long and Short Alerts !
You can see the backtest below using 100% equity of 10 000$, 0.1% commission, long and short trades with no leverage.
Indicator used
Leave a comment to get your trial !
or
Get the indicator today !

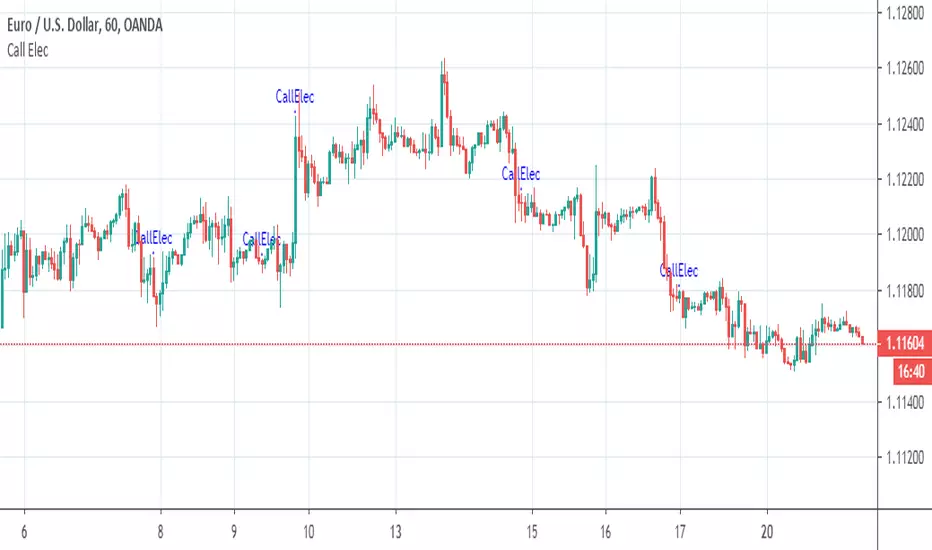
Call ElecCall Elec Automate trading using Tradingview. Build trading bots for bitcoin, altcoins, forex, stocks and more...
Call MarsuCall Marsu Indicators Automate trading using Tradingview. Build trading bots for bitcoin, altcoins, forex, stocks and more...

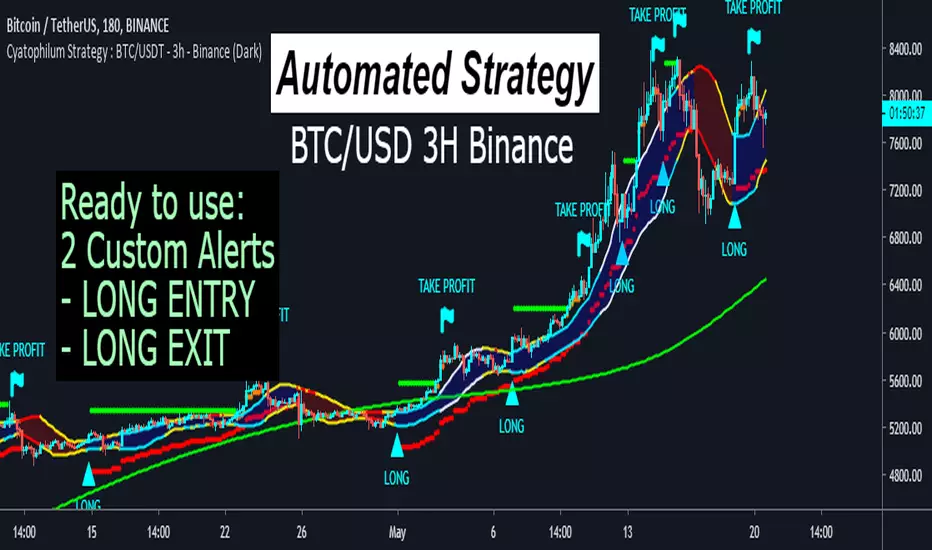
Automated Bitcoin Binance Strategy - RIP HODLERSBuilt upon my latest script
Already configured for BINANCE:BTCUSDT in 3H timeframe.
Backtest results below using 100% equity of 10 000$, 0.05% commission, and only buy and sell trades.
Leave a comment to get your trial
or
Get the indicator today !