2 bearish candles above the 8 EMAYou will get a signal when:
Candle n-1 is bearish
Candle n is bearish
Candle n closes above the 8EMA
All on 30-minute timeframe
Поиск скриптов по запросу "candle"


Pullback Candle (Bullish & Bearish, No EMA)🔍 Purpose
This indicator detects simple pullback reversal patterns based on price action and swing highs/lows — without any moving average or trend filters.
It highlights:
Bullish pullbacks (potential bounce/long setups)
Bearish pullbacks (potential rejection/short setups)
📈 Bullish Pullback Criteria
Three-bar pattern:
Bar 3: Highest close
Bar 2: Lower close
Bar 1: Even lower close
Current bar closes above previous bar (bullish reversal)
One of the last two candles is the lowest low of the past 6 bars (swing low)
📍 Result: A small green cross is plotted below the bar, and the bar is colored green.
📉 Bearish Pullback Criteria
Three-bar pattern:
Bar 3: Lowest close
Bar 2: Higher close
Bar 1: Even higher close
Current bar closes below previous bar (bearish reversal)
One of the last two candles is the highest high of the past 10 bars (swing high)
📍 Result: A small red cross is plotted above the bar, and the bar is colored red.
🔔 Alerts
One alert condition each for bullish and bearish pullback detection.
Can be used to trigger TradingView alerts.
🛠️ Customization
No inputs — fully automated logic
Clean, minimal, and fast
Can be extended with labels, alert sounds, or signals

Largest Candles with Price DifferenceThis script shows the largest move on a candle on a particular time frame. So if you are looking at the 10-minute chart, it will tell you what the largest 10-minute candle has been in the past.

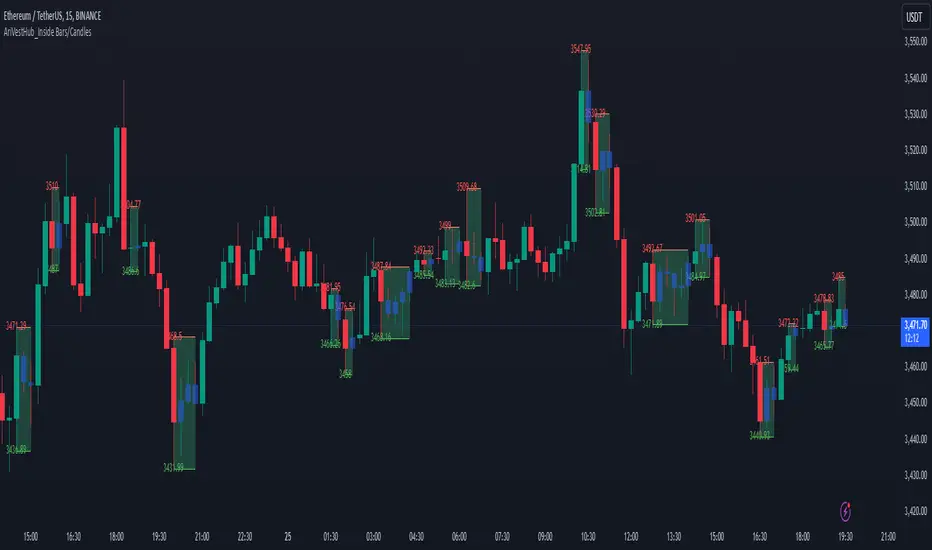
AriVestHub_Inside Bars/Candles
Introduction:
This script identifies and marks inside bars on your TradingView charts. An inside bar pattern is a two-bar candlestick pattern where the second bar is entirely within the range of the first bar. This pattern often signals consolidation and can indicate a potential breakout or trend continuation.
Trading Signals:
Inside bars can indicate potential trading signals. Traders often watch for breakouts above or below the inside bar to identify potential entry points.
Customization:
You can customize the colors, styles, and labels to suit your preferences.
Conclusion
This script is a useful tool for traders looking to identify inside bar patterns on their TradingView charts. By highlighting these patterns, traders can make more informed trading decisions based on potential market consolidations and breakouts.
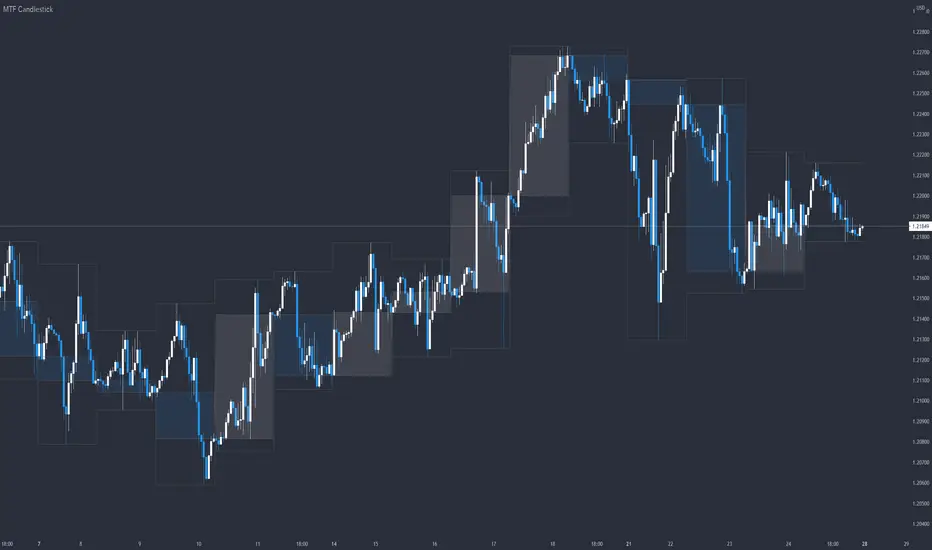
MTF CandlestickOne of the most important thing to understand in order to estimate the trend direction and its continuation is how the lower time frame candlesticks have been formed.
There are many processes by which candlesticks have been formed even if same size.
So in this script, daily candlestick is overlapped on the currently chart as default, and that can be changed.
Only real body is shown so as not to interfere with the currently chart.
Fixing Volume Visualization (only fixing candles)This simple script shows only the fixing candles (by default, 5 PM UTC) and attaches a label with the volume value on each of them. It’s useful if you want to analyze volume behavior specifically during the fixing – for example, to compare institutional activity across days, Wednesdays, or months.
You can:
• set a custom date range (from–to),
• change the fixing hour if needed,
• easily modify colors, labels, or volume thresholds.
It hides everything except the fixing candles – giving you a clean, focused view.

Large Candle HighlightHighlights candles whose range exceeds a specified threshold by shading the chart background.
This indicator is designed to visually identify unusually large price movements without generating trade signals.
キャンドルの長さを設定し、数値以上なら背景をハイライトするインジケーターです。

Avg Candle Size (Ticks) – Last N Closed Barsaverage last 5 candles only useful if you are me really sorry

Avg Candle Size Table (Ticks) The average of the last N candles in ticks shown on a table in the top right of the chart


Previous Candle 50% line The intention of this is to mark the 50% mark of the previous candle. My use is to set stops and to spot reversals coming from the STRAT to see in real time 2's going 3

Two Candle Comparison - TMPThis about comparison two candles in chart and gives some idea for entry. this is most suitable for 4H chart

Custom Candle Colors by Day (Full Week)Highlight specific daily candles a different color (Monday - Sunday)
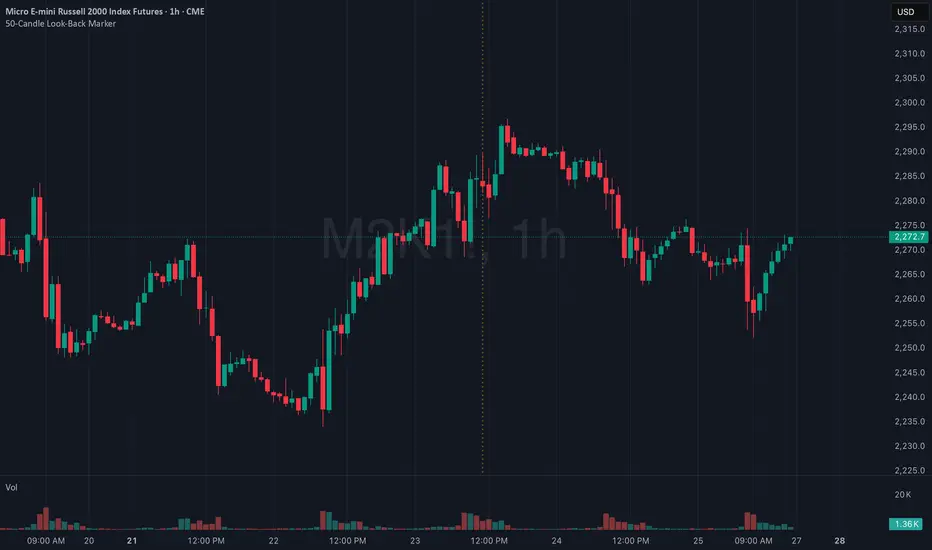
50-Candle Look-Back MarkerIt simply redraws one vertical dotted line that always sits exactly 50 bars behind the current bar, so you can check at a glance that any trend-line you draw has at least 50 candles of data to the right of it.
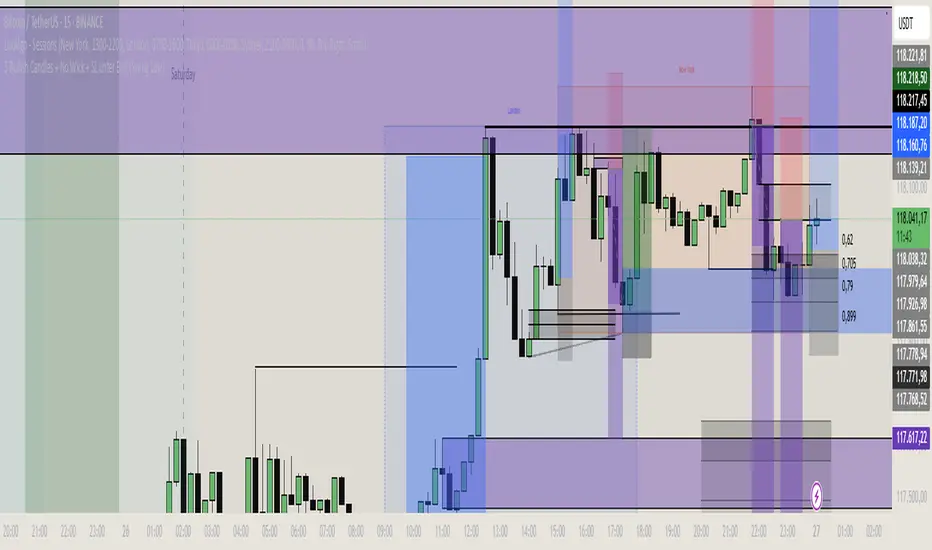
3 Bullish Candles + No Wick + SL unter BoS (Swing Low)1m strategie basierend auf price action and volume candle sticks
Real Open/Close Ticks for Heiken Ashi CandlesJapanese candle open and close prices. Good if you're using a HeikenAshi chart and you want to see real opens and closes.
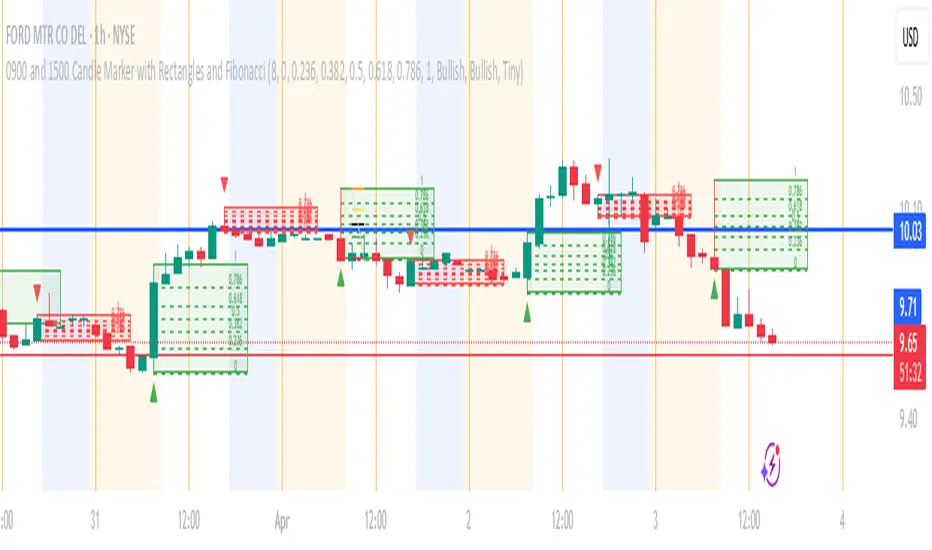
0900 and 1500 Candle Marker with Rectangles and FibonacciWelcome to the Indicator
// This tool is designed to help you analyze stock - crypto - or futures charts on TradingView by marking specific times - 9:00 AM and 3:00 PM (Eastern Time) - with colored rectangles and optional Fibonacci levels.
// It is perfect for spotting key moments in your trading day - like market opens or afternoon shifts - and understanding price ranges with simple lines and numbers.
// Whether you are new to trading or just want an easy way to visualize these times - this indicator is here to assist you.
//
// What It Does
// - Draws a green rectangle at 9:00 AM and a red rectangle at 3:00 PM on your chart - based on Eastern Time (America/New_York timezone).
// - Adds dashed lines inside these rectangles (called Fibonacci levels) to show important price points - like 0.236 or 0.618 of the rectangle’s height.
// - Places numbers on these lines (e.g. "0.5") so you can see exactly what each level represents.
// - Works on different chart types (stocks - crypto - futures) and adjusts for futures trading hours if needed.
// - Is designed to work best on timeframes of 1 hour or shorter (like 1-hour - 30-minute - 15-minute - 5-minute - or 1-minute charts) - where you can see the 9:00 AM and 3:00 PM candles clearly.
// - Lets you customize what you see through a settings menu - like hiding some lines or changing colors.
YOU MAY NOT MONETIZE
ANY PORTION OF THIS CODE.
WE ARE ALL IN THIS THING TOGETHER TO WIN.
BE A BLESSING ONTO THE WORLD AND GIVE.:)
Plot Closed CandlesOnly shows closed candles
( You must turn off normal candles first by right clicking on the candles , going to setting , and turning borders , bodies , and wicks off

xRaymon's Body Candle Indicator
Shows a triangle above candles that satisfy a desired body size (%).
The default body size is 85%.
Lowering or increasing the precentage significantly affects to precision.
I do not recommend lowering the default value.

10% CandlesThe 10% Candles indicator tags all candles which have a 10% or more gain/loss
gains are calculated based on the open and high for green candles
losses are calculated based on the open and low for red candles
you can change the percentage in settings, default value is 10%. this would be the minimum gain/loss percentage
0.1 => 10%
0.2 => 20%
hover over the triangle to see the actual gain/loss percentage
Base Candle Detector//@version=6
indicator("Base Candle Detector", overlay=true)
// Calculate candle metrics
bodySize = math.abs(close - open)
totalRange = high - low
// Define base as body being 50% or less of total range
// v6 maintains the logic but ensures cleaner internal boolean evaluation
isBase = bodySize <= (totalRange * 0.5)
// Plotting the shape above the candle
plotshape(isBase,
title="Base Candle",
style=shape.diamond,
location=location.abovebar,
color=color.yellow,
size=size.small)

VPE Candle Patterns with Volume ConfirmationPattern Detection Logic:
Doji — Body is ≤10% of the candle range (adjustable)
Hammer — Body in upper third, lower wick ≥2x body size, minimal upper wick
Shooting Star — Body in lower third, upper wick ≥2x body size, minimal lower wick
Volume Confirmation:
Patterns only trigger signals when volume > volume (current candle volume exceeds previous)
Alerts:
Four alert conditions you can configure in TradingView:
Doji Detected
Hammer Detected
Shooting Star Detected
Any Pattern Detected (combined)
Visual Elements:
Labels on chart (D, H, SS) — toggleable
Optional background highlighting
Info table showing current bar status
To set up alerts in TradingView:
Add the indicator to your chart
Right-click → Add Alert
Select the indicator and choose which alert condition
Configure your notification method (webhook, email, app push, etc.)
The input parameters let you tune sensitivity — tighten the dojiBodyRatio for stricter doji detection, or adjust wick ratios if you're getting too many/few signals.
