10-2 Year Treasury Yield Spread by zdmreLong-term bond yield reflects inflation. Short-term bond yields are tools used to predict Fed's interest rate policy. Spread between the two represents four cycles of an economy.
1. Growth
Short-term yield rises as interest rates rise. Spread narrows.
2. Slow growth
Central bank raises interest rates faster and short-term yield exceeds long-term yield. Spread turns negative.
3. Recession
High interest rates lead to more defaults. Inflation caps consumption. Central bank lowers interest rate to stimulate the economy and short-term yield falls. Spread widens.
4. Recovery
Central bank continues easing. Spread remains wide and yield curve remains steep.
0 = Recession Risk
2.6 = Recovery Plan
DYOR
Поиск скриптов по запросу "curve"

I11L OIL BotThe System makes use of the Bolinger Bands strategy from TradingView and implements simple Money Management Rules like SL and TP.
You can adjust the following Parameters:
Leverage: Leverage.
Risk Capital per Trade: The amount you are willing to lose per Trade, keep in mind that changes in Leverage should follow changes in Risk Capital.
TP_Factor: Default is 2:1 Risk:Reward, you might want to adjust this according to the underlying market.
InvertBuyLogic: Inverts the Logic of the System, important for checking if you have a true performance advantage from using the System. I look for a flat looking Curve in the wrong mode.
LookbackDistance: The distance your standart Deviation is refering to. A Lookback Distance too big might result in very few signals.
DevMult: We only want outliers, so we multiply our standart Deviation Bands by a Factor.

Pareto DistributionBasic Pareto distribution!
This is a simple exponential curve set on the 1 minute timeframe.
Three different gradients are used in the example image.

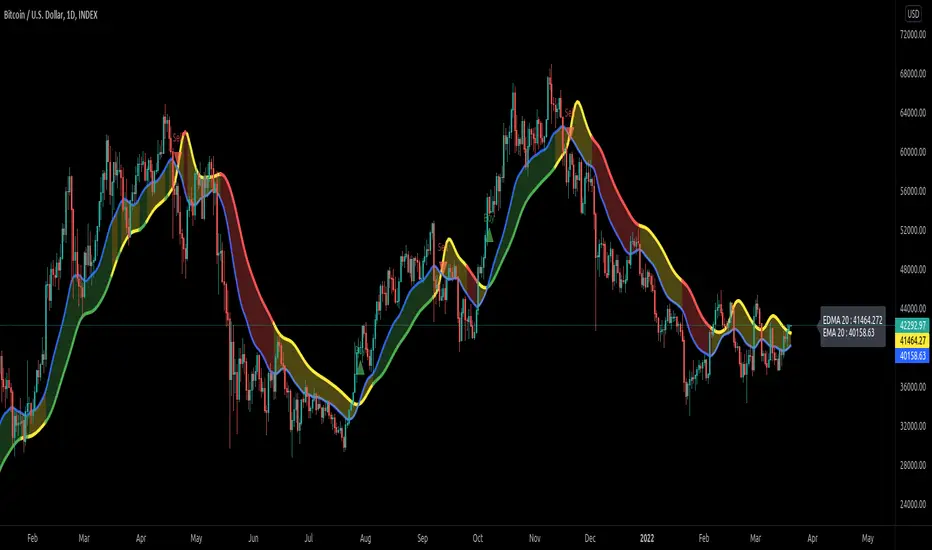
Exponentially Deviating Moving Average (MZ EDMA)Exponentially Deviating Moving Average (MZ EDMA) is derived from Exponential Moving Average to predict better exit in top reversal case.
EDMA Philosophy
EDMA is calculated in following steps:
In first step, Exponentially expanding moving line is calculated with same code as of EMA but with different smoothness (1 instead of 2).
In 2nd step, Exponentially contracting moving line is calculated using 1st calculated line as source input and also using same code as of EMA but with different smoothness (1 instead of 2).
In 3rd step, Hull Moving Average with 3/2 of EDMA length is calculated using final line as source input. This final HMA will be equal to Exponentially Deviating Moving Average.
EDMA Advantages
EDMA's main advantage is that in case of top price reversal it deviates from conventional EMA of 2*Length. This benefits in using EDMA for EMA cross with quick signals avoiding unnecessary crossovers. EDMA's deviation in case of top reversal can be seen as below:
EDMA presents better smoothened curve which acts as better Support and resistance. EDMA coparison with conventional EMA of 2*length of EDMA is as follows.
Additional Features
EMA Band: EMA band is shown on chart to better visualize EMA cross with EDMA.
Dynamic Coloring: Chikou Filter library is used for derivation of dynamic coloring of EDMA and its band.
Alerts: Alerts are provided of all trade signals. Weak buy/sell would trigger if EMA of 2*EDMA_length crosses EDMA. Strong buy/sell would trigger if EMA of same length as of EDMA crosses EDMA.
Trade Confirmation with Chikou Filter: Trend filteration from Chikou filter library is used as an option to enhance trades signals accuracy.
Defaults
Currently default EDMA and EMA1 length is set to 20 period which I've found better for higher timeframes but this can be adjusted according to user's timeframe. I would soon add Multi Timeframe option in script too. Chikou filter's period is set to 25.
Template Trailing Strategy (Backtester)💭 Overview
+ Title: Template Trailing Strategy (Backtester)
+ Author: Iason Nikolas (jason5480)
+ License: CC BY-NC-SA 4.0
💢 What is the "Template Trailing Strategy (Backtester)" ❓
The "Template Trailing Strategy (Backtester)" (TTS) is a back-tester orchestration framework. It supercharges the implementation-test-evaluation lifecycle of new trading strategies, by making it possible to plug in your own trading idea.
While TTS offers a vast number of configuration settings, it primarily allows the trader to:
Test and evaluate your own trading logic that is described in terms of entry, exit, and cancellation conditions.
Define the entry and exit order types as well as their target prices when the limit, stop, or stop-limit order types are used.
Utilize a variety of options regarding the placement of the stop-loss and take-profit target(s) prices and support for well-known techniques like moving to breakeven and trailing.
Provide well-known quantity calculation methods to properly handle risk management and easily evaluate trading strategies and compare them.
Alert on each trading event or any related change through a robust and fully customizable messaging system.
All of the above makes TTS a practical toolkit: once you learn it, many repetitive tasks that strategy authors usually re-implement are eliminated. Using TradingView’s built-in backtesting engine makes testing and comparing ideas straightforward.
By utilizing the TTS one can easily swap "trading logic" by testing, evaluating, and comparing each trading idea and/or individual component of a strategy.
Finally, TTS, through its per-event alert management (and debugging) system, provides an automated solution that supports live trading with brokers via webhooks.
NOTE: The "Template Trailing Strategy (Backtester)" does not dictate how you can combine different indicator types. Thus, it should not be confused as a "Trading System", because it gives its user full flexibility on that end (for better or worse).
💢 What is a "Signal Indicator" ❓
"Signal Indicator" (SI) is an indicator that can output a "signal" that follows a specific convention so that the "Template Trailing Strategy (Backtester)" can "understand" and execute the orders accordingly. The SI realizes the core trading logic signaling to the TTS when to enter, exit, or cancel an order. A SI instructs the TTS "when" to enter or exit, and the TTS determines "how" to enter and exit the position once the Signal Indicator generates a signal.
A very simple example of a Signal Indicator might be a 200-day Simple Moving Average Signal. When the price of the security closes above the 200-day SMA, a SI would provide TTS with a "long entry signal". Once TTS receives the "long entry signal", the TTS will open a long position and send an alert or automated trade message via webhook to a broker, based on the Entry settings defined in TTS. If the TTS Entry settings specify a "Market" order type, then the open long position will be executed by TTS immediately. But if the TTS Entry settings specify a "Stop" order type with a 1% Stop Distance, then when the price of the security rises by 1% after the "long entry signal" occurs, the TTS will open a long position and the Long Entry alert or webhook to the broker will be sent.
🤔 How to Guide
💢 How to connect a "signal" from a "Signal Indicator" ❓
The "Template Trailing Strategy (Backtester)" was designed to receive external signals from a "Signal Indicator". In this way, a "new trading idea" can be developed, configured, and evaluated separately from the TTS. Similarly, the SI can be held constant, and the trading mechanics can change in the TTS settings and back-tested to answer questions such as, "Am I better with a different stop loss placement method, what if I used a limit order instead of a stop order to enter, what if I used 25% margin instead of trading spot market?"
To make that possible by connecting an external signal indicator to TTS, you should:
Add both your SI (e.g. "Two MA Signal Indicator" , "Click Signal Indicator" , "Signal Adapter" , "Signal Composer" ) and the TTS script to the same chart.
Open the script's Settings / Inputs dialog for the TTS.
In the 🛠️ STRATEGY group set 𝐃𝐞𝐚𝐥 𝐂𝐨𝐧𝐝𝐢𝐨𝐧𝐬 𝐌𝐨𝐝𝐞 to 🔨External (this makes TTS listen to an external signal source).
Still inside 🛠️ STRATEGY locate the 🔌𝐒𝐢𝐠𝐧𝐚𝐥 🛈 input and choose the plotted output of your SI. The option should look like: "<SI short title>:🔌Signal to TTS" .
Verbose troubleshooting & tips
If the SI does not appear in the 🔌Signal 🛈 selector, confirm both scripts are added to the same chart and the SI exposes a plotted series (title often "🔌Signal to TTS").
When using multiple SIs, pick the SI instance that actually outputs the "🔌Signal to TTS" plotted series.
Validate on the chart: when your SI changes state, the plotted "🔌Signal" series in the TTS (visible in the data window) should change accordingly.
The TTS accepts only signals that follow the tts_convention DealConditions structure. Do not attempt to feed arbitrary scalar series without using conv.getDealConditions / conv.DealConditions.
Make sure your SI composes a DealConditions value following the TTS convention (startLong, endLong, startShort, endShort — optional cancel fields). See the template below.
If the plot is present but TTS does not react, ensure the SI plot is non-repainting (or accept realtime/backtest limitations). Test on historical bars first.
Create alerts on the strategy (see the Alerts section). Use the {{strategy.order.alert_message}} placeholder in the Create Alert dialog to forward TTS messages.
💢 How to create a custom trading logic ❓
The "Template Trailing Strategy (Backtester)" provides two ways to plug in your custom trading logic. Both of them have their advantages and disadvantages.
✍️ Develop your own Customized "Signal Indicator" 💥
The first approach is meant to be used for relatively more complex trading logic. The advantages of this approach are the full control and customization you have over the trading logic and the relatively simple configuration setup by having two scripts only. The downsides are that you have to have some experience with pinescript or you are willing to learn and experiment. You should also know the exact formula for every indicator you will use since you have to write it by yourself. Copy-pasting from existing open-source indicators will get you started quite fast though.
The idea here is either to create a new indicator script from scratch or to copy an existing non-signal indicator and make it a "Signal Indicator". To create a new script, press the "Pine Editor" button below the chart to open the "Pine Editor" and then press the "Open" button to open the drop-down menu with the templates. Select the "New Indicator" option. Add it to your chart to copy an existing indicator and press the source code {} button. Its source code will be shown in the "Pine Editor" with a warning on top stating that this is a read-only script. Press the "create a working copy". Now you can give a descriptive title and a short title to your script, and you can work on (or copy-paste) the (other) indicators of your interest. Once you have the information needed to decide, define a DealConditions object and plot it like this:
import jason5480/tts_convention/ as conv
// Calculate the start, end, cancel start, cancel end conditions
dealConditions = conv.DealConditions.new(
startLongDeal = ,
startShortDeal = ,
endLongDeal = ,
endShortDeal = ,
cnlStartLongDeal = ,
cnlStartShortDeal = ,
cnlEndLongDeal = ,
cnlEndShortDeal = )
// Use this signal in scripts like "Template Trailing Strategy (Backtester)" and "Signal Composer" that can utilize its value
// Emit the current signal value according to the TTS framework convention
plot(series = conv.getSignal(dealConditions), title = '🔌Signal to TTS', color = #808000, editable = false, display = display.data_window + display.status_line, precision = 0)
You should import the latest version of the tts_convention library and write your deal conditions appropriately based on your trading logic and put them in the code section shown above by replacing the "…" part after "=". You can omit the conditions that are not relevant to your logic. For example, if you use only market orders for entering and exiting your positions the cnlStartLongDeal, cnlStartShortDeal, cnlEndLongDeal, and cnlEndShortDeal are irrelevant to your case and can be safely omitted from the DealConditions object. After successfully compiling your new custom SI script add it to the same chart with the TTS by pressing the "Add to chart" button. If all goes well, you will be able to connect your "signal" to the TTS as described in the "How to connect a "signal" from a "Signal Indicator"?" guide.
🧩 Adapt and Combine existing non-signal indicators 💥
The second approach is meant to be used for relatively simple trading logic. The advantages of this approach are the lack of pine script and coding experience needed and the fact that it can be used with closed-source indicators as long as the decision-making part is displayed as a line in the chart. The drawback is that you have to have a subscription that supports the "indicator on indicator" feature so you can connect the output of one indicator as an input to another indicator. Please check if your plan supports that feature here
To plug in your own logic that way you have to add your indicator(s) of preference in the chart and then add the "Signal Adapter" script in the same chart as well. This script is a "Signal Indicator" that can be used as a proxy to define your custom logic in the CONDITIONS group of the "Settings/Inputs" tab after defining your inputs from your preferred indicators in the VARIABLES group. Then a "signal" will be produced, if your logic is simple enough it can be directly connected to the TTS that is also added to the same chart for execution. Check the "How to connect a "signal" from a "Signal Indicator"?" in the "🤔 How to Guide" for more information.
If your logic is slightly more complicated, you can add a second "Signal Adapter" in your chart. Then you should add the "Signal Composer" in the same chart, go to the SIGNALS group of the "Settings/Inputs" tab, and connect the "signals" from the "Signal Adapters". "Signal Composer" is also a SI so its composed "signal" can be connected to the TTS the same way it is described in the "How to connect a "signal" from a "Signal Indicator"?" guide.
At this point, due to the composability of the framework, you can add an arbitrary number (bounded by your subscription of course) of "Signal Adapters" and "Signal Composers" before connecting the final "signal" to the TTS.
💢 How to set up ⏰Alerts ❓
The "Template Trailing Strategy (Backtester)" provides a fully customizable per-event alert mechanism. This means that you may have an entirely different message for entering and exiting into a position, hitting a stop-loss or a take-profit target, changing trailing targets, etc. There are no restrictions, and this gives you great flexibility.
First enable the events you want under the "🔔 ALERT MESSAGES" module. Each enabled event exposes a text area where you can craft the message using placeholders that TTS replaces with actual values when the event occurs.
The placeholder categories (exact names used by the script) are:
Chart & instrument:
{{ticker}}
{{base_currency}}
{{quote_currency}}
Entry / exit / stop / TP prices & offsets:
{{entry_price}}
{{exit_price}}
{{stop_loss_price}}
{{take_profit_price_1}} ... {{take_profit_price_5}}
{{entry+_price}}, {{entry-_price}}, {{exit+_price}}, {{exit-_price}} — Optional offset helpers (computed using "Offset Ticks")
Quantities, percents & derived quantities:
{{entry_base_quantity}} — base units at entry (e.g. BTC)
{{entry_quote_quantity}} — quote amount at entry (e.g. USD)
{{risk_perc}} — % of capital risked for that entry (multiplied by 100 when "Percentage Range " is enabled)
{{remaining_quantity_perc}} — % of the initial position remaining at close/SL
{{remaining_base_quantity}} — remaining base units at close/SL
{{take_profit_quantity_perc_1}} ... {{take_profit_quantity_perc_5}} — % sold/bought at each TP
{{take_profit_base_quantity_1}} ... {{take_profit_base_quantity_5}} — base units closed at each TP
❗ Important: the per-event alert text is injected into the Create Alert dialog using TradingView's strategy placeholder:
{{strategy.order.alert_message}}
During the creation of a strategy alert, make sure the placeholder {{strategy.order.alert_message}} exists in the "Message" box. TradingView will substitute the per-event text you configured and enabled in TTS Settings/Inputs before sending it via webhook/notification.
Tip: For webhook/broker execution, set the proper "Condition" in the Create Alert dialog (for changing-entry/exit/SL notifications use "Order fills and alert() function calls" or "alert() function calls only" as appropriate).
💢 How to execute my orders in a broker ❓
To execute your orders in a broker that supports webhook integration, you should enable the appropriate alerts in the "Template Trailing Strategy (Backtester)" first (see the "How to set up Alerts?" guide above). Then you should go to the "Create Alert/Notifications" tab check the "Webhook URL" and paste the URL provided by your broker. You have to read the documentation of your broker for more information on what messages are expected.
Keep in mind that some brokers have deep integration with TradingView so a per-event alert approach might be overkill.
📑 Definitions
This section tries to give some definitions in terms that appear in the "Settings/Inputs" tab of the "Template Trailing Strategy (Backtester)"
💢 What is Trailing ❓
Trailing is a technique where a price target follows another "barrier" price (usually high or low) by trying to keep a maximum distance from the "barrier" when it moves in only one direction (up or down). When the "barrier" moves in the other direction the price target will not change. There are as many types of trailing as price targets, which means that there are entry trailing, exit trailing, stop-loss trailing, and take-profit trailing techniques.
💢 What is a Moonbag ❓
A Moonbag in a trade is the quantity of the position that is reserved and will not be exited even if all take-profit targets defined in the strategy are hit, the quantity will be exited only if the stop-loss is hit or a close signal is received. This makes the stop-loss trailing technique in a trend-following strategy a good candidate to take advantage of a Moonbag.
💢 What is Distance ❓
Distance is the difference between two prices.
💢 What is Bias ❓
Bias is a psychological phenomenon where you make decisions based on market sentiment. For example, when you want to enter a long position you have a long bias, and when you want to exit from the long position you have a short bias. It is the other way around for the short position.
💢 What is the Bias Distance of a price target ❓
The Bias Distance of a price target is the distance that the target will deviate from its initial price. The direction of this deviation depends on the bias of the market. For example, suppose you are in a long position, and you set a take-profit target to the local highest high. In that case, adding a bias distance of five ticks will place your take-profit target 5 ticks below this local highest high because you have a short bias when exiting a long position. When the bias is long the bias distance will be added resulting in a higher target price and when you have a short bias the bias distance will be subtracted.
⚙️ Settings
In the "Settings/Inputs" tab of the "Template Trailing Strategy (Backtester)", you can find all the customizable settings that are provided by the framework. The variety of those settings is vast; hence we will only scratch the surface here. However, for every setting, there is an information icon 🛈 where you can learn more if you mouse over it. The "Settings/Inputs" tab is divided into ten main groups. Each one of them is responsible for one module of the framework. Every setting is part of a group that is named after the module it represents. So, to spot the module of a setting find the title that appears above it comes with an emoji and uppercase letters. Some settings might have the same name but belong to different modules e.g. "Tgt Dist Mtd" (Target Distance Method). Some settings are indented, which means that they are closely related to the non-indented setting above. Usually, indented settings provide further configuration for one or more options of the non-indented setting above. The groups that correspond to each module of the framework are the following:
🗺️ Quick Module Cross-Reference (use emojis to jump to setting groups)
📆 FILTERS — session, date & weekday filters
🛠️ STRATEGY — internal vs external deal-conditions; pick the signal source
🔧 STRATEGY – INTERNAL — built-in Two MA logic for demonstration purposes
🎢 VOLATILITY — ATR / StDev update modes
🔷 ENTRY — entry order types & trailing
🎯 TAKE PROFIT — multi-step TP and trailing rules
🛑 STOP LOSS — stop placement, move-to-breakeven, trailing
🟪 EXIT — exit order types & cancel logic
💰 QUANTITY/RISK MANAGEMENT — position sizing, moonbag, limits
📊 ANALYTICS — stats, streaks, seasonal tables
🔔 ALERT MESSAGES — per-event alert templates & placeholders
😲 Caveats
💢 Does "Template Trailing Strategy (Backtester)" have repainting behavior? ❓
The answer is that the "Template Trailing Strategy (Backtester)" does not repaint as long as the "Signal Indicator" that is connected also does not repaint. If you developed your own SI make sure that you understand and know how to prevent this behavior. The publication by @PineCoders here will give you a good idea on how to avoid most of the repainting cases.
⚠️ There is an exception though, when the "Enable Trail⚠️💹" checkbox is checked, the Take Profit trailing feature is enabled, and a tick-based approach is used, meaning that after a while, when the TradingView discards all the real-time data, assumptions will be made by the backtesting engine that will cause a form of repainting. To avoid making false assumptions please disable this feature in the early stages and evaluate its usefulness in your strategy later on, after first confirming the success of the logic without this feature. In this case, consider turning on the bar magnifier feature. This way you will get more accurate backtest results when the Take Profit trailing feature is enabled.
💢 Can "Template Trailing Strategy (Backtester)" satisfy all my trading strategies ❓
While this framework can satisfy quite a large number of trading strategies there are cases where it cannot do so. For example, if you have a custom logic for your stop-loss or take-profit placement, or if you want to dollar cost average, then it might be better to start a new strategy script from scratch.
⚠️ It is not recommended to copy the official TTS code and start developing unless you are a Pine wizard! Even in that case, there is a stiff learning curve that might not be worth your time. Last, you must consider that I do not offer support for customized versions of the TTS script and if something goes wrong in the process you are all alone.
💝 Support & Feedback
For feedback, bug reports, or feature requests, contact me via TradingView PM or use the script comments.
Note: The author's personal links and contact are available on the TradingView profile.
🤗 Thanks
Special thanks to the welcoming community members, who regularly gave feedback all those years and helped me to shape the framework as it is today! Thanks everyone who contributed by either filing a "defect report" or asking questions that helped me to understand what improvements were necessary to help traders.
Enjoy!
Jason

SAR+RSI+EMAs SignalsNOTE:
Indicator based strategies may expire and begin to work again. There are various ways to check the expiration of these strategies but I suggest equity curve trading (EC trading) as the best one.
Please check every single indicator based strategy to see if it’s still profitable or it has been expired to avoid losses.
Principles:
I personally believe every profitable indicator-based setup need 3 factors. Actually I analyze indicator-based set up in this way!
1- Trend detector: a tool that detect the “trend”.
2- Oscillators (Discount finder): a tool that detects “discounts” in the direction of the trend.
3- Stimulus: A tool that indicates the Initiation of a movement.
There may be profitable strategies that do not use all three, because other factors are strong enough to lead us to profit, but they are rare and sometimes they hide the other forgotten factor in the main two ones.
Elements:
(Since most of traders here, are familiar with these famous indicators I will not take your time to write about their uses and formula)
SAR: As a Trend detector, regarding position of close and SAR
EMA 7 and EMA 21: As trend detectors, regarding position of EMA 7 as fast “moving average” and EMA 21 as slow one. Also we need another confirmation for trend regarding EMA 7 and closing price of the signal candle.
RSI: In this strategy RSI is used both as a discount finder and a stimulus.
For RSI being over/under 50, regarding the trend, a possible discount may have been occurred. Imagine these conditions: close>EMA7, EMA7>EMA21, close>SAR and simultaneously RSI being under 50 is really a sign of powerful uptrend which it’s RSI decreasing might be a sign of corrective move, which will be following a bullish impulsive move.
The other use of RSI is to stimulate a buy signal by “crossing” over 50 or 30 (50 as balanced point of momentum and 30 as a sign of ending an oversold) or stimulate a sell signal by “crossing” under 50 or 70 (50 as balanced point of momentum and 70 as a sign of ending an overbought).
Entry point: you can use one of the followings.
1- Open of the next candle
2- EMA 7
3- Open of the signal candle
(Totally optional but “open of the next candle” is suggested by me.)
SL: Use one of the followings.
1- SAR or some pips (regarding ATR Or your experience of this trading instrument’s fluctuations in this time frame) below the SAR
2- Fixed amount (regarding ATR Or your experience of this trading instrument’s fluctuations in this time frame)
3- Use EMA21 as dynamic SL (if a candle far enough from the initiative candle close over (for sell) below ( for buy)
Again number 1 is suggested by me.
TP: Use one of the followings.
1- Use static levels or zones of support and resistance as TP.
2- Use dynamic levels for instance band of BB or moving averages (Moving the SL is possible).
3- Use fixed R to R
And I believe static zones of support and resistance work better.
Examples:
I indicate a buy signal on the chart!
Using local level as TP worked just good.
Using EMA was better in this case.
And using a riskier level or a fixed R to R is obvious in the chart!
Since in the range markets, this strategy may not work well and at the same time, TP to SL might be too small to be worth the risk, I prefer to use levels to filter range market conditions!
I convert all those circumstances to a simple buy and sell signs on the chart!
EMA21 and SAR are still visible because it is possible that traders use them for their TP and SL.
This is how it look without EMA21 and SAR!
Another screenshot of this strategy!
I also add a check box to filter signals by another trend detector. MATD created by me to help traders detect trend!
As it’s visible, some profitable signals filtered too, but using a longer-term trend detector as an additional one, alongside the double EMAs is very useful for this strategy.
The other box “use high&low instead of close for fast EMA” makes the “EMA7 and close” trend detector an easygoing one!
Almost everything is editable here!
*** I did not invent this strategy, you can find it for free on net ***
I'll change it to a "strategy" instead of an indicator if reader like to!

MS Market Timing ModelThis script uses subtle sentiment analysis to try to reduce the risk of positioning in assets. By "assets" I mean: the QQQ ETF as a synonym for positioning in Nasdaq-100 stocks and the TLT ETF as a placeholder for US government bonds with very long maturity and that as a risk-averse alternative. The coloring of the pseudo capital curve means:
* green = 100% QQQ
* red = 100% TLT
* yellow = 50% QQQ/50% TLT

statisticsLibrary "statistics"
General statistics library.
erf(x) The "error function" encountered in integrating the normal
distribution (which is a normalized form of the Gaussian function).
Parameters:
x : The input series.
Returns: The Error Function evaluated for each element of x.
erfc(x)
Parameters:
x : The input series
Returns: The Complementary Error Function evaluated for each alement of x.
sumOfReciprocals(src, len) Calculates the sum of the reciprocals of the series.
For each element 'elem' in the series:
sum += 1/elem
Should the element be 0, the reciprocal value of 0 is used instead
of NA.
Parameters:
src : The input series.
len : The length for the sum.
Returns: The sum of the resciprocals of 'src' for 'len' bars back.
mean(src, len) The mean of the series.
(wrapper around ta.sma).
Parameters:
src : The input series.
len : The length for the mean.
Returns: The mean of 'src' for 'len' bars back.
average(src, len) The mean of the series.
(wrapper around ta.sma).
Parameters:
src : The input series.
len : The length for the average.
Returns: The average of 'src' for 'len' bars back.
geometricMean(src, len) The Geometric Mean of the series.
The geometric mean is most important when using data representing
percentages, ratios, or rates of change. It cannot be used for
negative numbers
Since the pure mathematical implementation generates a very large
intermediate result, we performed the calculation in log space.
Parameters:
src : The input series.
len : The length for the geometricMean.
Returns: The geometric mean of 'src' for 'len' bars back.
harmonicMean(src, len) The Harmonic Mean of the series.
The harmonic mean is most applicable to time changes and, along
with the geometric mean, has been used in economics for price
analysis. It is more difficult to calculate; therefore, it is less
popular than eiter of the other averages.
0 values are ignored in the calculation.
Parameters:
src : The input series.
len : The length for the harmonicMean.
Returns: The harmonic mean of 'src' for 'len' bars back.
median(src, len) The median of the series.
(a wrapper around ta.median)
Parameters:
src : The input series.
len : The length for the median.
Returns: The median of 'src' for 'len' bars back.
variance(src, len, biased) The variance of the series.
Parameters:
src : The input series.
len : The length for the variance.
biased : Wether to use the biased calculation (for a population), or the
unbiased calculation (for a sample set). .
Returns: The variance of 'src' for 'len' bars back.
stdev(src, len, biased) The standard deviation of the series.
Parameters:
src : The input series.
len : The length for the stdev.
biased : Wether to use the biased calculation (for a population), or the
unbiased calculation (for a sample set). .
Returns: The standard deviation of 'src' for 'len' bars back.
skewness(src, len) The skew of the series.
Skewness measures the amount of distortion from a symmetric
distribution, making the curve appear to be short on the left
(lower prices) and extended to the right (higher prices). The
extended side, either left or right is called the tail, and a
longer tail to the right is called positive skewness. Negative
skewness has the tail extending towards the left.
Parameters:
src : The input series.
len : The length for the skewness.
Returns: The skewness of 'src' for 'len' bars back.
kurtosis(src, len) The kurtosis of the series.
Kurtosis describes the peakedness or flatness of a distribution.
This can be used as an unbiased assessment of whether prices are
trending or moving sideways. Trending prices will ocver a wider
range and thus a flatter distribution (kurtosis < 3; negative
kurtosis). If prices are range-bound, there will be a clustering
around the mean and we have positive kurtosis (kurtosis > 3)
Parameters:
src : The input series.
len : The length for the kurtosis.
Returns: The kurtosis of 'src' for 'len' bars back.
excessKurtosis(src, len) The normalized kurtosis of the series.
kurtosis > 0 --> positive kurtosis --> trending
kurtosis < 0 --> negative krutosis --> range-bound
Parameters:
src : The input series.
len : The length for the excessKurtosis.
Returns: The excessKurtosis of 'src' for 'len' bars back.
normDist(src, len, value) Calculates the probability mass for the value according to the
src and length. It calculates the probability for value to be
present in the normal distribution calculated for src and length.
Parameters:
src : The input series.
len : The length for the normDist.
value : The series of values to calculate the normal distance for
Returns: The normal distance of 'value' to 'src' for 'len' bars back.
normDistCumulative(src, len, value) Calculates the cumulative probability mass for the value according
to the src and length. It calculates the cumulative probability for
value to be present in the normal distribution calculated for src
and length.
Parameters:
src : The input series.
len : The length for the normDistCumulative.
value : The series of values to calculate the cumulative normal distance
for
Returns: The cumulative normal distance of 'value' to 'src' for 'len' bars
back.
zScore(src, len, value) Returns then z-score of objective to the series src.
It returns the number of stdev's the objective is away from the
mean(src, len)
Parameters:
src : The input series.
len : The length for the zScore.
value : The series of values to calculate the cumulative normal distance
for
Returns: The z-score of objectiv with respect to src and len.
er(src, len) Calculates the efficiency ratio of the series.
It measures the noise of the series. The lower the number, the
higher the noise.
Parameters:
src : The input series.
len : The length for the efficiency ratio.
Returns: The efficiency ratio of 'src' for 'len' bars back.
efficiencyRatio(src, len) Calculates the efficiency ratio of the series.
It measures the noise of the series. The lower the number, the
higher the noise.
Parameters:
src : The input series.
len : The length for the efficiency ratio.
Returns: The efficiency ratio of 'src' for 'len' bars back.
fractalEfficiency(src, len) Calculates the efficiency ratio of the series.
It measures the noise of the series. The lower the number, the
higher the noise.
Parameters:
src : The input series.
len : The length for the efficiency ratio.
Returns: The efficiency ratio of 'src' for 'len' bars back.
mse(src, len) Calculates the Mean Squared Error of the series.
Parameters:
src : The input series.
len : The length for the mean squared error.
Returns: The mean squared error of 'src' for 'len' bars back.
meanSquaredError(src, len) Calculates the Mean Squared Error of the series.
Parameters:
src : The input series.
len : The length for the mean squared error.
Returns: The mean squared error of 'src' for 'len' bars back.
rmse(src, len) Calculates the Root Mean Squared Error of the series.
Parameters:
src : The input series.
len : The length for the root mean squared error.
Returns: The root mean squared error of 'src' for 'len' bars back.
rootMeanSquaredError(src, len) Calculates the Root Mean Squared Error of the series.
Parameters:
src : The input series.
len : The length for the root mean squared error.
Returns: The root mean squared error of 'src' for 'len' bars back.
mae(src, len) Calculates the Mean Absolute Error of the series.
Parameters:
src : The input series.
len : The length for the mean absolute error.
Returns: The mean absolute error of 'src' for 'len' bars back.
meanAbsoluteError(src, len) Calculates the Mean Absolute Error of the series.
Parameters:
src : The input series.
len : The length for the mean absolute error.
Returns: The mean absolute error of 'src' for 'len' bars back.

Volume Zone Oscillator (VZO)My interpretation of Walid Khalil's Volume Zone Oscillator (VZO) as published in the 2009 International Federation of Technical Analysis Journal.
This VZO indicator is also the same as Danielle Shay's popular Simpler Trading TurboVZO indicator.
ABOUT:
The oscillator breaks up volume activity into positive and negative categories. It is positive when the current closing price is greater than the prior closing price and negative when it's lower than the prior closing price. The resulting curve plots through relative percentage levels that yield a series of buy and sell signals, depending on level and indicator direction.
HOW TO USE THE INDICATOR:
The default period is 14 but can be adjusted after backtesting.
The VZO points to a positive trend when it rises above and maintains the 5% level, and a negative trend when it falls below the 5% level and fails to turn higher. Oscillations between the 5% and 40% levels mark a bullish trend zone, while oscillations between -40% and 5% mark a bearish trend zone. Meanwhile, readings above 40% signal an overbought condition, while readings above 60% signal an extremely overbought condition. Alternatively, readings below -40% indicate an oversold condition, which becomes extremely oversold below -60%.
Kahlil recommends confirming VZO signals with a 14-period average directional index (ADX), with values greater than 18 pointing to a trending market - search Tradingview's built-in indicators for the Directional Movement Index (DMI).
INTRADAY SCALPING:
Whilst the VZO is already smoothed with an exponential moving average, the indicator settings include an additional 'smoothing' function to remove any excess 'noise' in the plots for intraday use.

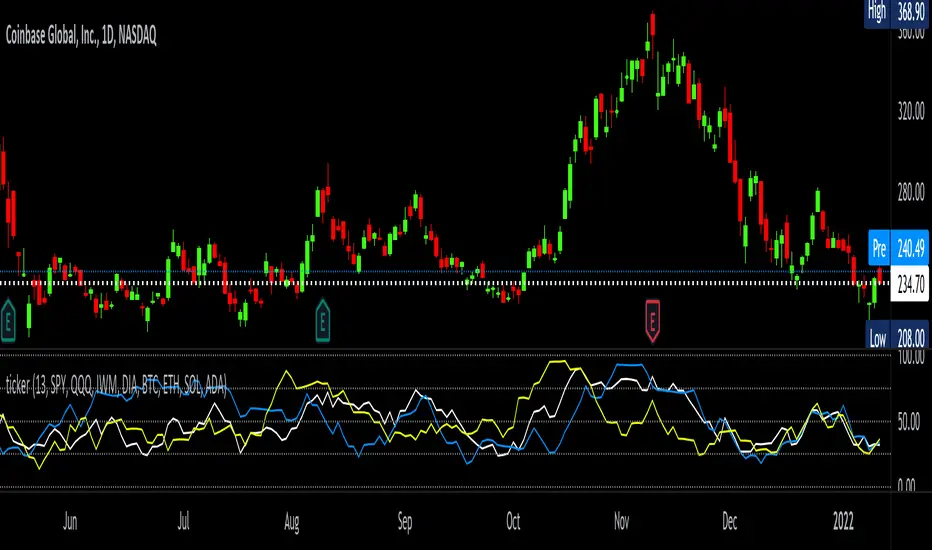
tickerTracker MFI OscillatorDid you ever want to have a neat indicator window in line with your chart showing a different ticker? tickerTracker is a Money Flow Index (MFI) oscillator. The Money Flow Index (MFI) is a technical oscillator that uses price and volume for identifying overbought or oversold conditions in an asset. More or less, everything is connected in the market. The tickerTracker lets you see what is happening with another ticker that you have connected a correlation between them. For my example here, I'm using COIN in the main chart with the tickerTracker displaying BTC, QQQ and COIN Money Flow Index (MFI) in its window. As the end user, you can customize the colors, the length input and the ticker. Like any other indicator, the shorter length input, the more quickly responsive and the longer the length input, the smoother curve print.
Default Values:
MFI Length = 13
Chart ticker = white
SPY = white
QQQ = blue
IWM = yellow
DIA = orange
BTC/USD = yellow
ETH/USD = green
SOL/USD = purple
ADA/USD = red
Do your own due diligence, your risk is 100% your responsibility. This is for educational and entertainment purposes only. You win some or you learn some. Consider being charitable with some of your profit to help humankind. Good luck and happy trading friends...
*3x lucky 7s of trading*
7pt Trading compass:
Price action, entry/exit
Volume average/direction
Trend, patterns, momentum
Newsworthy current events
Revenue
Earnings
Balance sheet
7 Common mistakes:
+5% portfolio trades, capital risk management
Beware of analyst's motives
Emotions & Opinions
FOMO : bad timing, the market is ruthless, be shrewd
Lack of planning & discipline
Forgetting restraint
Obdurate repetitive errors, no adaptation
7 Important tools:
Trading View app!, Brokerage UI
Accurate indicators & settings
Wide screen monitor/s
Trading log (pencil & graph paper)
Big, organized desk
Reading books, playing chess
Sorted watch-list
Checkout my indicators:
Fibonacci VIP - volume
Fibonacci MA7 - price
pi RSI - trend momentum
TTC - trend channel
AlertiT - notification
tickerTracker - MFI Oscillator
www.tradingview.com
TFS Volume Oscillator Noise FilteredINTRODUCTION
This indicator is inspired from " HPotter’s TFS: Volume Oscillator " but I have used Heiken Ashi and Hull Moving Average in calculations in order to reduce noise for better trades.
The concept is similar to that of On-Balance Volume indicator (OBV). It is calculated according to these rules:
If Heiken Ashi Close > Heiken Ashi Open, Volume is positive
If Heiken Ashi Close < Heiken Ashi Open, Volume is negative
If Heiken Ashi Close = Heiken Ashi Open, Volume is neutral
BAR COLORS
Green Color:
Strong Uptrend with good volume supported momentum.
Faded Green Color:
Volume is relatively weakening.
Red Color:
Strong Downtrend with volume support.
Gray Color:
Downtrend negative volume is relatively weakening.
DEFAULTS SETTINGS
Volume length is 30 (Better for timeframes higher than 1H)
Hull Moving Average length is 14 but Linear Regression Curve can be selected with same length

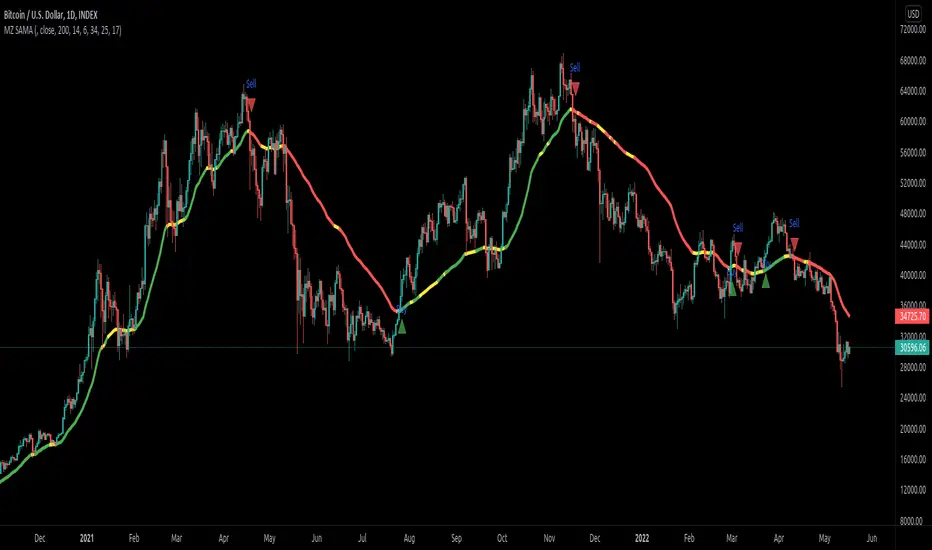
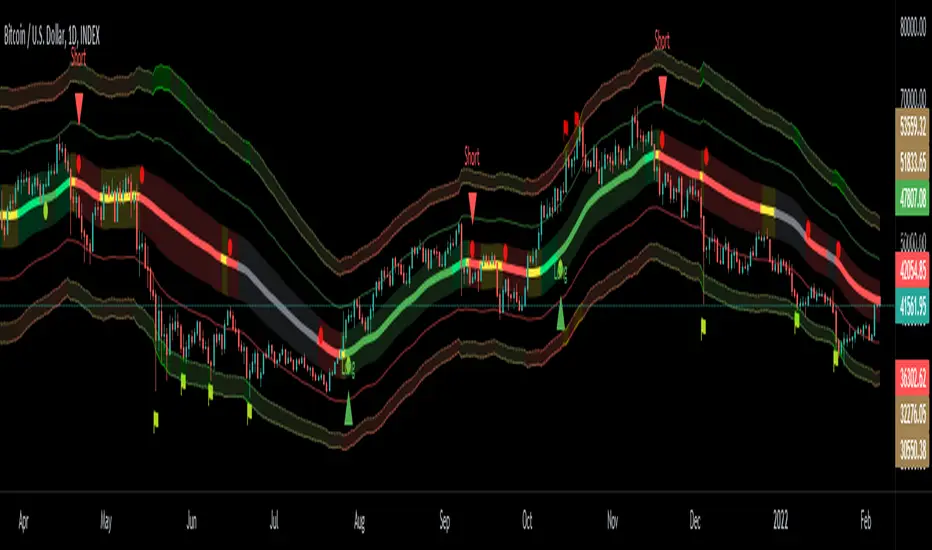
Slope Adaptive Moving Average (MZ SAMA)INTRODUCTION
This script is inspired from "Vitali Apirine (Stocks & Commodities V.36:5: Adaptive Moving Averages)" and a correction to Dynamic Volume Adaptive Moving Average (MZ DVAMA) . I have used slope filtering in order to adapt trends more precisely for better trades.
Slope adaption makes it better for adaptive moving average to detect trend health; making it easier to make decisions based on market strong price momentums, consolidations or breakouts. This isn’t possible with only using simply Adaptive Moving Averages .
Adaptive Moving Averages curve doesn’t change its length based on Slope but it uses slope adaptive color for trend strength detection.
TREND DETECTION
Green Color:
Strong Uptrend with good price momentum.
Red Color:
Strong Downtrend.
Yellow Color:
Market is either choppy, sideways or consolidating. Better to avoid taking new positions and if trade is running then its good to carry it on.
DEFAULTS SETTINGS
AMA length is 200 (Better for timeframes higher than 1H)
Minor length is 6
Major length is 14
Slope period is set to 34 with 25 of initial range. Consolidation is always below 17.
ALERTS
Buy/Sell Alerts will follow on when slope is out of consolidation/choppiness area. Best entry is at absolute alerts timing but other trades can be started midway based on trend condition.
pandas_taLibrary "pandas_ta"
Level: 3
Background
Today is the first day of 2022 and happy new year every tradingviewers! May health and wealth go along with you all the time. I use this chance to publish my 1st PINE v5 lib : pandas_ta
This is not a piece of cake like thing, which cost me a lot of time and efforts to build this lib. Beyond 300 versions of this script was iterated in draft.
Function
Library "pandas_ta"
PINE v5 Counterpart of Pandas TA - A Technical Analysis Library in Python 3 at github.com
The Original Pandas Technical Analysis (Pandas TA) is an easy to use library that leverages the Pandas package with more than 130 Indicators and Utility functions and more than 60 TA Lib Candlestick Patterns.
I realized most of indicators except Candlestick Patterns because tradingview built-in Candlestick Patterns are even more powerful!
I use this to verify pandas_ta python version indicators for myself, but I realize that maybe many may need similar lib for pine v5 as well.
Function Brief Descriptions (Pls find details in script comments)
bton --> Binary to number
wcp --> Weighted Closing Price (WCP)
counter --> Condition counter
xbt --> Between
ebsw --> Even Better SineWave (EBSW)
ao --> Awesome Oscillator (AO)
apo --> Absolute Price Oscillator (APO)
xrf --> Dynamic shifted values
bias --> Bias (BIAS)
bop --> Balance of Power (BOP)
brar --> BRAR (BRAR)
cci --> Commodity Channel Index (CCI)
cfo --> Chande Forcast Oscillator (CFO)
cg --> Center of Gravity (CG)
cmo --> Chande Momentum Oscillator (CMO)
coppock --> Coppock Curve (COPC)
cti --> Correlation Trend Indicator (CTI)
dmi --> Directional Movement Index(DMI)
er --> Efficiency Ratio (ER)
eri --> Elder Ray Index (ERI)
fisher --> Fisher Transform (FISHT)
inertia --> Inertia (INERTIA)
kdj --> KDJ (KDJ)
kst --> 'Know Sure Thing' (KST)
macd --> Moving Average Convergence Divergence (MACD)
mom --> Momentum (MOM)
pgo --> Pretty Good Oscillator (PGO)
ppo --> Percentage Price Oscillator (PPO)
psl --> Psychological Line (PSL)
pvo --> Percentage Volume Oscillator (PVO)
qqe --> Quantitative Qualitative Estimation (QQE)
roc --> Rate of Change (ROC)
rsi --> Relative Strength Index (RSI)
rsx --> Relative Strength Xtra (rsx)
rvgi --> Relative Vigor Index (RVGI)
slope --> Slope
smi --> SMI Ergodic Indicator (SMI)
sqz* --> Squeeze (SQZ) * NOTE: code sufferred from very strange error, code was commented.
sqz_pro --> Squeeze PRO(SQZPRO)
xfl --> Condition filter
stc --> Schaff Trend Cycle (STC)
stoch --> Stochastic (STOCH)
stochrsi --> Stochastic RSI (STOCH RSI)
trix --> Trix (TRIX)
tsi --> True Strength Index (TSI)
uo --> Ultimate Oscillator (UO)
willr --> William's Percent R (WILLR)
alma --> Arnaud Legoux Moving Average (ALMA)
xll --> Dynamic rolling lowest values
dema --> Double Exponential Moving Average (DEMA)
ema --> Exponential Moving Average (EMA)
fwma --> Fibonacci's Weighted Moving Average (FWMA)
hilo --> Gann HiLo Activator(HiLo)
hma --> Hull Moving Average (HMA)
hwma --> HWMA (Holt-Winter Moving Average)
ichimoku --> Ichimoku Kinkō Hyō (ichimoku)
jma --> Jurik Moving Average Average (JMA)
kama --> Kaufman's Adaptive Moving Average (KAMA)
linreg --> Linear Regression Moving Average (linreg)
mgcd --> McGinley Dynamic Indicator
rma --> wildeR's Moving Average (RMA)
sinwma --> Sine Weighted Moving Average (SWMA)
ssf --> Ehler's Super Smoother Filter (SSF) © 2013
supertrend --> Supertrend (supertrend)
xsa --> X simple moving average
swma --> Symmetric Weighted Moving Average (SWMA)
t3 --> Tim Tillson's T3 Moving Average (T3)
tema --> Triple Exponential Moving Average (TEMA)
trima --> Triangular Moving Average (TRIMA)
vidya --> Variable Index Dynamic Average (VIDYA)
vwap --> Volume Weighted Average Price (VWAP)
vwma --> Volume Weighted Moving Average (VWMA)
wma --> Weighted Moving Average (WMA)
zlma --> Zero Lag Moving Average (ZLMA)
entropy --> Entropy (ENTP)
kurtosis --> Rolling Kurtosis
skew --> Rolling Skew
xev --> Condition all
zscore --> Rolling Z Score
adx --> Average Directional Movement (ADX)
aroon --> Aroon & Aroon Oscillator (AROON)
chop --> Choppiness Index (CHOP)
xex --> Condition any
cksp --> Chande Kroll Stop (CKSP)
dpo --> Detrend Price Oscillator (DPO)
long_run --> Long Run
psar --> Parabolic Stop and Reverse (psar)
short_run --> Short Run
vhf --> Vertical Horizontal Filter (VHF)
vortex --> Vortex
accbands --> Acceleration Bands (ACCBANDS)
atr --> Average True Range (ATR)
bbands --> Bollinger Bands (BBANDS)
donchian --> Donchian Channels (DC)
kc --> Keltner Channels (KC)
massi --> Mass Index (MASSI)
natr --> Normalized Average True Range (NATR)
pdist --> Price Distance (PDIST)
rvi --> Relative Volatility Index (RVI)
thermo --> Elders Thermometer (THERMO)
ui --> Ulcer Index (UI)
ad --> Accumulation/Distribution (AD)
cmf --> Chaikin Money Flow (CMF)
efi --> Elder's Force Index (EFI)
ecm --> Ease of Movement (EOM)
kvo --> Klinger Volume Oscillator (KVO)
mfi --> Money Flow Index (MFI)
nvi --> Negative Volume Index (NVI)
obv --> On Balance Volume (OBV)
pvi --> Positive Volume Index (PVI)
dvdi --> Dual Volume Divergence Index (DVDI)
xhh --> Dynamic rolling highest values
pvt --> Price-Volume Trend (PVT)
Remarks
I also incorporated func descriptions and func test script in commented mode, you can test the functino with the embedded test script and modify them as you wish.
This is a Level 3 free and open source indicator library.
Feedbacks are appreciated.
This is not the end of pandas_ta lib publication, but it is start point with pine v5 lib function and I will add more and more funcs into this lib for my own indicators.
Function Name List:
bton()
wcp()
count()
xbt()
ebsw()
ao()
apo()
xrf()
bias()
bop()
brar()
cci()
cfo()
cg()
cmo()
coppock()
cti()
dmi()
er()
eri()
fisher()
inertia()
kdj()
kst()
macd()
mom()
pgo()
ppo()
psl()
pvo()
qqe()
roc()
rsi()
rsx()
rvgi()
slope()
smi()
sqz_pro()
xfl()
stc()
stoch()
stochrsi()
trix()
tsi()
uo()
willr()
alma()
wcx()
xll()
dema()
ema()
fwma()
hilo()
hma()
hwma()
ichimoku()
jma()
kama()
linreg()
mgcd()
rma()
sinwma()
ssf()
supertrend()
xsa()
swma()
t3()
tema()
trima()
vidya()
vwap()
vwma()
wma()
zlma()
entropy()
kurtosis()
skew()
xev()
zscore()
adx()
aroon()
chop()
xex()
cksp()
dpo()
long_run()
psar()
short_run()
vhf()
vortex()
accbands()
atr()
bbands()
donchian()
kc()
massi()
natr()
pdist()
rvi()
thermo()
ui()
ad()
cmf()
efi()
ecm()
kvo()
mfi()
nvi()
obv()
pvi()
dvdi()
xhh()
pvt()

Dynamic Volume Adaptive Moving Average (MZ DVAMA)INTRODUCTION
This indicator is inspired from "Vitali Apirine (Stocks & Commodities V.36:5: Adaptive Moving Averages)" but I have used Volume filtering to in order to adapt trends more precisely for better trades.
Volume adaption makes it better for adaptive moving average to detect trend health; making it easier to make decisions based on market strong momentums, consolidations or breakouts. This isn’t possible with only using simply Adaptive Moving Averages .
Adaptive Moving Averages curve doesn’t change its length based on Volume but it uses dynamic volume adaptive color for trend strength detection.
TREND DETECTION
Green Color:
Strong Uptrend with good volume supported momentum.
Lime Color:
Uptrend is relatively weak but still good enough to follow.
Red Color:
Strong Downtrend with volume support.
Gray Color:
Downtrend is relatively weak but still good enough to follow.
Yellow Color:
Market is either choppy, sideways or consolidating. Better to avoid taking new positions and if trade is running then its good to carry it on.
DEFAULTS SETTINGS
AMA length is 200 (Better for timeframes higher than 1H)
Minor length is 6
Major length is 14
Volume RSI period is considered to be 200 with 50 period for its Hull Moving Average
ALERTS
Buy/Sell Alerts will follow on when volume is breaking up above provided value. Best entry is at absolute alerts timing but other trades can be started midway based on trend condition.
ROC PercentileRate Of Change Percentile calculates the current ROC (user defined length) as a percentile rank.
We use 2 separate arrays, one for all positive ROC values and one for all negative values within a defined lookback period. Then the current ROC value is compared to those arrays to find it's percentile ranking.
For example, a ranking of 75 means the ROC is in the 75th percentile of all POSITIVE ROC values over the lookback period.
A ranking of -80 is in the 80th percentile of all NEGATIVE ROC values over the lookback period.
Most ROC scripts use raw ROC values (or smoothed or otherwise altered), or have stochastic formula applied to them, I've not seen one that displays ROC as percentile ranking of previous positive/negative values.
What is the advantage?
Raw ROC data only gives half the picture. What we want to do is compare the ROC to previous ROC values, to give a sense of scale. Raw ROC values don't give you that context and you can only compare visually, usually limited to the number of bars you can see on your screen.
Using a percentile ranking gives us the context of current Rate of Change relative to the previous Rate of Change over a large lookback period, and not just visually but mathematically.
Why not using a long stochastic ROC? The problem with stochastics in general is that an outlier data point can ruin the data for the rest of the lookback period.
For example, imagine a huge outlier 8% ROC. The 2nd largest ROC is 4% and the 3rd largest is 2%, with all other values below this.
In this example, a stochastic ROC would display the 8% outlier as 100, the 4% as 50, the 2% as 25 and all other data would be squeezed down between 0-25.
Additionally, a value of 60 may have vastly different meaning depending on whether the lookback period contains a large outlier or not.
With a percentile ranking, that 8% outlier would still have a value of 100. But the 4% and 2% would be 99 and 98 respectively (this assumes 100 data points in the series, in reality values will usually be decimals).
This effectively flattens the curve and gives a more consistent and dependable experience, allowing you to more accurately assess the relative importance of the current ROC.
The line of circles is set at the 50 and -50 values for quick comparison.
Values > 50 represent ROC greater than 50% of previous positive ROC values.
Values < -50 represent ROC greater than 50% of previous negative ROC values.

BTC Golden Bottom with Adaptive Moving AverageIntroduction:
This study uses Adaptive Moving Average with 1 year of length to plot on all time history Index Calculated by Tradingview . All previous $BTC bear runs bottomed on this curve which makes it important enough. Use this only on " "
Default Values:
AMA length is 1 year
Minor length is 50
Major length is 100
